2024 State of Marketing Report – by HubspotMarius Sescu
https://www.hubspot.com/state-of-marketing
· Scaling relationships and proving ROI
· Social media is the place for search, sales, and service
· Authentic influencer partnerships fuel brand growth
· The strongest connections happen via call, click, chat, and camera.
· Time saved with AI leads to more creative work
· Seeking: A single source of truth
· TLDR; Get on social, try AI, and align your systems.
· More human marketing, powered by robots
ChatGPT is a revolutionary addition to the world since its introduction in 2022. A big shift in the sector of information gathering and processing happened because of this chatbot. What is the story of ChatGPT? How is the bot responding to prompts and generating contents? Swipe through these slides prepared by Expeed Software, a web development company regarding the development and technical intricacies of ChatGPT!
Product Design Trends in 2024 | Teenage EngineeringsPixeldarts
The realm of product design is a constantly changing environment where technology and style intersect. Every year introduces fresh challenges and exciting trends that mold the future of this captivating art form. In this piece, we delve into the significant trends set to influence the look and functionality of product design in the year 2024.
How Race, Age and Gender Shape Attitudes Towards Mental HealthThinkNow
Mental health has been in the news quite a bit lately. Dozens of U.S. states are currently suing Meta for contributing to the youth mental health crisis by inserting addictive features into their products, while the U.S. Surgeon General is touring the nation to bring awareness to the growing epidemic of loneliness and isolation. The country has endured periods of low national morale, such as in the 1970s when high inflation and the energy crisis worsened public sentiment following the Vietnam War. The current mood, however, feels different. Gallup recently reported that national mental health is at an all-time low, with few bright spots to lift spirits.
To better understand how Americans are feeling and their attitudes towards mental health in general, ThinkNow conducted a nationally representative quantitative survey of 1,500 respondents and found some interesting differences among ethnic, age and gender groups.
Technology
For example, 52% agree that technology and social media have a negative impact on mental health, but when broken out by race, 61% of Whites felt technology had a negative effect, and only 48% of Hispanics thought it did.
While technology has helped us keep in touch with friends and family in faraway places, it appears to have degraded our ability to connect in person. Staying connected online is a double-edged sword since the same news feed that brings us pictures of the grandkids and fluffy kittens also feeds us news about the wars in Israel and Ukraine, the dysfunction in Washington, the latest mass shooting and the climate crisis.
Hispanics may have a built-in defense against the isolation technology breeds, owing to their large, multigenerational households, strong social support systems, and tendency to use social media to stay connected with relatives abroad.
Age and Gender
When asked how individuals rate their mental health, men rate it higher than women by 11 percentage points, and Baby Boomers rank it highest at 83%, saying it’s good or excellent vs. 57% of Gen Z saying the same.
Gen Z spends the most amount of time on social media, so the notion that social media negatively affects mental health appears to be correlated. Unfortunately, Gen Z is also the generation that’s least comfortable discussing mental health concerns with healthcare professionals. Only 40% of them state they’re comfortable discussing their issues with a professional compared to 60% of Millennials and 65% of Boomers.
Race Affects Attitudes
As seen in previous research conducted by ThinkNow, Asian Americans lag other groups when it comes to awareness of mental health issues. Twenty-four percent of Asian Americans believe that having a mental health issue is a sign of weakness compared to the 16% average for all groups. Asians are also considerably less likely to be aware of mental health services in their communities (42% vs. 55%) and most likely to seek out information on social media (51% vs. 35%).
AI Trends in Creative Operations 2024 by Artwork Flow.pdfmarketingartwork
This article is all about what AI trends will emerge in the field of creative operations in 2024. All the marketers and brand builders should be aware of these trends for their further use and save themselves some time!
A report by thenetworkone and Kurio.
The contributing experts and agencies are (in an alphabetical order): Sylwia Rytel, Social Media Supervisor, 180heartbeats + JUNG v MATT (PL), Sharlene Jenner, Vice President - Director of Engagement Strategy, Abelson Taylor (USA), Alex Casanovas, Digital Director, Atrevia (ES), Dora Beilin, Senior Social Strategist, Barrett Hoffher (USA), Min Seo, Campaign Director, Brand New Agency (KR), Deshé M. Gully, Associate Strategist, Day One Agency (USA), Francesca Trevisan, Strategist, Different (IT), Trevor Crossman, CX and Digital Transformation Director; Olivia Hussey, Strategic Planner; Simi Srinarula, Social Media Manager, The Hallway (AUS), James Hebbert, Managing Director, Hylink (CN / UK), Mundy Álvarez, Planning Director; Pedro Rojas, Social Media Manager; Pancho González, CCO, Inbrax (CH), Oana Oprea, Head of Digital Planning, Jam Session Agency (RO), Amy Bottrill, Social Account Director, Launch (UK), Gaby Arriaga, Founder, Leonardo1452 (MX), Shantesh S Row, Creative Director, Liwa (UAE), Rajesh Mehta, Chief Strategy Officer; Dhruv Gaur, Digital Planning Lead; Leonie Mergulhao, Account Supervisor - Social Media & PR, Medulla (IN), Aurelija Plioplytė, Head of Digital & Social, Not Perfect (LI), Daiana Khaidargaliyeva, Account Manager, Osaka Labs (UK / USA), Stefanie Söhnchen, Vice President Digital, PIABO Communications (DE), Elisabeth Winiartati, Managing Consultant, Head of Global Integrated Communications; Lydia Aprina, Account Manager, Integrated Marketing and Communications; Nita Prabowo, Account Manager, Integrated Marketing and Communications; Okhi, Web Developer, PNTR Group (ID), Kei Obusan, Insights Director; Daffi Ranandi, Insights Manager, Radarr (SG), Gautam Reghunath, Co-founder & CEO, Talented (IN), Donagh Humphreys, Head of Social and Digital Innovation, THINKHOUSE (IRE), Sarah Yim, Strategy Director, Zulu Alpha Kilo (CA).
Trends In Paid Search: Navigating The Digital Landscape In 2024Search Engine Journal
The search marketing landscape is evolving rapidly with new technologies, and professionals, like you, rely on innovative paid search strategies to meet changing demands.
It’s important that you’re ready to implement new strategies in 2024.
Check this out and learn the top trends in paid search advertising that are expected to gain traction, so you can drive higher ROI more efficiently in 2024.
You’ll learn:
- The latest trends in AI and automation, and what this means for an evolving paid search ecosystem.
- New developments in privacy and data regulation.
- Emerging ad formats that are expected to make an impact next year.
Watch Sreekant Lanka from iQuanti and Irina Klein from OneMain Financial as they dive into the future of paid search and explore the trends, strategies, and technologies that will shape the search marketing landscape.
If you’re looking to assess your paid search strategy and design an industry-aligned plan for 2024, then this webinar is for you.
5 Public speaking tips from TED - Visualized summarySpeakerHub
From their humble beginnings in 1984, TED has grown into the world’s most powerful amplifier for speakers and thought-leaders to share their ideas. They have over 2,400 filmed talks (not including the 30,000+ TEDx videos) freely available online, and have hosted over 17,500 events around the world.
With over one billion views in a year, it’s no wonder that so many speakers are looking to TED for ideas on how to share their message more effectively.
The article “5 Public-Speaking Tips TED Gives Its Speakers”, by Carmine Gallo for Forbes, gives speakers five practical ways to connect with their audience, and effectively share their ideas on stage.
Whether you are gearing up to get on a TED stage yourself, or just want to master the skills that so many of their speakers possess, these tips and quotes from Chris Anderson, the TED Talks Curator, will encourage you to make the most impactful impression on your audience.
See the full article and more summaries like this on SpeakerHub here: https://speakerhub.com/blog/5-presentation-tips-ted-gives-its-speakers
See the original article on Forbes here:
http://www.forbes.com/forbes/welcome/?toURL=http://www.forbes.com/sites/carminegallo/2016/05/06/5-public-speaking-tips-ted-gives-its-speakers/&refURL=&referrer=#5c07a8221d9b
ChatGPT and the Future of Work - Clark Boyd Clark Boyd
Everyone is in agreement that ChatGPT (and other generative AI tools) will shape the future of work. Yet there is little consensus on exactly how, when, and to what extent this technology will change our world.
Businesses that extract maximum value from ChatGPT will use it as a collaborative tool for everything from brainstorming to technical maintenance.
For individuals, now is the time to pinpoint the skills the future professional will need to thrive in the AI age.
Check out this presentation to understand what ChatGPT is, how it will shape the future of work, and how you can prepare to take advantage.
A brief introduction to DataScience with explaining of the concepts, algorithms, machine learning, supervised and unsupervised learning, clustering, statistics, data preprocessing, real-world applications etc.
It's part of a Data Science Corner Campaign where I will be discussing the fundamentals of DataScience, AIML, Statistics etc.
Time Management & Productivity - Best PracticesVit Horky
Here's my presentation on by proven best practices how to manage your work time effectively and how to improve your productivity. It includes practical tips and how to use tools such as Slack, Google Apps, Hubspot, Google Calendar, Gmail and others.
The six step guide to practical project managementMindGenius
The six step guide to practical project management
If you think managing projects is too difficult, think again.
We’ve stripped back project management processes to the
basics – to make it quicker and easier, without sacrificing
the vital ingredients for success.
“If you’re looking for some real-world guidance, then The Six Step Guide to Practical Project Management will help.”
Dr Andrew Makar, Tactical Project Management
Unlocking the Power of ChatGPT and AI in Testing - A Real-World Look, present...Applitools
During this webinar, Anand Bagmar demonstrates how AI tools such as ChatGPT can be applied to various stages of the software development life cycle (SDLC) using an eCommerce application case study. Find the on-demand recording and more info at https://applitools.info/b59
Key takeaways:
• Learn how to use ChatGPT to add AI power to your testing and test automation
• Understand the limitations of the technology and where human expertise is crucial
• Gain insight into different AI-based tools
• Adopt AI-based tools to stay relevant and optimize work for developers and testers
* ChatGPT and OpenAI belong to OpenAI, L.L.C.
More than Just Lines on a Map: Best Practices for U.S Bike Routes
This session highlights best practices and lessons learned for U.S. Bike Route System designation, as well as how and why these routes should be integrated into bicycle planning at the local and regional level.
Presenters:
Presenter: Kevin Luecke Toole Design Group
Co-Presenter: Virginia Sullivan Adventure Cycling Association
Ride the Storm: Navigating Through Unstable Periods / Katerina Rudko (Belka G...DevGAMM Conference
Has your project been caught in a storm of deadlines, clashing requirements, and the need to change course halfway through? If yes, then check out how the administration team navigated through all of this, relocating 160 people from 3 countries and opening 2 offices during the most turbulent time in the last 20 years. Belka Games’ Chief Administrative Officer, Katerina Rudko, will share universal approaches and life hacks that can help your project survive unstable periods when there seem to be too many tasks and a lack of time and people.
Ride the Storm: Navigating Through Unstable Periods / Katerina Rudko (Belka G...
data-visualization_vi.pdf
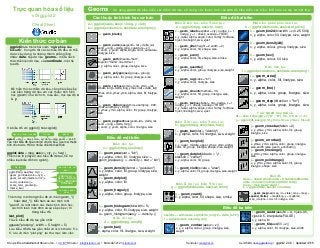
1. Geoms - Sử dụng geom để biểu diễn các điểm dữ liệu, sử dụng các thuộc tính của aes để biểu diễn các biến. Mỗi hàm sẽ tạo ra một lớp
a <- ggplot(seals, aes(x = long, y = lat))
b <- ggplot(economics, aes(date, unemploy))
a + geom_blank()
a + geom_curve(aes(yend = lat + delta_lat,
xend = long + delta_long, curvature = z))
x, xend, y, yend, alpha, angle, color, curvature,
linetype, size
b + geom_path(lineend="butt",
linejoin="round’, linemitre=1)
x, y, alpha, color, group, linetype, size
b + geom_polygon(aes(group = group))
x, y, alpha, color, fill, group, linetype, size
a + geom_rect(aes(xmin = long, ymin = lat,
xmax= long + delta_long, ymax = lat + delta_lat))
xmax, xmin, ymax, ymin, alpha, color, fill, linetype,
size
b + geom_ribbon(aes(ymin=unemploy - 900,
ymax=unemploy + 900))
x, ymax, ymin, alpha, color, fill, group, linetype,
size
a + geom_segment(aes(yend=lat + delta_lat,
xend = long + delta_long))
x, xend, y, yend, alpha, color, linetype, size
a + geom_spoke(aes(yend = lat + delta_lat,
xend = long + delta_long))
x, y, angle, radius, alpha, color, linetype, size
Các thuộc tính hình học cơ bản
c + geom_area(stat = "bin")
x, y, alpha, color, fill, linetype, sizec +
geom_area(aes(y = ..density..), stat = "bin")
c + geom_density(kernel = "gaussian")
x, y, alpha, color, fill, group, linetype, size,
weight
c + geom_dotplot()
x, y, alpha, color, fill
c + geom_freqpoly()
x, y, alpha, color, group, linetype, size
c + geom_histogram(binwidth = 5)
x, y, alpha, color, fill, linetype, size, weight
a + geom_histogram(aes(y = ..density..))
Biến rời rạc
d <- ggplot(mpg, aes(fl))
d + geom_bar()
x, alpha, color, fill, linetype, size, weight
Biến liên tục
c <- ggplot(mpg, aes(hwy))
Biểu đồ một biến
l + geom_contour(aes(z = z))
x, y, z, alpha, colour, group, linetype, size,
weight
seals$z <- with(seals, sqrt(delta_long^2 + delta_lat^2))
l <- ggplot(seals, aes(long, lat))
l + geom_raster(aes(fill = z), hjust=0.5,
vjust=0.5, interpolate=FALSE)
x, y, alpha, fill
l + geom_tile(aes(fill = z))
x, y, alpha, color, fill, linetype, size, width
Biểu đồ ba biến
Biến X rời rạc, biến Y rời rạc
g <- ggplot(diamonds, aes(cut, color))
g + geom_count()
x, y, alpha, color, fill, shape, size, stroke
Biến X rời rạc, biến Y liên tục
f <- ggplot(mpg, aes(class, hwy))
f + geom_bar(stat = "identity")
x, y, alpha, color, fill, linetype, size, weight
f + geom_boxplot()
x, y, lower, middle, upper, ymax, ymin, alpha,
color, fill, group, linetype, shape, size, weight
f + geom_dotplot(binaxis = "y",
stackdir = "center")
x, y, alpha, color, fill, group
f + geom_violin(scale = "area")
x, y, alpha, color, fill, group, linetype, size, weight
Biến X liên tục, biến Y liên tục
e <- ggplot(mpg, aes(cty, hwy))
e + geom_label(aes(label = cty), nudge_x= 1,
nudge_y = 1, check_overlap = TRUE)
x, y, label, alpha, angle, color, family, fontface,
hjust, lineheight, size, vjust
e + geom_jitter(height = 2, width = 2)
x, y, alpha, color, fill, shape, size
e + geom_point()
x, y, alpha, color, fill, shape, size, stroke
e + geom_quantile()
x, y, alpha, color, group, linetype, size, weight
e + geom_rug(sides = "bl")
x, y, alpha, color, linetype, size
e + geom_smooth(method = lm)
x, y, alpha, color, fill, group, linetype, size,
weight
e + geom_text(aes(label = cty), nudge_x = 1,
nudge_y= 1, check_overlap = TRUE)
x, y, label, alpha, angle, color, family, fontface,
hjust, lineheight, size, vjust
A
B
C
A
B
C
Hàm liên tục
i <- ggplot(economics, aes(date, unemploy))
i + geom_area()
x, y, alpha, color, fill, linetype, size
i + geom_line()
x, y, alpha, color, group, linetype, size
i + geom_step(direction = "hv")
x, y, alpha, color, group, linetype, size
Hai biến phân phối liên tục
h <- ggplot(diamonds, aes(carat, price))
j + geom_crossbar(fatten = 2)
x, y, ymax, ymin, alpha, color, fill, group,
linetype, size
j + geom_errorbar()
x, ymax, ymin, alpha, color, group, linetype,
size, width (also geom_errorbarh())
j + geom_linerange()
x, ymin, ymax, alpha, color, group, linetype,
size
j + geom_pointrange()
x, y, ymin, ymax, alpha, color, fill, group,
linetype, shape, size
Trực quan hóa sai số
df <- data.frame(grp = c("A", "B"), fit = 4:5, se = 1:2)
j <- ggplot(df, aes(grp, fit, ymin = fit-se, ymax = fit+se))
data <- data.frame(murder = USArrests$Murder,
state = tolower(rownames(USArrests)))
map <- map_data("state")
k <- ggplot(data, aes(fill = murder))
k + geom_map(aes(map_id = state), map = map) +
expand_limits(x = map$long, y = map$lat)
map_id, alpha, color, fill, linetype, size
Bản đồ
h + geom_bin2d(binwidth = c(0.25, 500))
x, y, alpha, color, fill, linetype, size, weight
h + geom_density2d()
x, y, alpha, colour, group, linetype, size
h + geom_hex()
x, y, alpha, colour, fill, size
Biểu đồ hai biến
Kiến thức cơ bản
Vẽ biểu đồ với ggplot() hoặc qplot()
ggplot2 dựa trên khái niệm “ngữ pháp của
biểu đồ”, trong đó tất cả các biểu đồ đều có thể
được xây dựng từ những thành phần giống
nhau: data - tập dữ liệu, geoms – mô tả cách
thức thể hiện dữ liệu, và coordinate - một hệ
tọa độ.
Để hiển thị các điểm dữ liệu, cần phải sắp xếp
các biến trong dữ liệu với các thuộc tính hình
học (geom) như kích cỡ, màu sắc, trục tọa độ x
& y
ggsave("plot.png", width = 5, height = 5)
Lưu biểu đồ đã tạo gần nhất với kích thước 5’ x
5’, lưu với tên “plot.png” tại thư mục làm việc
qplot(x = cty, y = hwy, color = cyl, data = mpg, geom = "point")
Tạo một biểu đồ hoàn chỉnh với dữ liệu, geom & thuộc
tính cho trước. Hỗ trợ nhiều chế độ mặc định
ggplot(data = mpg, aes(x = cty, y = hwy))
Thêm các lớp (layer) vào biểu đồ đã tạo, hỗ trợ
nhiều loại biểu đồ hơn qplot().
ggplot(mpg, aes(hwy, cty)) +
geom_point(aes(color = cyl)) +
geom_smooth(method ="lm") +
coord_cartesian() +
scale_color_gradient() +
theme_bw()
Thêm các lớp với
dấu +
Lớp (layer) =
geom + default
stat + các thuộc
tính khác
Các thành phần
khác
Thêm lớp mới trong biểu đò với hàm geom_*()
hoặc stat_*(). Mỗi hàm sẽ xác định một
"geom", là một nhóm các thuộc tính hình học,
các tính toán mặc đinh và sự sắp xếp vị trí
trong biểu đồ.
last_plot()
Trả về biểu đồ đã tạo gần nhất
Trực quan hóa số liệu
với ggplot2
Cheat Sheet
RStudio® is a trademark of RStudio, Inc. • CC BY RStudio • info@rstudio.com • 844-448-1212 • rstudio.com Xem thêm: docs.ggplot2.org • ggplot2 2.0.0 • Updated: 12/15
Sắp xếp thuộc tính aes
Dữ liệu
Dữ liệu geom
Translator: ranalytics.vn
2. RStudio® is a trademark of RStudio, Inc. • CC BY RStudio • info@rstudio.com • 844-448-1212 • rstudio.com
Mỗi stat sẽ tạo thêm các biến mới ứng với các
các thuộc tính hình hình học Các biến này sử
dụng cấu trúc thông thường ..name..
Hàm stat và geom đều kết hợp một stat với một
geom để tạo một lớp (layer) mới, VD.
stat_count(geom="bar") cho ra kết quả tương tự
như geom_bar(stat="count")
Stats – cách thức khác để tạo biểu đồ
ggplot() + stat_function(aes(x = -3:3),
fun = dnorm, n = 101, args = list(sd=0.5))
x | ..x.., ..y..
e + stat_identity(na.rm = TRUE)
ggplot() + stat_qq(aes(sample=1:100), distribution = qt,
dparams = list(df=5))
sample, x, y | ..sample.., ..theoretical..
e + stat_sum()
x, y, size | ..n.., ..prop..
e + stat_summary(fun.data = "mean_cl_boot")
h + stat_summary_bin(fun.y = "mean", geom = "bar")
e + stat_unique()
i + stat_density2d(aes(fill = ..level..),
geom = "polygon", n = 100)
Biến mới tạo qua
biến đổi dữ liệu
c + stat_bin(binwidth = 1, origin = 10)
x, y | ..count.., ..ncount.., ..density.., ..ndensity..
c + stat_count(width = 1)
x, y, | ..count.., ..prop..
c + stat_density(adjust = 1, kernel = "gaussian")
x, y, | ..count.., ..density.., ..scaled..
e + stat_bin_2d(bins = 30, drop = TRUE)
x, y, fill | ..count.., ..density..
e + stat_bin_hex(bins = 30)
x, y, fill | ..count.., ..density..
e + stat_density_2d(contour = TRUE, n = 100)
x, y, color, size | ..level..
e + stat_ellipse(level = 0.95, segments = 51, type = "t")
l + stat_contour(aes(z = z))
x, y, z, order | ..level..
l + stat_summary_hex(aes(z = z), bins = 30, fun = mean)
x, y, z, fill | ..value..
l + stat_summary_2d(aes(z = z), bins = 30, fun = mean)
x, y, z, fill | ..value..
f + stat_boxplot(coef = 1.5)
x, y | ..lower.., ..middle.., ..upper.., ..width.. , ..ymin.., ..ymax..
f + stat_ydensity(adjust = 1, kernel = "gaussian", scale = "area")
x, y | ..density.., ..scaled.., ..count.., ..n.., ..violinwidth.., ..width..
e + stat_ecdf(n = 40)
x, y | ..x.., ..y..
e + stat_quantile(quantiles = c(0.25, 0.5, 0.75), formula = y
~ log(x),
method = "rq")
x, y | ..quantile..
e + stat_smooth(method = "auto", formula = y ~ x, se =
TRUE, n = 80,
fullrange = FALSE, level = 0.95)
x, y | ..se.., ..x.., ..y.., ..ymin.., ..ymax..
Biểu đồ
một biến
Biểu đồ
hai biến
Biểu đồ
ba biến
So sánh
Hàm số
Cách dùng
thông dụng
Một số biểu đồ hiển thị dữ liệu đã được biến đổi. Sử
dụng stat để lựa chọn hình thức biến đổi dữ liệu, VD.
a + geom_bar(stat = "count")
Scales – Tỷ lệ
Scales – Tỷ lệ quy định cách thức biểu đồ sắp xếp
dữ liệu với các thuộc tính hình học trên biểu đồ. Để
thay đổi cách sắp xếp này, cần thay đổi tỷ lệ.
n <- b + geom_bar(aes(fill = fl))
n
n + scale_fill_manual(
values = c("skyblue", "royalblue", "blue", "navy"),
limits = c("d", "e", "p", "r"), breaks =c("d", "e",
"p", "r"),
name = "fuel", labels = c("D", "E", "P", "R"))
scale_
aes cần
thay đổi
Sắp xếp tỷ lệ
để sử dụng
Các giá trị
thuộc tính
Khoảng giá trị cho
sắp xếp lại tỷ lệ
Tên sử dụng
cho chú giải
Nhãn sử dụng
cho chú giải
Các giá trị được
dùng cho chú giải
Cách sử dụng thường dùng
Sử dụng với các giá trị aes:
alpha, color, fill, linetype, shape, size
scale_*_continuous() – Sử dụng cho các biến liên tục
scale_*_discrete() – Sử dụng cho các biến rời rạc
scale_*_identity() – Sử dụng giá trị của tập dữ liệu
scale_*_manual(values = c()) – Sắp xếp các biến rời
rạc với các giá trị tùy biến
X and Y location scales
Màu sắc
Hình dạng
Kích cỡ
Sử dụng với các thuộc tính của trục x hoặc y
(phần dưới đây chỉ mô tả trục hoành x)
scale_x_date(date_labels = "%m/%d"),
date_breaks = "2 weeks") - Coi x như biến ngày
tháng.Xem thêm ?strptime về nhãn (label)
scale_x_datetime() - Coi x như biến ngày tháng, sử
dụng các tham số như scale_x_date()
scale_x_log10() – Thê hiện x với tỷ lệ log10
scale_x_reverse() – Giữ nguyên hướng của trục x
scale_x_sqrt() – Thể hiện x với tỷ lệ căn bậc hai
Biến rời rạc Biến liên tục
n <- d + geom_bar(
aes(fill = fl))
o <- c + geom_dotplot(
aes(fill = ..x..))
n + scale_fill_brewer(
palette = "Blues")
Lựa chọn bảng màu:
library(RColorBrewer)
display.brewer.all()
n + scale_fill_grey(
start = 0.2, end = 0.8,
na.value = "red")
o + scale_fill_gradient(
low = "red",
high = "yellow")
o + scale_fill_gradient2(
low = "red", high = "blue",
mid = "white", midpoint = 25)
o + scale_fill_gradientn(
colours = terrain.colors(6))
Xem thêm: rainbow(),
heat.colors(), topo.colors(),
cm.colors(),
RColorBrewer::brewer.pal()
p <- e + geom_point(
aes(shape = fl, size = cyl))
p + scale_shape(
solid = FALSE)
p + scale_shape_manual(
values = c(3:7))
Gía trị thuộc tính hình dạng
trong bảng bên
Giá trị thuộc tính hình dạng
p + scale_size_area(
max_scale = 6)
Kích cỡ dạng tròn
p + scale_radius(
range=c(1,6))
p + scale_size()
r + coord_cartesian(xlim = c(0, 5))
xlim, ylim
Hệ tọa độ Đề-các mặc định
r + coord_fixed(ratio = 1/2)
ratio, xlim, ylim
Hệ tọa độ Đề-các, tỷ lệ x và y cố định
r + coord_flip()
xlim, ylim
Đổi trục tọa độ
r + coord_polar(theta = "x",
direction=1 )
theta, start, direction
Hệ tọa độ cực
r + coord_trans(ytrans = "sqrt")
xtrans, ytrans, limx, limy
Biến đổi hệ tọa độ Đề-các,
r <- d + geom_bar()
π + coord_map(projection = "ortho",
orientation=c(41, -74, 0))
projection, orientation, xlim, ylim
Sử dụng packages mapproj (mercator (mặc định),
azequalarea, lagrange,...)
Coordinate – Hệ tọa độ
Translator: ranalytics.vn
s + geom_bar(position = "dodge")
Đặt các giá trị cạnh nhau
s + geom_bar(position = "fill")
Đặt các giá trị chồng lên nhau, thay đổi tỷ
lệ theo phần trăm
e + geom_point(position = "jitter")
Thêm các yếu tố ngẫu nhiên (random
noise) để tránh chống lấn các điểm trên
biểu đồ
e + geom_label(position = "nudge")
Đặt các nhãn bên cạnh các điểm
s + geom_bar(position = "stack")
Đặt các giá trị chồng lên nhau
s <- ggplot(mpg, aes(fl, fill = drv))
Cách thức sắp xếp các thuộc tính hình học
(geom) trên biểu đồ
Vị trí trong biểu đồ có thể được thay đổi lại thành một
hàm với các tham số của chiều dài và chiều rộng
s + geom_bar(position = position_dodge(width = 1))
A
B
Điều chỉnh vị trí
t + coord_cartesian(
xlim = c(0, 100), ylim = c(10, 20))
Thay đổi dữ liệu
(Loại bỏ các dữ liệu ngoài vùng phân tích)
t + xlim(0, 100) + ylim(10, 20)
t + scale_x_continuous(limits = c(0, 100))
+ scale_y_continuous(limits = c(0, 100))
Không thay đổi dữ liệu (Nên dùng)
Zooming – Phóng tó biểu đồ
n + theme(legend.position = "bottom")
Thay đổi vị trí chú giải: ”up”,“bottom”, “right”,”left”
n + guides(fill = "none")
Quy đinh chú giải cho mỗi thuộc tính: colorbar,
legend, hoặc “none" (không để chú giải)
n + scale_fill_discrete(name = "Title",
labels = c("A", "B", "C", "D", "E"))
Sử dụng hàm tỷ lệ (scale) cho tiêu đề & nhãn trong
chú giải
Chú giải
t <- ggplot(mpg, aes(cty, hwy)) + geom_point()
Chia nhỏ biểu đồ dựa trên giá trị của một hoặc
nhiều biến rời rạc
t + facet_grid(. ~ fl)
Cột chứa biến fl
t + facet_grid(year ~ .)
Hàng chưa biến year
t + facet_grid(year ~ fl)
Chia nhỏ biểu đồ theo cả hàng và cột
t + facet_wrap(~ fl)
Tự động sắp xếp biểu đồ
Quy định tỷ lệ để giới hạn các trục của biểu đồ
khi sử dụng facet
t + facet_grid(drv ~ fl, scales = "free")
Giới hạn trục x & y theo từng biểu đồ
• "free_x" – Tự động điều chỉnh giới hạn trục x
• "free_y" – Tự động điều chỉnh giới hạn trục y
Đặt nhãn, tiêu đồ cho các biểu đồ khi dùng facet
t + facet_grid(. ~ fl, labeller = label_both)
t + facet_grid(fl ~ ., labeller = label_bquote(alpha ^ .(fl)))
t + facet_grid(. ~ fl, labeller = label_parsed)
fl: c fl: d fl: e fl: p fl: r
c d e p r
Hàm stat aes
geom Tham số
Faceting – Chia nhỏ biểu đồ
t + ggtitle("New Plot Title")
Thêm tên biểu đồ
t + xlab("New X label")
Thay đổi tên trục x
t + ylab("New Y label")
Thay đổi tên trục y
t + labs(title =" New title", x = "New x",
y = "New y")
Thay đổi tên biểu đồ và các trục x, y
Sử dụng các hàm tỷ
lệ (scale) để thay đổi,
cập nhật các chú giải
Labels – Tiêu đề & nhãn
r + theme_classic()
Nền classic
r + theme_minimal()
Nền minimal
r + theme_void()
Để trống hình nền
r + theme_bw()
Nền trắng
r + theme_gray()
Nền xám (theme
mặc định)
r + theme_dark()
Nền tối
Themes – Hình nền trong biểu đồ
Xem thêm: docs.ggplot2.org • ggplot2 2.0.0 • Updated: 12/15