Data Management Guidelines
•Research projects often involve the
collection of a large volume of data
• The data have then to be processed and
analyzed
– results and summaries will be published or
presented in some form
• Requires a well-defined system of data
management
3.
Stages of DataManagement in a
Research Project
• The raw data have to be entered into the
computer, and checked for accuracy
• The data have then to be organized into
an appropriate form for analysis
– often in different ways, depending on the
analysis
• The data have to be archived
– remain available throughout subsequent
phases of a project, and afterwards
4.
Software for handlingdata
• Database (DBMS) packages
– Access, EpiInfo
• Statistics packages
– SAS, SPSS, Stata
• Spreadsheet packages
– Excel, Lotus-123
• Word Processors
– Word, WordPerfect or even text editors like
Notepad
5.
Free Software
EpiInfo (availablefor free download):
http://www.cdc.gov/epiinfo/
Allows users to:
• rapidly develop a questionnaire or form
• customize the data entry process
• check data (including double entry)
• analyze data
6.
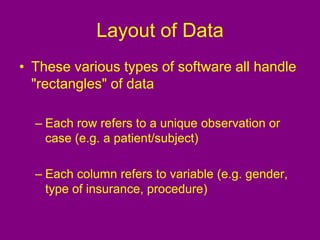
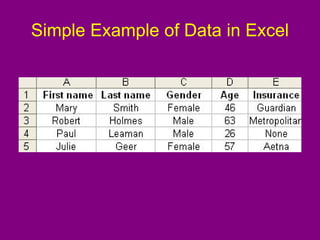
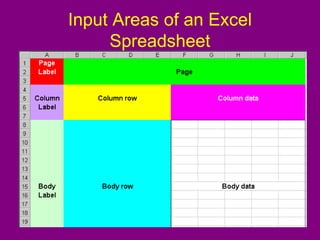
Layout of Data
•These various types of software all handle
"rectangles" of data
– Each row refers to a unique observation or
case (e.g. a patient/subject)
– Each column refers to variable (e.g. gender,
type of insurance, procedure)
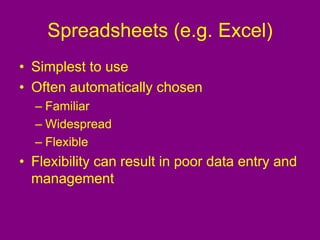
Spreadsheets (e.g. Excel)
•Simplest to use
• Often automatically chosen
– Familiar
– Widespread
– Flexible
• Flexibility can result in poor data entry and
management
9.
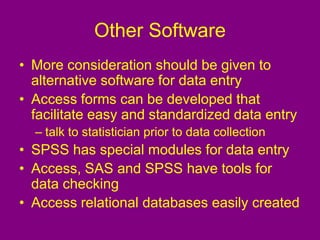
Other Software
• Moreconsideration should be given to
alternative software for data entry
• Access forms can be developed that
facilitate easy and standardized data entry
– talk to statistician prior to data collection
• SPSS has special modules for data entry
• Access, SAS and SPSS have tools for
data checking
• Access relational databases easily created
10.
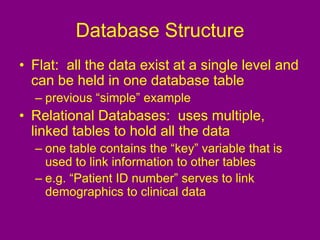
Database Structure
• Flat:all the data exist at a single level and
can be held in one database table
– previous “simple” example
• Relational Databases: uses multiple,
linked tables to hold all the data
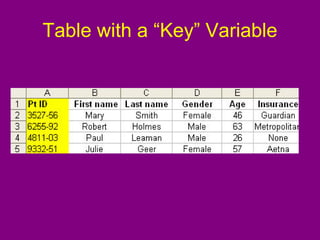
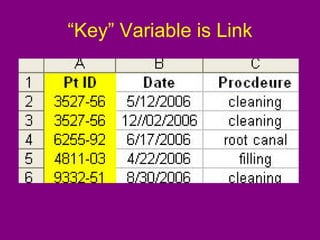
– one table contains the “key” variable that is
used to link information to other tables
– e.g. “Patient ID number” serves to link
demographics to clinical data
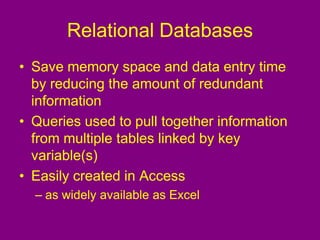
Relational Databases
• Savememory space and data entry time
by reducing the amount of redundant
information
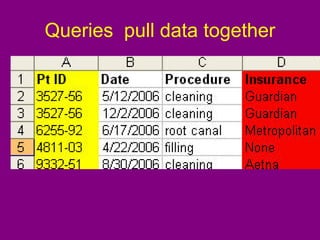
• Queries used to pull together information
from multiple tables linked by key
variable(s)
• Easily created in Access
– as widely available as Excel
15.
Using Excel
• Experiencehas shown that most
researchers use Excel for data entry
• When using Excel, there are some
strategies that should be used to:
– improve data quality
• make easier to analyze
– facilitate accurate data entry
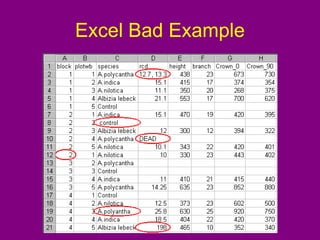
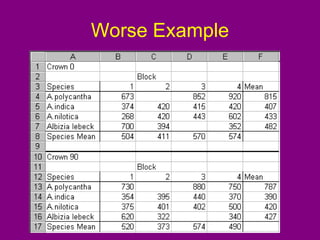
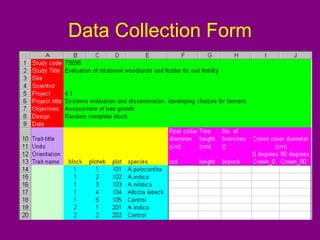
Problems in ExcelExample
• Two of the names under the "species" heading
have been typed slightly differently for the same
species
• The variable "rcd“ has observations that will
cause problems when the data are transferred to
a statistics package for analysis
– row 2 has two measurements entered in one cell
– in row 10, the cell reports that the plant is dead
instead of having a numerical value
18.
Avoiding Problems
• Manyerrors can be avoided by thinking
about the layout of the data in the
spreadsheet before starting data collection
• Good to consider the analyis when
organizing the data in the spreadsheet
Data Entry Recommendations
•Unique identifier
• Freezing panes
• Drop-down lists
• Data validation
• Adding comments to cells
• Formatting cells
• Forms
22.
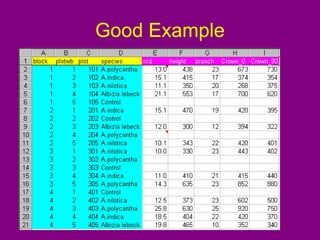
Unique Identifier
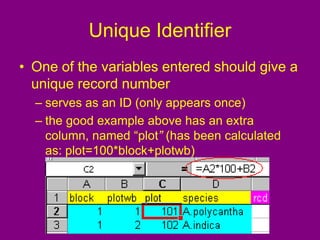
• Oneof the variables entered should give a
unique record number
– serves as an ID (only appears once)
– the good example above has an extra
column, named “plot” (has been calculated
as: plot=100*block+plotwb)
23.
Freezing Panes inExcel
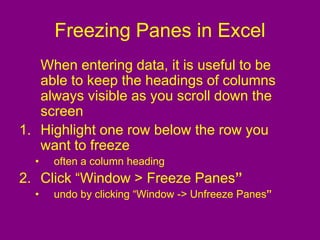
When entering data, it is useful to be
able to keep the headings of columns
always visible as you scroll down the
screen
1. Highlight one row below the row you
want to freeze
• often a column heading
2. Click “Window > Freeze Panes”
• undo by clicking “Window -> Unfreeze Panes”
24.
Drop-Down Lists
• Whenthe same text string is entered
many times, typing/spelling errors
inevitably occur
• Drop-down lists can be used to avoid such
errors
• Ensures standardized and consistent data
entry
25.
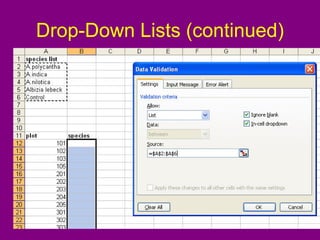
Creating Drop-Down Listsin Excel
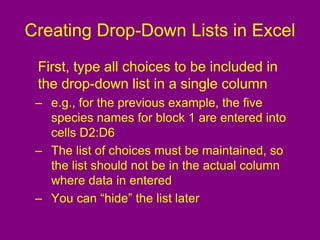
First, type all choices to be included in
the drop-down list in a single column
– e.g., for the previous example, the five
species names for block 1 are entered into
cells D2:D6
– The list of choices must be maintained, so
the list should not be in the actual column
where data in entered
– You can “hide” the list later
26.
Creating Drop-Down
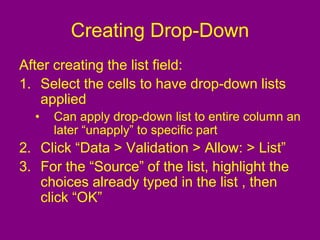
After creatingthe list field:
1. Select the cells to have drop-down lists
applied
• Can apply drop-down list to entire column an
later “unapply” to specific part
2. Click “Data > Validation > Allow: > List”
3. For the “Source” of the list, highlight the
choices already typed in the list , then
click “OK”
Drop-Down Lists (continued)
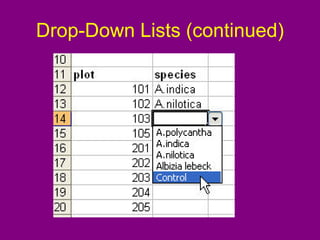
•Once the drop-down list has been created,
selecting a cell in that column will bring up
an indicator triangle on the right side of the
cell
• Clicking on this will display the drop-down
list so that an appropriate selection can be
made from the list
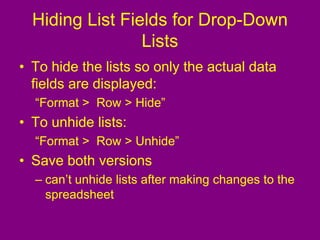
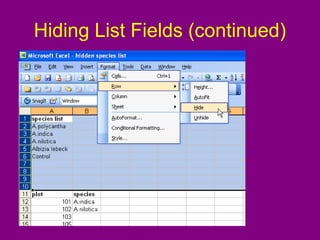
Hiding List Fieldsfor Drop-Down
Lists
• To hide the lists so only the actual data
fields are displayed:
“Format > Row > Hide”
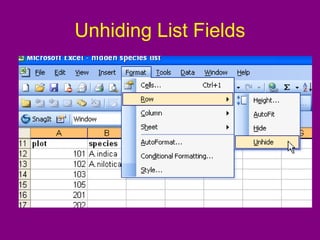
• To unhide lists:
“Format > Row > Unhide”
• Save both versions
– can’t unhide lists after making changes to the
spreadsheet
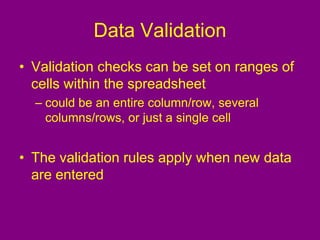
Data Validation
• Validationchecks can be set on ranges of
cells within the spreadsheet
– could be an entire column/row, several
columns/rows, or just a single cell
• The validation rules apply when new data
are entered
34.
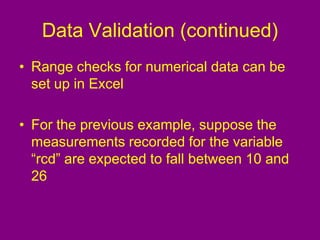
Data Validation (continued)
•Range checks for numerical data can be
set up in Excel
• For the previous example, suppose the
measurements recorded for the variable
“rcd” are expected to fall between 10 and
26
35.
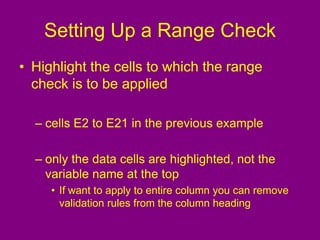
Setting Up aRange Check
• Highlight the cells to which the range
check is to be applied
– cells E2 to E21 in the previous example
– only the data cells are highlighted, not the
variable name at the top
• If want to apply to entire column you can remove
validation rules from the column heading
36.
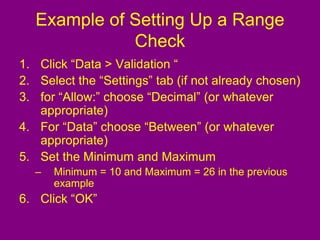
Example of SettingUp a Range
Check
1. Click “Data > Validation “
2. Select the “Settings” tab (if not already chosen)
3. for “Allow:” choose “Decimal” (or whatever
appropriate)
4. For “Data” choose “Between” (or whatever
appropriate)
5. Set the Minimum and Maximum
– Minimum = 10 and Maximum = 26 in the previous
example
6. Click “OK”
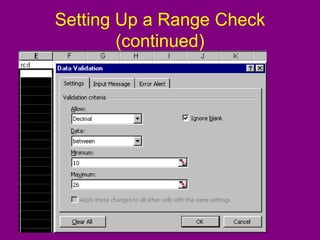
Setting Up aRange Check
(continued)
While the “Data Validation” dialog box is
being used to set up the range check,
you can also set up:
1. An Input Message
2. An Error Alert
39.
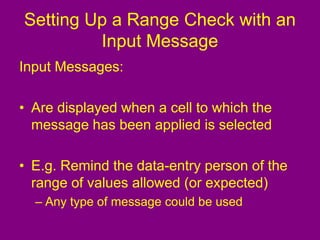
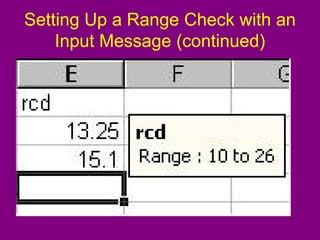
Setting Up aRange Check with an
Input Message
Input Messages:
• Are displayed when a cell to which the
message has been applied is selected
• E.g. Remind the data-entry person of the
range of values allowed (or expected)
– Any type of message could be used
40.
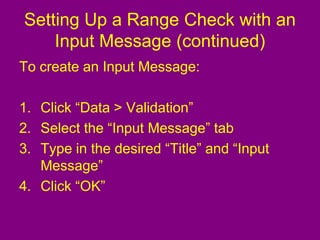
Setting Up aRange Check with an
Input Message (continued)
To create an Input Message:
1. Click “Data > Validation”
2. Select the “Input Message” tab
3. Type in the desired “Title” and “Input
Message”
4. Click “OK”
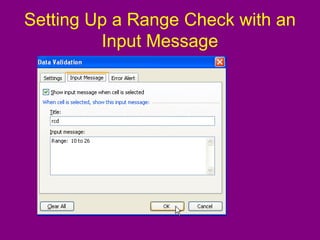
Setting Up aRange Check with an
Input Message (continued)
43.
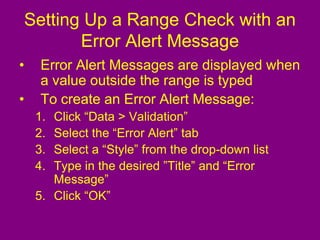
Setting Up aRange Check with an
Error Alert Message
• Error Alert Messages are displayed when
a value outside the range is typed
• To create an Error Alert Message:
1. Click “Data > Validation”
2. Select the “Error Alert” tab
3. Select a “Style” from the drop-down list
4. Type in the desired ”Title” and “Error
Message”
5. Click “OK”
44.
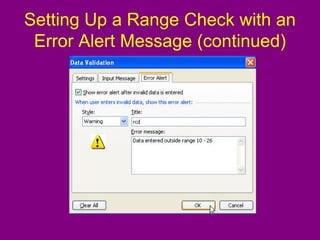
Setting Up aRange Check with an
Error Alert Message (continued)
45.
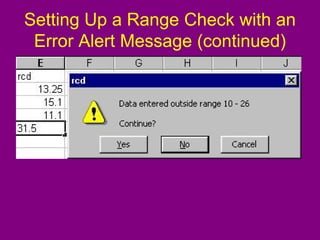
Setting Up aRange Check with an
Error Alert Message (continued)
46.
Adding Comments toCells
• Excel has a facility for adding comments to
a cell
• The comments differ from values within
the cell
• Useful for any unusual observations or
questions concerning a particular data
value
47.
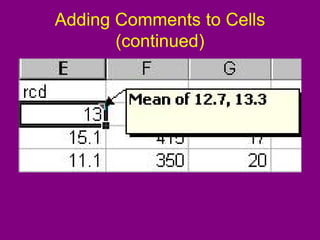
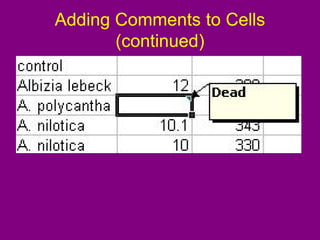
Adding Comments toCells
(continued)
• Recall the example with the data for plot
101 for “rcd” where two values (12.7, 13.3)
were entered on the data recording sheet
• Suppose the researchers decided to
calculate the mean of the two values and
add a comment to the cell
– If several plots had two values recorded, two
columns of “rcd” data could have been
entered with a third column used to calculate
the mean
48.
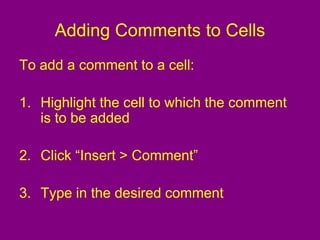
Adding Comments toCells
To add a comment to a cell:
1. Highlight the cell to which the comment
is to be added
2. Click “Insert > Comment”
3. Type in the desired comment
Adding Comments toCells
(continued)
• After the comment is added:
• The cell will now show a red tab in the upper
right corner
• The comment will be displayed when the cell
is selected
52.
Removing Comments fromCells
To remove a comment from a cell:
– e.g., when a query has been resolved and
the correct value has been entered
1. Highlight the cell
2. Right-click “Delete Comment”
53.
Formatting Cells
• Exceloffers many formats that can be
applied to cells
• Only one example of one kind of number
format was be shown
– Note that many more formats are available
54.
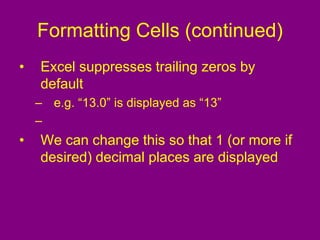
Formatting Cells (continued)
•Excel suppresses trailing zeros by
default
– e.g. “13.0” is displayed as “13”
–
• We can change this so that 1 (or more if
desired) decimal places are displayed
55.
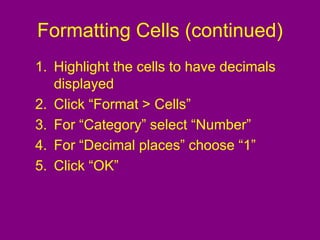
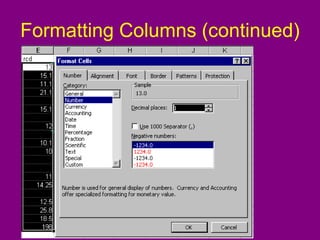
Formatting Cells (continued)
1.Highlight the cells to have decimals
displayed
2. Click “Format > Cells”
3. For “Category” select “Number”
4. For “Decimal places” choose “1”
5. Click “OK”
Formatting Cells (continued)
•Excel offers many other options for
formatting cells
• Only one example of one kind of number
format has been shown
• Explore the other options by clicking
“Format > Cells” and looking at all of the
tabs
– i.e. Alignment, Font, Border,Patterns and
Protection
58.
Forms
• Data entryforms facilitate data entry
• Easier to enter data in a list
• Excel has a built-in Data Form
– 32 fields maximum
59.
Forms for LargerDatasets
• If a data entry form is desired but you have
more than 32 fields:
1.Use Access
2.Use multiple Excel spreadsheets
• Can merge together later
• Be sure to include unique identifier in each
spreadsheet so can link spreadsheets together
3.Download free enhanced data form:
http://j-walk.com/ss/dataform/index.htm
60.
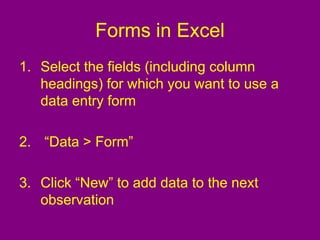
Forms in Excel
1.Select the fields (including column
headings) for which you want to use a
data entry form
2. “Data > Form”
3. Click “New” to add data to the next
observation
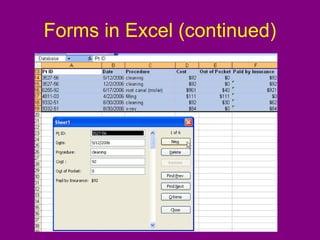
Forms in Excel(continued)
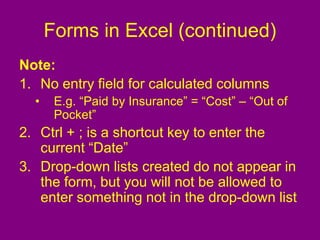
Note:
1. No entry field for calculated columns
• E.g. “Paid by Insurance” = “Cost” – “Out of
Pocket”
2. Ctrl + ; is a shortcut key to enter the
current “Date”
3. Drop-down lists created do not appear in
the form, but you will not be allowed to
enter something not in the drop-down list
63.
Forms in Excel(continued)
• Much more sophisticated “UserForms”
(e.g. with drop-down lists) can be created
using the Visual Basic Editor
– Similar to Access
http://www.contextures.com/xluserform
02.html
64.
Data Auditing
To checkdata that:
1. Has already been entered
2. Has had validation rules (discussed
above) applied or changed after data
entry
65.
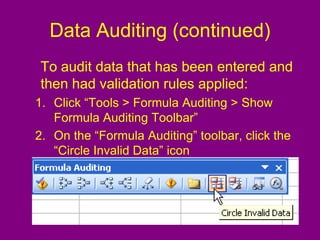
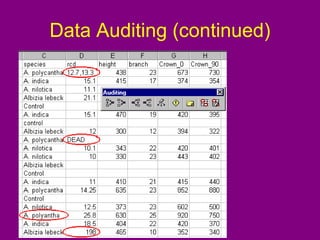
Data Auditing (continued)
Toaudit data that has been entered and
then had validation rules applied:
1. Click “Tools > Formula Auditing > Show
Formula Auditing Toolbar”
2. On the “Formula Auditing” toolbar, click the
“Circle Invalid Data” icon
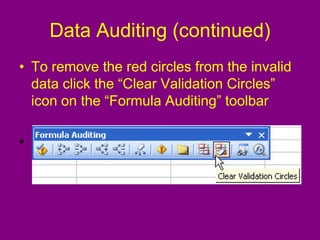
Data Auditing (continued)
•To remove the red circles from the invalid
data click the “Clear Validation Circles”
icon on the “Formula Auditing” toolbar
•
68.
Metadata
Essential if thedataset is to be integrated
with datasets from other studies, or is to
be passed to someone else for analysis
• Where the data came from
• When the data was collected
• What the data represents
• Units of measurements used
69.
Metadata (continued)
• Addingrows and columns to the
spreadsheet before the body of data can
be helpful
• The extra rows will store documentation
that provides background information
about the data
– i.e., the metadata
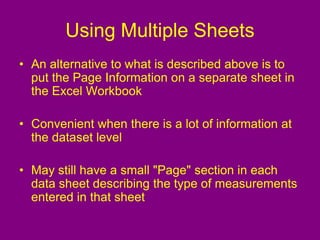
Using Multiple Sheets
•An alternative to what is described above is to
put the Page Information on a separate sheet in
the Excel Workbook
• Convenient when there is a lot of information at
the dataset level
• May still have a small "Page" section in each
data sheet describing the type of measurements
entered in that sheet
73.
Excel’s Limitations
• Noeasy facilities for skipping fields
conditional on the entry of initial codes
• Limited graphical capabilities
– Excel graphics intended for presentation
– No boxplots
– Lacking other exploratory techniques that
could assist in data scrutiny
• Can’t handle too many columns in one
sheet
74.
Data Entry andChecking
The ultimate aim should be a fully-
documented archive of checked, correct,
reliable data that can be subjected to
scientific scrutiny without raising any
doubts in the minds of subsequent
researchers
75.
Make Data Entryas Simple as
Possible
• In a replicated experiment it should never
be necessary to type variety names or
long treatment codes for each patient
– a single letter or number is usually sufficient
– then, either the data entry system can insert
the full code, or the full names may be
available in a separate, "look-up" file
• Simplifying the keying process will speed
the task, make it less tedious and hence
also less error-prone
76.
Enter Data ASAP
•The data should be entered as soon as
possible after data collection
– not so large and daunting as doing all at the
end
– helps checking, some checks can indicate
unusually large changes from the previous
value to allow immediate verification
– feedback of any problems that are noticed to
field data collectors can help maintain the
data quality
77.
Double Entry
• Theideal way to ensure accurate data
entry
• Two different people enter all of the data
separately
– two different databases
• Software is used to identify discrepancies
between the two data sets
– inconsistencies resolved to create the final
database
78.
Only One “MasterCopy"
(if Double Entry not used)
• Problems can arise if multiple copies are
kept of the same data in different formats
• Master copy will increase in size as data
accrues
– changes through the course of data entry
• Process should be documented
• Consistent "version-numbering" system
should used by all people making
modifications to the data
79.
Backing up Data
•Essential to develop a system for regular
"back-ups" (copies) of the data
– not backing up may result in losing data
• Back up copies of data should be made on
separate media from the original master
copy
– e.g., another computer, on CDs, on a network, etc.
• The back up copy should be dated
– date of last revision
80.
Data Checking
• Checkingis done both at the time of
keying and afterwards
• The logical checking phase should be
done by trained staff who understand the
nature of the data
81.
Logical Checking
• Checksto rule out illogical data
– e.g. pregnant males, or minimum greater than
maximum temperature, clinic visits recorded
as dates in the future, range checks, etc.
• Usually involves preliminary analyses,
plotting, etc.
• Reasoned decisions can be made about
what to do with unusual observations
82.
Audit trail
• Completerecord of changes to the data
and decisions made about the data and
the analysis
– like a log book
• Requirement of the scientific method
– must ensure the data management work is
repeatable
• Facilitates subsequent writing of reports
on the data and answering data queries
83.
Audit trail (continued)
•Important to record everything you do at
the time that you do it
– recollections are always poor at a later stage
• When errors are found and changes are
made to the master copy of the data, a
note should be made
– old and new values recorded
84.
Audit trail (continued)
•Keep notes on the analyses done
– including the preliminary analyses done for
checking purposes
• Writing down the names of all files created
– Including back ups
• Every entry in the log-book should be
dated and initialed
85.
Archiving Data
• Alldata and programs from a research
project must be archived in such a way
that they are safe and can be accessed by
a subsequent user
• Use a consistent directory structure and
naming convention for computer files
86.
Archiving Data (continued)
•The archive should give access to all the
information about the study
– during the project, information is located in many
places (e.g. the computer, on paper and other media
and in the minds of the research team)
• The archive need not all be computerized, but it
should include all the relevant information
– The source/location of information not archived
electronically should be recorded in the electronic
archive
87.
Archiving Data (continued)
Ifa proper archiving scheme is not used,
when researchers leave:
• They might take the only copy of their part
of the data (the data is lost)
• Knowledge of the study protocol is lost
resulting in great difficulty when new
investigators join the project
88.
Confidential Data
• Goodidea to password protect confidential
data files
– warn analyst that file is protected
• Patient names, SSN’s etc. should always
be removed
89.
Prevent Modification ofData
• To prevent others from modifying the data
– but they can save changes under a different
file name
“Tools” > “Options” > “Security” >
“Password to Open” > [enter password]”
90.
Prevent Viewing ofData
• To prevent others from viewing the data:
“Tools” > “Options” > “Security” >
“Password to Open” > [enter password]”
91.
References
University of Reading:Statistical
Services Center:
http://www.reading.ac.uk/ssc/
Microsoft Office Applications:
http://www.contextures.com/index.ht
ml


![Prevent Modification of Data
• To prevent others from modifying the data
– but they can save changes under a different
file name
“Tools” > “Options” > “Security” >
“Password to Open” > [enter password]”](https://image.slidesharecdn.com/datamanagement-250913070216-6dfc9fc7/85/DataManagement-excel-manual-and-also-Spreadsheets-pdf-89-320.jpg)
![Prevent Viewing of Data
• To prevent others from viewing the data:
“Tools” > “Options” > “Security” >
“Password to Open” > [enter password]”](https://image.slidesharecdn.com/datamanagement-250913070216-6dfc9fc7/85/DataManagement-excel-manual-and-also-Spreadsheets-pdf-90-320.jpg)


![제 23회 보아즈(BOAZ) 빅데이터 컨퍼런스 - [MBOAX] : ABSA를 활용한 소비자 반응 분석 기반 운영 효율화 대시보드 설계](https://cdn.slidesharecdn.com/ss_thumbnails/3-1boaz23rdconferencemboax-260203102709-9d519923-thumbnail.jpg?width=640&height=640&fit=bounds)


