Download to read offline


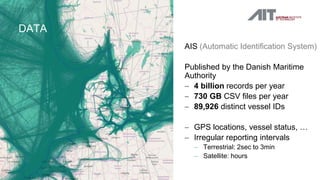
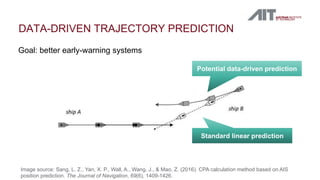
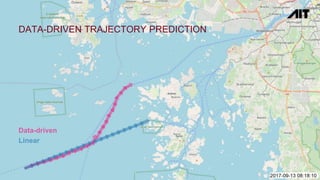

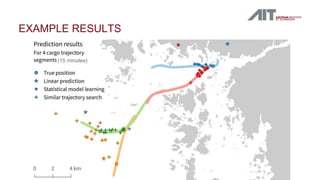

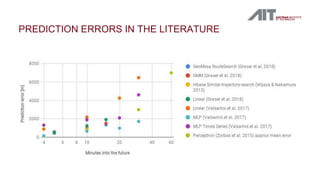
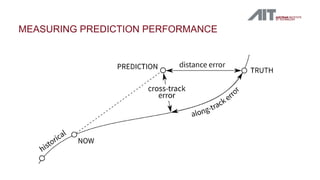
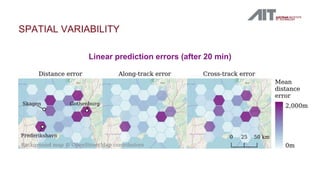
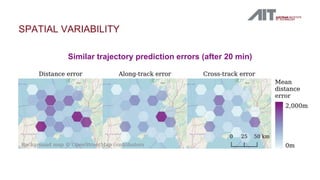
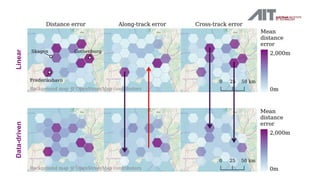
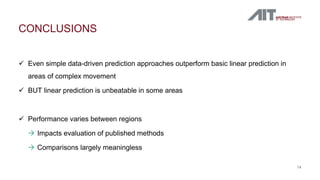


This document discusses data-driven trajectory prediction and the spatial variability of prediction performance in maritime location-based services. It notes that Automatic Identification System data from ships provides billions of records per year but with irregular reporting intervals. The goal is to develop better early-warning systems using data-driven trajectory prediction, though performance varies between regions, impacting the evaluation of published prediction methods. The talk focuses on measuring prediction performance spatially rather than introducing another prediction method.


![The Maritime Security. OSINT [EN] .pdf](https://cdn.slidesharecdn.com/ss_thumbnails/maritimesecurity-240723053511-8c070405-thumbnail.jpg?width=640&height=640&fit=bounds)


