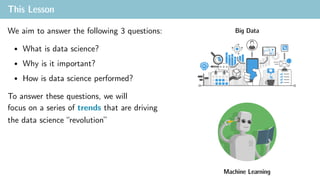
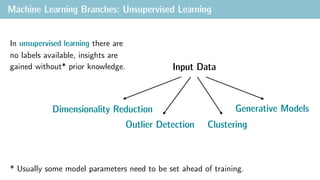
The document outlines a data science course focusing on key skills such as Python programming, data analysis, machine learning, and model evaluation. It emphasizes the importance of data science in addressing complex business problems and highlights the iterative and interdisciplinary nature of the field. Topics include an introduction to data science, big data, machine learning techniques, and practical applications, reinforced by a structured weekly syllabus and various example case studies.


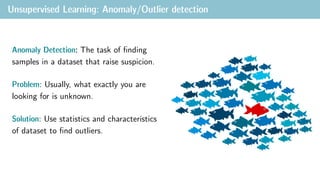
![Unsupervised Learning: Anomaly/Outlier detection
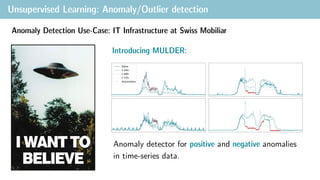
Figure: Topology of Swiss Mobiliar’s application network, where each blue node corresponds to a
component of an application. Communication between components is denoted by grey lines. The right
panel shows an illustrative time series from a single node exhibiting positive and negative anomalies.
integrate streaming business data within and outside company borders.
As part of our product development, we apply our expertise in event-processing
technologies to solve real-world problems for our customers. One such customer is
Swiss Mobiliar, whose employees rely on a very large network of applications to assist
their customers with insurance policies, quotes, etc. These applications are monitored,
where quantities such as workload and response time are recorded at frequent
intervals.
Key challenges:
bottlenecks
disruptions
> 20,000 correlated time series
> 2,000 events/s
univariate time series [2]. Surprise is defined as the
the actual value of a given metric. Calculating t
secondary, “surprise” time series. Examples of statio
Validation Procedure
Numenta Anomaly Benchmark (NAB)
The NAB [1] consists of over 50 time series with an
evaluation profiles to measure precision and r
Stationary Signal
Figure: Calculation of surprise, where the expected
value is obtained by linear extrapolation of the past
time-steps.
Anomaly detection via surprise percentiles
From the surprise time series, percentiles
(10th and 90th) are tracked over time with a
sliding window. With a 3σ test for outliers,
the percentile time series are probed for
anomalies. Tracking both the upper and
lower percentiles enables the reliable
detection of negative (dips), as well as
positive (spikes) anomalies.
Anomaly Detection Use-Case: IT Infrastructure at Swiss Mobiliar
The goal is to detect disruptions in
network before they affect user or
escalate.
This is an unsupervised task, since we
don’t know how a disruption looks like.
- 20’000 components communicating
- average latency and number of calls are logged
- ca. 2’000 events/second](https://image.slidesharecdn.com/lesson01intro-to-ds-and-ml-240712185528-5c4fab0b/85/Data-Science-lesson01_intro-to-ds-and-ml-pdf-41-320.jpg)