Download as PDF, PPTX

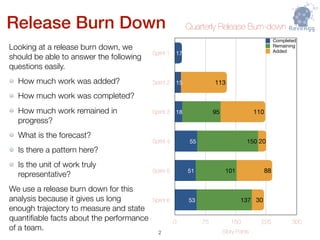


This document discusses how burn down charts can provide insights into team performance over time. It analyzes metrics like work completed, work remaining, and work added on a quarterly release burn down chart. These metrics can indicate things like whether the team's velocity is improving, if there is scope creep, and how many sprints are forecast to complete the remaining work. The document also outlines some key team performance indicators that can be measured, like velocity, debt, scope creep, and forecast, to help understand the team's progress and identify areas for improvement.


![Lect 1 Number systems and base conversions. [Autosaved].pptx](https://cdn.slidesharecdn.com/ss_thumbnails/lect1numbersystemsandbaseconversions-260111134109-67c2d865-thumbnail.jpg?width=640&height=640&fit=bounds)


