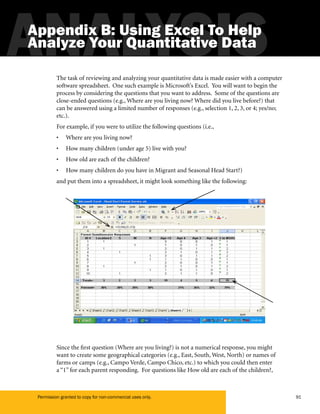
This document provides an introduction to data analysis for Migrant and Seasonal Head Start programs. It defines key terms like data, qualitative data, and quantitative data. Data refers to factual information that can be numbers, words, images, or other recorded representations. Qualitative data includes non-numerical information like words or images, while quantitative data involves numbers and statistics. The document emphasizes that both qualitative and quantitative data are important for Head Start programs to collect in order to fully understand their operations and make informed decisions. It aims to help programs conceptualize data analysis as an ongoing process and provide a framework for managing that process effectively.


![© AED/TAC-12 Spring 2006.
34
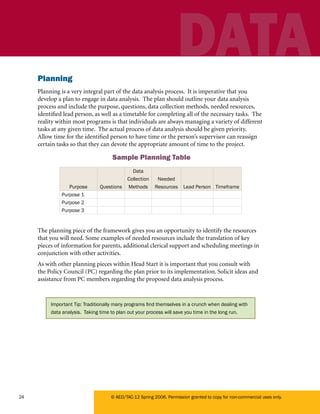
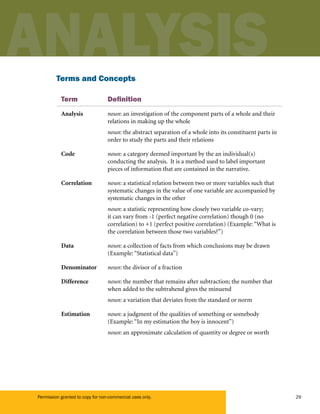
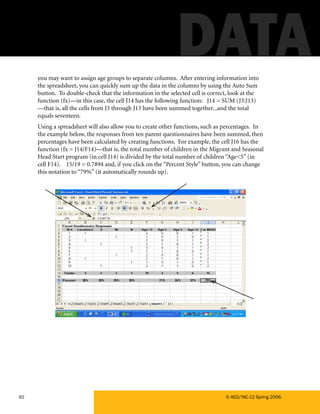
2. Median
Median = score in the middle; 50th percentile
Example #1:
Median scores = 64, 70, 80, 80, 90, 98, 100
If # scores = odd: Find the score in the middle
64, 70, 80, [80], 90, 98, 100
Median = 80
Example #2:
Median scores = 64, 70, 80, 80, 90, 98, 100, 100
If # scores = even: Average the 2 in the middle
64, 70, 80, [80, 90,] 98, 100, 100
80 + 90 = 170
170 ÷ 2 = 85
Median = 85
3. Mode
• Mode = largest number of scores
Example #1:
Example: scores = 64, 70, 80, 80, 90, 98, 100
Mode = 80
Example #2:
Example: scores = 64, 70, 80, 80, 90, 98, 100, 100
Modes = 80, 100
•
•
•
•](https://image.slidesharecdn.com/becomedataanalyst-240228061732-0320150c/85/DATA-ANALYST-COURSE-TUTORIAL-AND-SMALL-EXAMPLES-40-320.jpg)


![85
Permission granted to copy for non-commercial uses only.
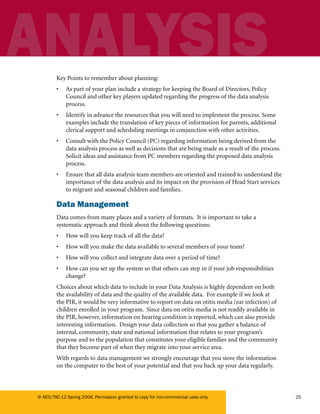
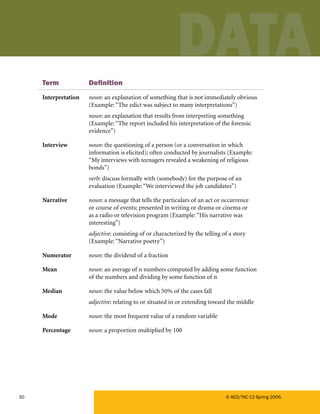
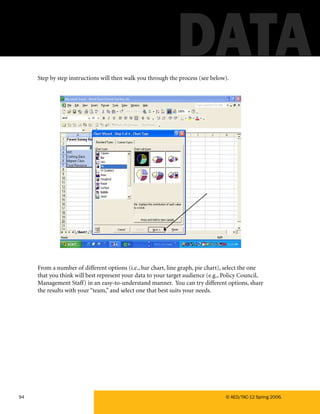
Excerpts: The Head Start Act, 1998
As Amended October 27, 1998
Quality Standards; Monitoring of Head Start Agencies and Programs
Sec. 641A [42 U.S.C. 9836A]
The Secretary shall establish by regulation standards, including minimum levels of overall
accomplishment, applicable to Head Start agencies, programs, and projects under this
subchapter, including—additional education performance standards to ensure that the
children participating in the program, at a minimum:
Develop phonemic, print, and numeracy awareness;
Understand and use language to communicate for various purposes;
Understand and use increasingly complex and varied vocabulary;
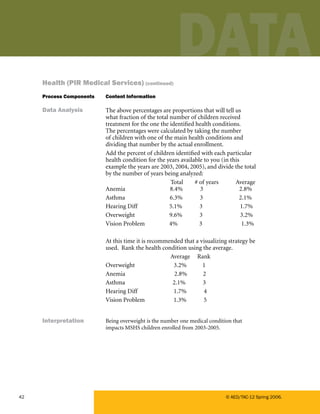
Develop and demonstrate an appreciation of books; and
In the case of non-English background children, progress toward an acquisition of the
English language.
•
•
•
•
•](https://image.slidesharecdn.com/becomedataanalyst-240228061732-0320150c/85/DATA-ANALYST-COURSE-TUTORIAL-AND-SMALL-EXAMPLES-91-320.jpg)


![Hacking-Uncovered-How-People-Get-Hacked-and-How-to-Stay-Safe[1].pptx](https://cdn.slidesharecdn.com/ss_thumbnails/hacking-uncovered-how-people-get-hacked-and-how-to-stay-safe1-260130170011-4883a9c7-thumbnail.jpg?width=640&height=640&fit=bounds)


