More Related Content
More from joseleorcasita (20)
Daily livestock report july 31 2012
- 1. Vol. 10, No. 147 July 31, 2012
Monday’s weekly Crop Progress report from USDA was
more of the same — deteriorating corn and soybean conditions PROFIT/HEAD & BRDG. HERD CHANGE
that are now rivaling the worst on record. As of Sunday, only 24% Profit Per Head Dec 1 Brdng Herd Change
$/Head
of the nation’s corn acres were in good or excellent condition. That 30 9.0%
compares with 62% last year and 26% last week. This week’s figure is 7/31/2012
also the second lowest on record — second only to 1988. On the oth- 20 Futures 6.0%
er end of the spectrum, 48% of corn acres were rated in poor or very
poor condition. That compares to only 14% last year and 45% last 10 3.0%
e
g
n
week. Corn maturity patterns continue to run well ahead of “normal” a
h
pace, pushed along by early planting and an abundance of heat units C
0 0.0% d
r
this summer. As of Sunday, 94% of the corn had silked. That com- e
H
pares to only 78% at this time last year and a 5-year average of 77% g
n
-10 -3.0% d
r
for this date. Perhaps more telling is that 13% of the corn crop (vs. 3% B
last year and 3% for the 5-year average) is already in the dent stage.
At that point there may be some kernel filling that will add to test -20 -6.0%
weights (ie. the weight of a bushel of corn or the density of the kernels)
but even that impact will be small. Dented corn is pretty much done -30 -9.0%
1991 1993 1995 1997 1999 2001 2003 2005 2007 2009 2011
and all indications are that we will continue to run ahead of the normal
pace on this measure as well.
TOTAL SOW PURCHASES, MPR DATA
The news was no better (and no less expected, we might
add) for soybeans where 37% of the crop was rated in poor or very Thous. Head
poor condition, up 2% from last week and far beyond the 12% that 60
was in these categories last year. Only 29% of soybean acres were Avg. '06-'010
55
rated as good or excellent last week, far below last year’s 60%. Soy- 2011
beans, too, are much farther along in their maturity, primarily due to 50 2012
being planted so early this year. 88% of the crop (vs. 72% last year
and a 5-year average of 75%) is blooming. Those same comparisons 45
for setting pods are 55% this year vs. 29% last year vs. 25% over the 40
past 5 years. Of additional concern in most areas will be the degree of
pod filling. Beans per pod is a major yield determinant. 35
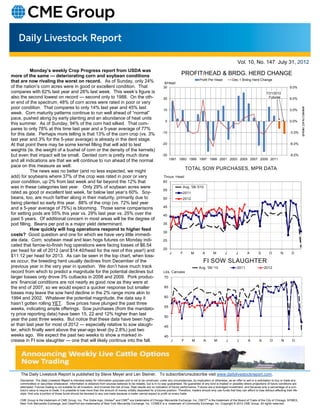
How quickly will hog operations respond to higher feed
30
costs? Good question and one for which we have very little immedi-
ate data. Corn, soybean meal and lean hogs futures on Monday indi- 25
cated that farrow-to-finish hog operations were facing losses of $6.54
20
per head for all of 2012 (and $14.40/head for the rest of this year!) and
J F M A M J J A S O N D
$11.12 per head for 2013. As can be seen in the top chart, when loss-
es occur, the breeding herd usually declines from December of the FI SOW SLAUGHTER
previous year in the very year in question. We don’t have much track Avg. '06-'10 2011 2012
record from which to predict a magnitude for the potential declines but Lbs. Carcass
larger losses only drove 3% cutbacks in 2008 and 2009. Pork produc- 70
ers’ financial conditions are not nearly as good now as they were at
the end of 2007, so we would expect a quicker response but smaller 65
losses may leave the sow herd decline in the 2% range more akin to
1994 and 2002. Whatever the potential magnitude, the data say it 60
hasn’t gotten rolling YET. Sow prices have plunged the past three
55
weeks, indicating ample offerings. Sow purchases (from the mandato-
ry price reporting data) have been 15, 22 and 12% higher than last
50
year the past three weeks. But notice that these data have been high-
er than last year for most of 2012 — especially relative to sow slaugh- 45
ter, which finally went above the year-ago level (by 2.8%) just two
weeks ago. We expect the past two weeks to show a marked in- 40
crease in FI sow slaughter — one that will likely continue into the fall. J F M A M J J A S O N D
The Daily Livestock Report is published by Steve Meyer and Len Steiner. To subscribe/unsubscribe visit www.dailylivestockreport.com.
Disclaimer: The Daily Livestock Report is intended solely for information purposes and is not to be construed, under any circumstances, by implication or otherwise, as an offer to sell or a solicitation to buy or trade any
commodities or securities whatsoever. Information is obtained from sources believed to be reliable, but is in no way guaranteed. No guarantee of any kind is implied or possible where projections of future conditions are
attempted. Futures trading is not suitable for all investors, and involves the risk of loss. Past results are no indication of future performance. Futures are a leveraged investment, and because only a percentage of a con-
tract’s value is require to trade, it is possible to lose more than the amount of money initially deposited for a futures position. Therefore, traders should only use funds that they can afford to lose without affecting their life-
style. And only a portion of those funds should be devoted to any one trade because a trader cannot expect to profit on every trade.
CME Group is the trademark of CME Group, Inc. The Globe logo, Globex® and CME® are trademarks of Chicago Mercantile Exchange, Inc. CBOT® is the trademark of the Board of Trade of the City of Chicago. NYMEX,
New York Mercantile Exchange, and ClearPort are trademarks of New York Mercantile Exchange. Inc. COMEX is a trademark of Commodity Exchange, Inc. Copyright © 2012 CME Group. All rights reserved.