The document provides a daily analysis report from TP Global FX. It includes key economic data and events from Asia and upcoming data from Europe. For various currency pairs (AUD/USD, EUR/USD, GBP/USD, USD/CAD, USD/JPY, XAU/USD), it provides technical analysis summaries in the H1 time frame, including trends, moving averages, RSI levels, Fibonacci pivot points, commentary on current price levels, and potential buy and sell trade ideas.


![BUY SELL
R
E
P
O
R
T
F
R
O
M
:
T
P
G
LO
B
A
L
F
X
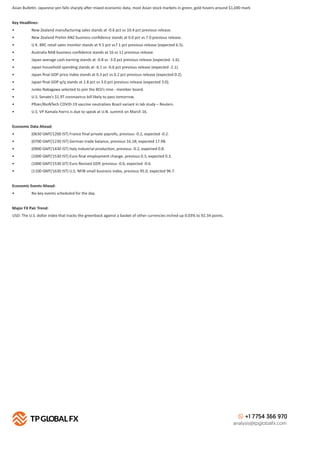
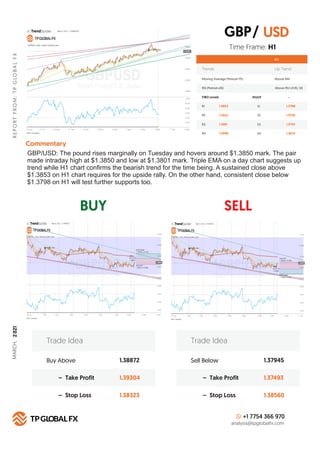
Technical Summary
Trends Down Trend
Moving Average (Period=75) Below MA
H 1
RSI (Period=26) Below RSI LEVEL 50
FIBO Levels PIVOT
R1 S1
1702
R2 S2
1708
R3 S3
1715
R4
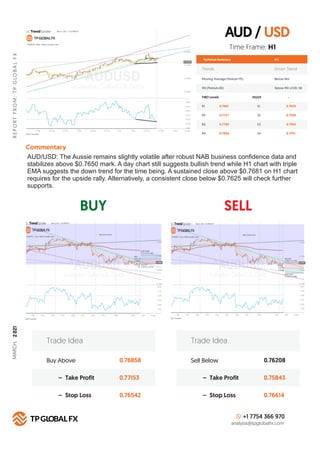
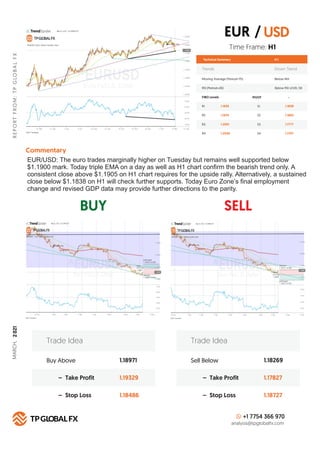
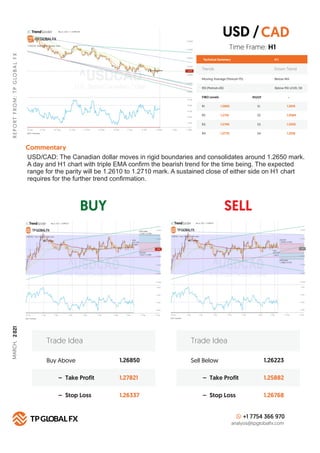
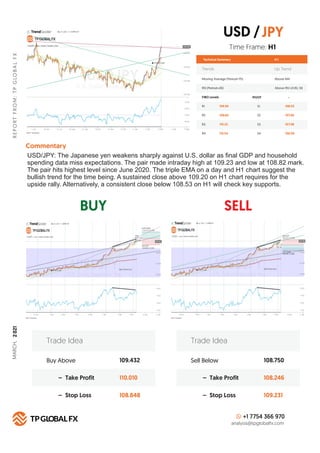
Commentary
S4
1722
Buy Above 1697.43
1707.80
1684.69
– Take Profit
– Stop Loss
Trade Idea
Sell Below 1681.46
1671.50
1691.42
– Take Profit
– Stop Loss
Trade Idea
+1 7754 366 970
analysis@tpglobalfx.com
-
Time Frame: H1
XAU/USD (GOLD): The gold recovers slightly from previous losses and hovers around immediate
resistance at $1,691 mark. Today pair made intraday high at $1,691 and low at $1,680 mark. A
sustained close above $1,698 on H1 chart requires for the upside rally. Alternatively, reversal from
here will drag the parity back below $1,680 mark. Today’s U.S. session is empty as no key
fundamentals are scheduled to release. As observed earlier, market might get high volatile during
the U.S. session in the absence of key fundamental.
XAU [GOLD]
USD
/
1677
1670
1662
1657
MARCH,
2
021](https://image.slidesharecdn.com/daily-analysis-report-march-09-2021-210309060341/85/Daily-Analysis-Report-March-09-2021-8-320.jpg)