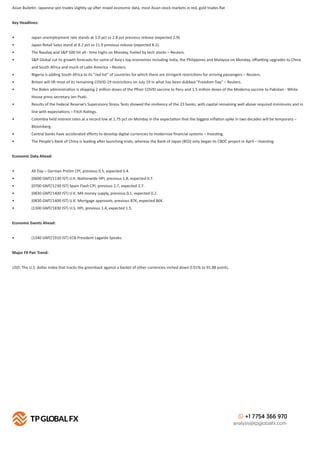
The document provides a daily analysis report from TP Global FX. It includes headlines on economic data from Japan, stock market performance, and COVID vaccine shipments. The analysis also summarizes technical indicators and provides trading recommendations for several currency pairs, including buying above and selling below certain price levels. Economic data scheduled for release throughout the day is listed, and major currency pairs are commented on from a technical analysis perspective in the report.

![BUY SELL
R
E
P
O
R
T
F
R
O
M
:
T
P
G
LO
B
A
L
F
X
Technical Summary
Trends Down Trend
Moving Average (Period=75) Below MA
H 1
RSI (Period=26) Below RSI LEVEL 50
FIBO Levels PIVOT
R1 S1
1786
R2 S2
1792
R3 S3
1798
R4
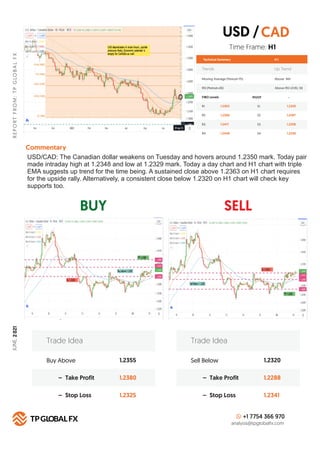
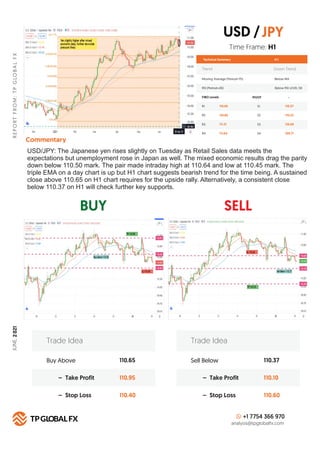
Commentary
S4
1805
Buy Above 1780
1786
1773
– Take Profit
– Stop Loss
Trade Idea
Sell Below 1770
1764
1778
– Take Profit
– Stop Loss
Trade Idea
+1 7754 366 970
analysis@tpglobalfx.com
-
Time Frame: H1
XAU/USD (GOLD): Gold continues to trade in stiff boundaries and stabilizes above $1,770 mark.
Today pair made intraday high at $1,778 and low $1,774 mark. A day chart and H1 chart with
triple EMA suggests bearish trend for the time being. A sustained close above $1,786 on H1 chart
requires for the upside rally. Alternatively, a consistent close below $1,770 will check further
supports.
XAU [GOLD]
USD
/
1770
1764
1758
1752
JUNE,
2
021](https://image.slidesharecdn.com/daily-analysis-report-june-29-2021-210629041559/85/DAILY-ANALYSIS-REPORT-JUNE-29-2021-8-320.jpg)