The document provides a daily analysis report from TP Global FX. It includes key Asian market headlines, upcoming economic data releases, commentary on major currency pairs, and technical analysis on AUD/USD, EUR/USD, GBP/USD, USD/CAD, USD/JPY, and XAU/USD. The report finds the Japanese yen weakened after comments from BOJ governor Kuroda, and Asian stock markets declined while gold stabilized below $1,700. Technical analysis provides support and resistance levels and trade ideas for each currency pair based on daily and hourly charts.


![BUY SELL
R
E
P
O
R
T
F
R
O
M
:
T
P
G
LO
B
A
L
F
X
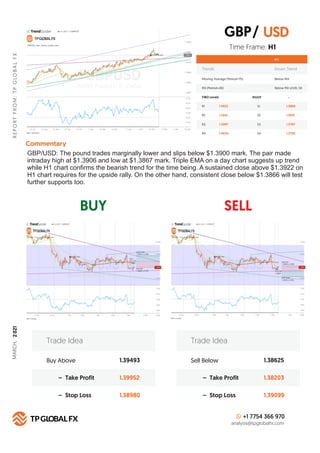
Technical Summary
Trends Down Trend
Moving Average (Period=75) Below MA
H 1
RSI (Period=26) Below RSI LEVEL 50
FIBO Levels PIVOT
R1 S1
1702
R2 S2
1708
R3 S3
1712
R4
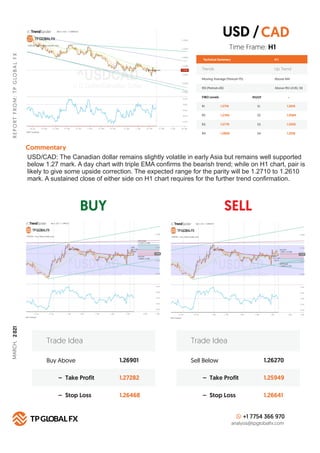
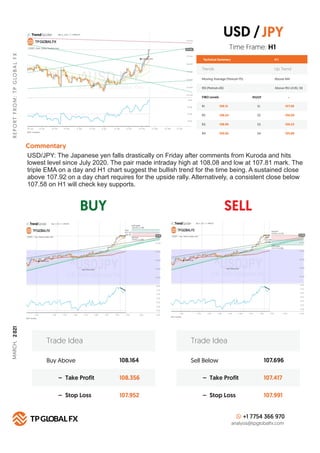
Commentary
S4
1722
Buy Above 1702.91
1711.98
1692.68
– Take Profit
– Stop Loss
Trade Idea
Sell Below 1686.08
1677.49
1696.38
– Take Profit
– Stop Loss
Trade Idea
+1 7754 366 970
analysis@tpglobalfx.com
-
Time Frame: H1
XAU/USD (GOLD): The gold weakens noticeably in previous session on robust U.S. factory
orders data. Today pair made intraday high at $1,698 and low at $1,687 mark. The key event for
the day will be U.S. NFP job results. The outcome will provide further direction of it. A day as well
as H1 chart still confirms the bearish trend for the time being. The expected range for the parity
will be $1,712 to $1,645 mark. A sustained close of either side on H1 chart requires to confirm
further directions of the parity.
XAU [GOLD]
USD
/
1687
1677
1661
1645
MARCH,
2
021](https://image.slidesharecdn.com/daily-analysis-report-march-05-2021-210305053648/85/Daily-Analysis-Report-March-05-2021-8-320.jpg)