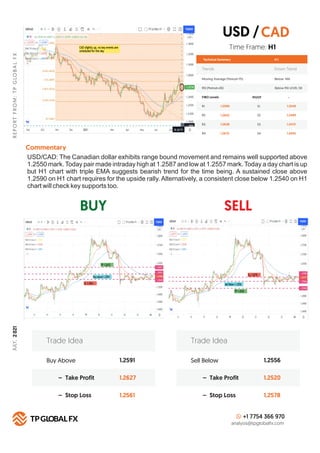
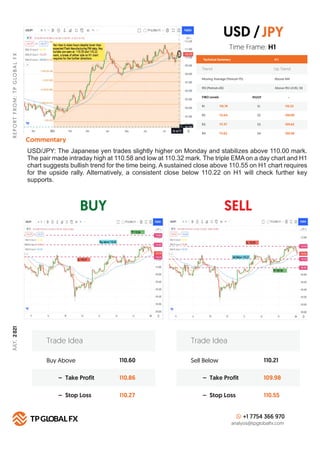
- The document provides a daily analysis report from TP Global FX on July 26, 2021. It includes analysis of major currency pairs such as AUD/USD, EUR/USD, GBP/USD, USD/CAD, USD/JPY, and XAU/USD. Technical indicators like moving averages, RSI levels, and Fibonacci levels are examined on H1 timeframes to identify potential buy and sell trade ideas. Upcoming economic data releases from Germany, the Eurozone, and the US are also highlighted.

![BUY SELL
R
E
P
O
R
T
F
R
O
M
:
T
P
G
LO
B
A
L
F
X
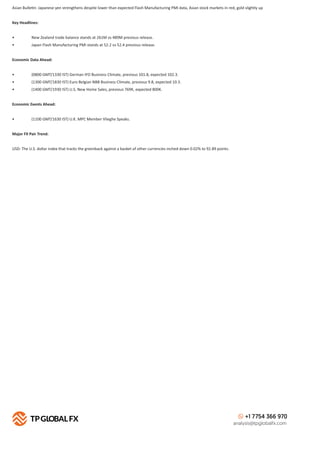
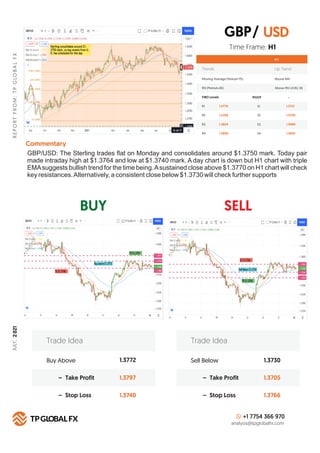
Technical Summary
Trends Down Trend
Moving Average (Period=75) Below MA
H 1
RSI (Period=26) Below RSI LEVEL 50
FIBO Levels PIVOT
R1 S1
1809
R2 S2
1814
R3 S3
1819
R4
Commentary
S4
1824
Buy Above 1809
1814
1803
– Take Profit
– Stop Loss
Trade Idea
Sell Below 1798
1792
1807
– Take Profit
– Stop Loss
Trade Idea
+1 7754 366 970
analysis@tpglobalfx.com
-
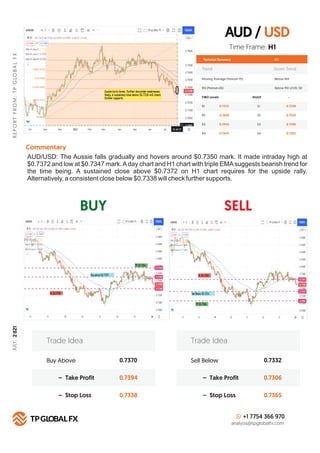
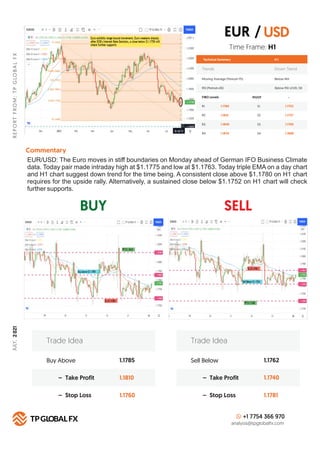
Time Frame: H1
XAU/USD (GOLD): Gold starts a new week on a positive note and stabilizes above $1,800 mark.
Today pair made intraday high at $1,807 and low $1,798 mark. A day chart and H1 chart with triple
EMA suggests bearish trend for the time being. A sustained close above $1,809 on H1 chart requires
for the upside rally.Alternatively, a consistent close below $1,799 will check further supports.
XAU [GOLD]
USD
/
1791
1786
1781
1776
JULY,
2
021](https://image.slidesharecdn.com/daily-analysis-report-july-26-2021-210726051353/85/DAILY-ANALYSIS-REPORT-JULY-26-2021-8-320.jpg)