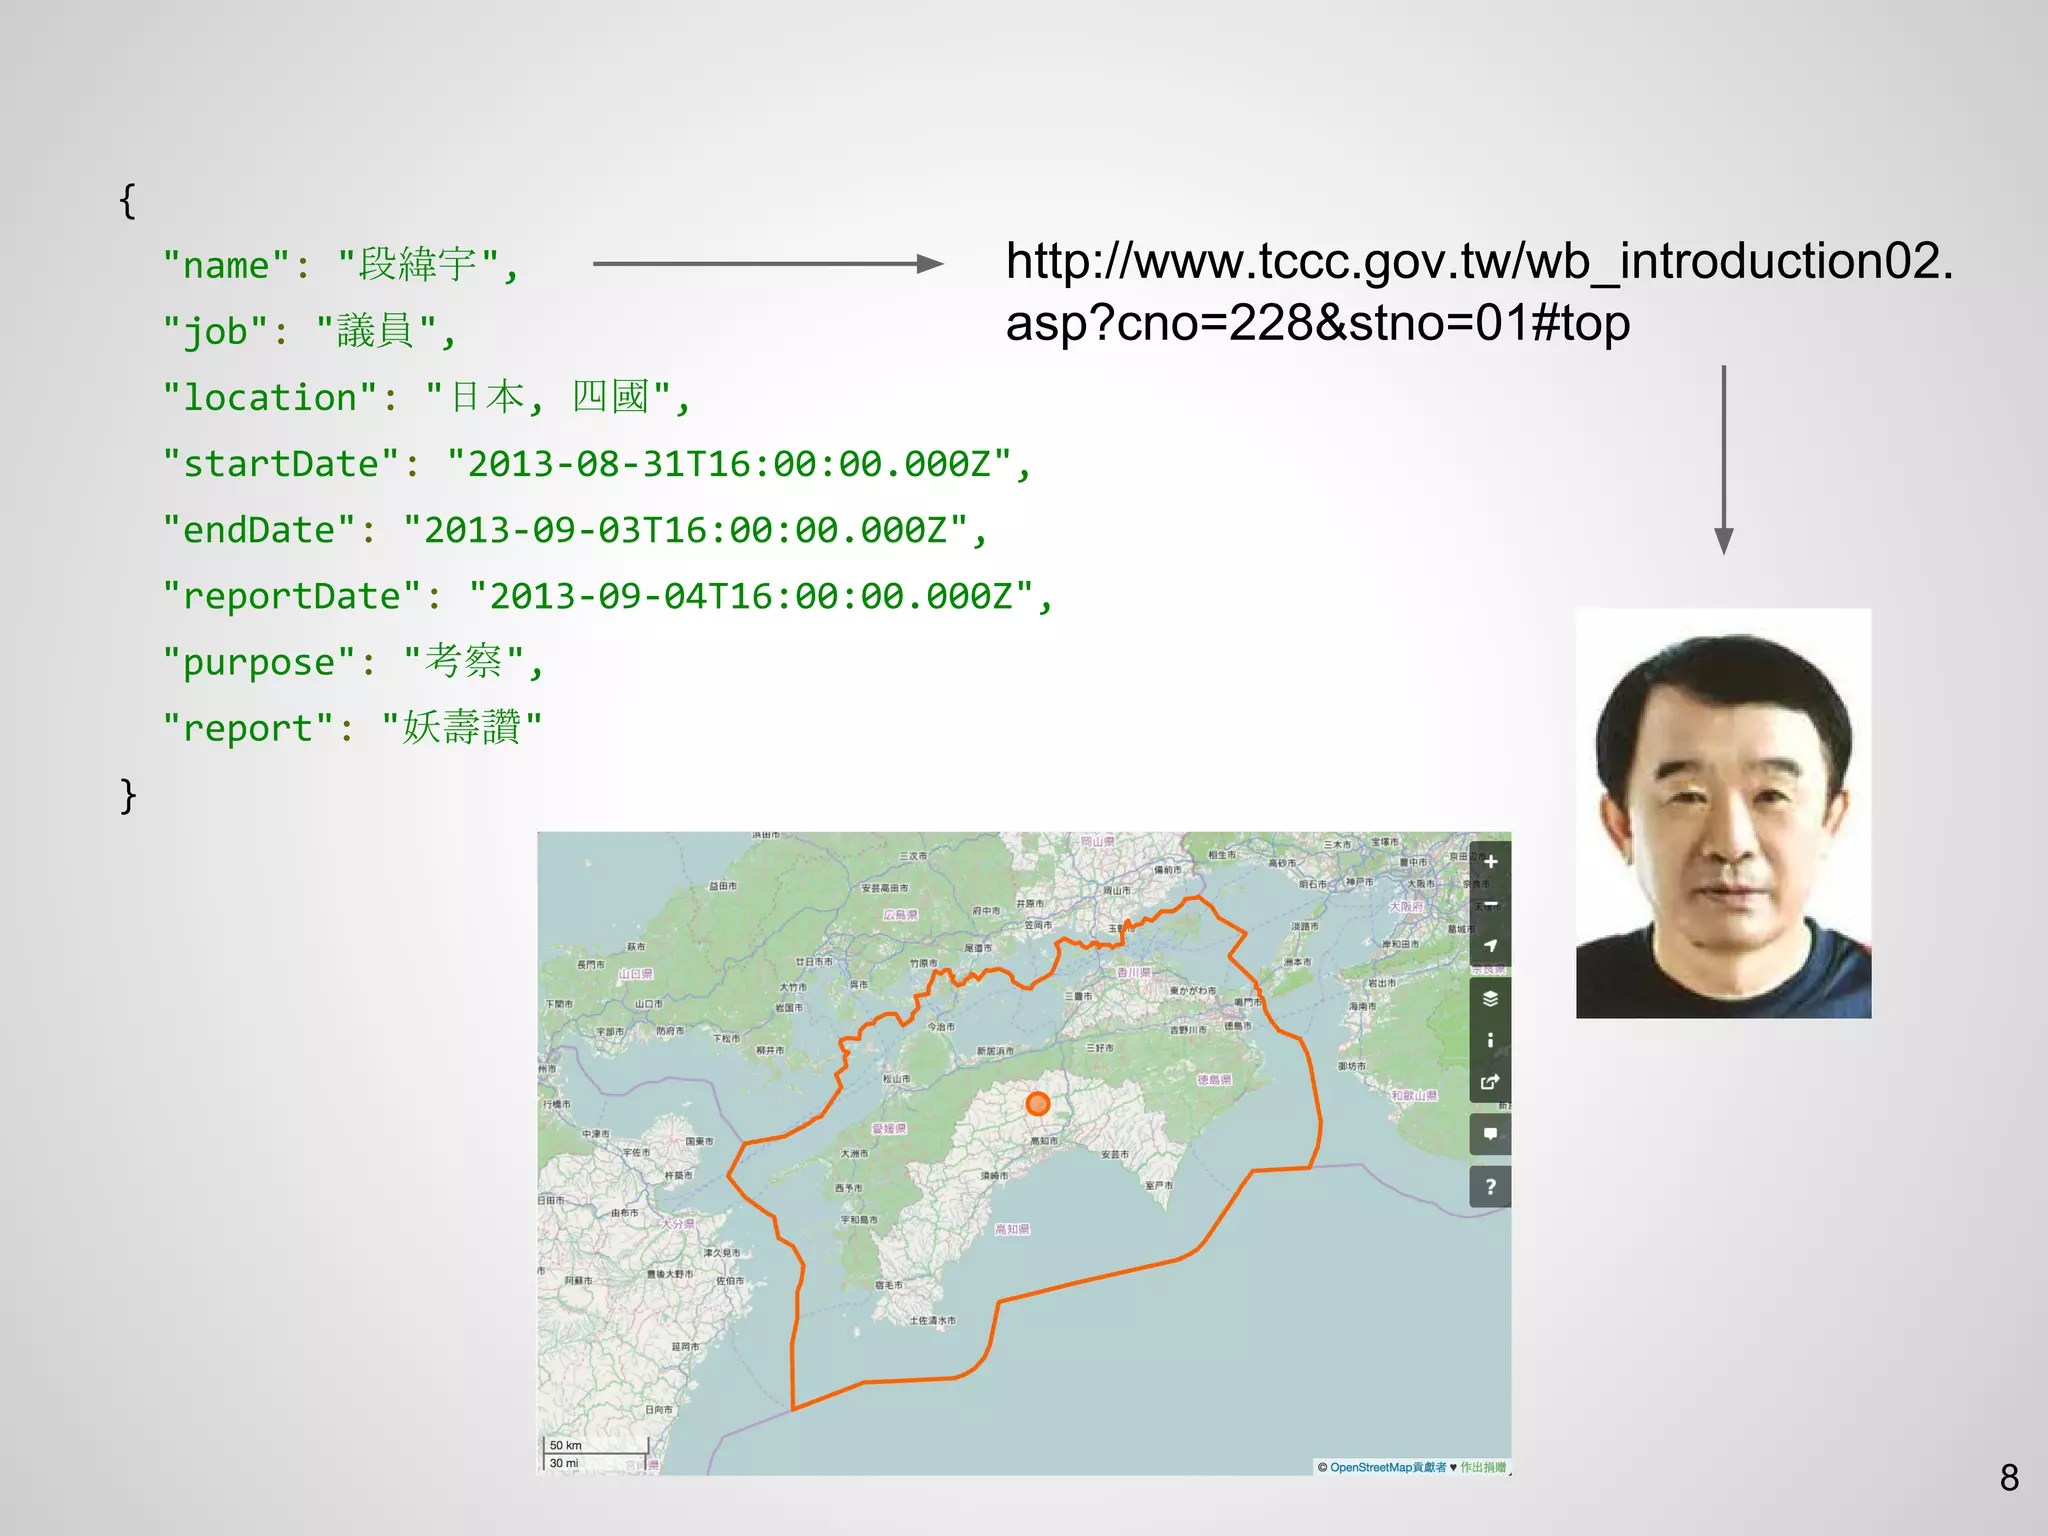
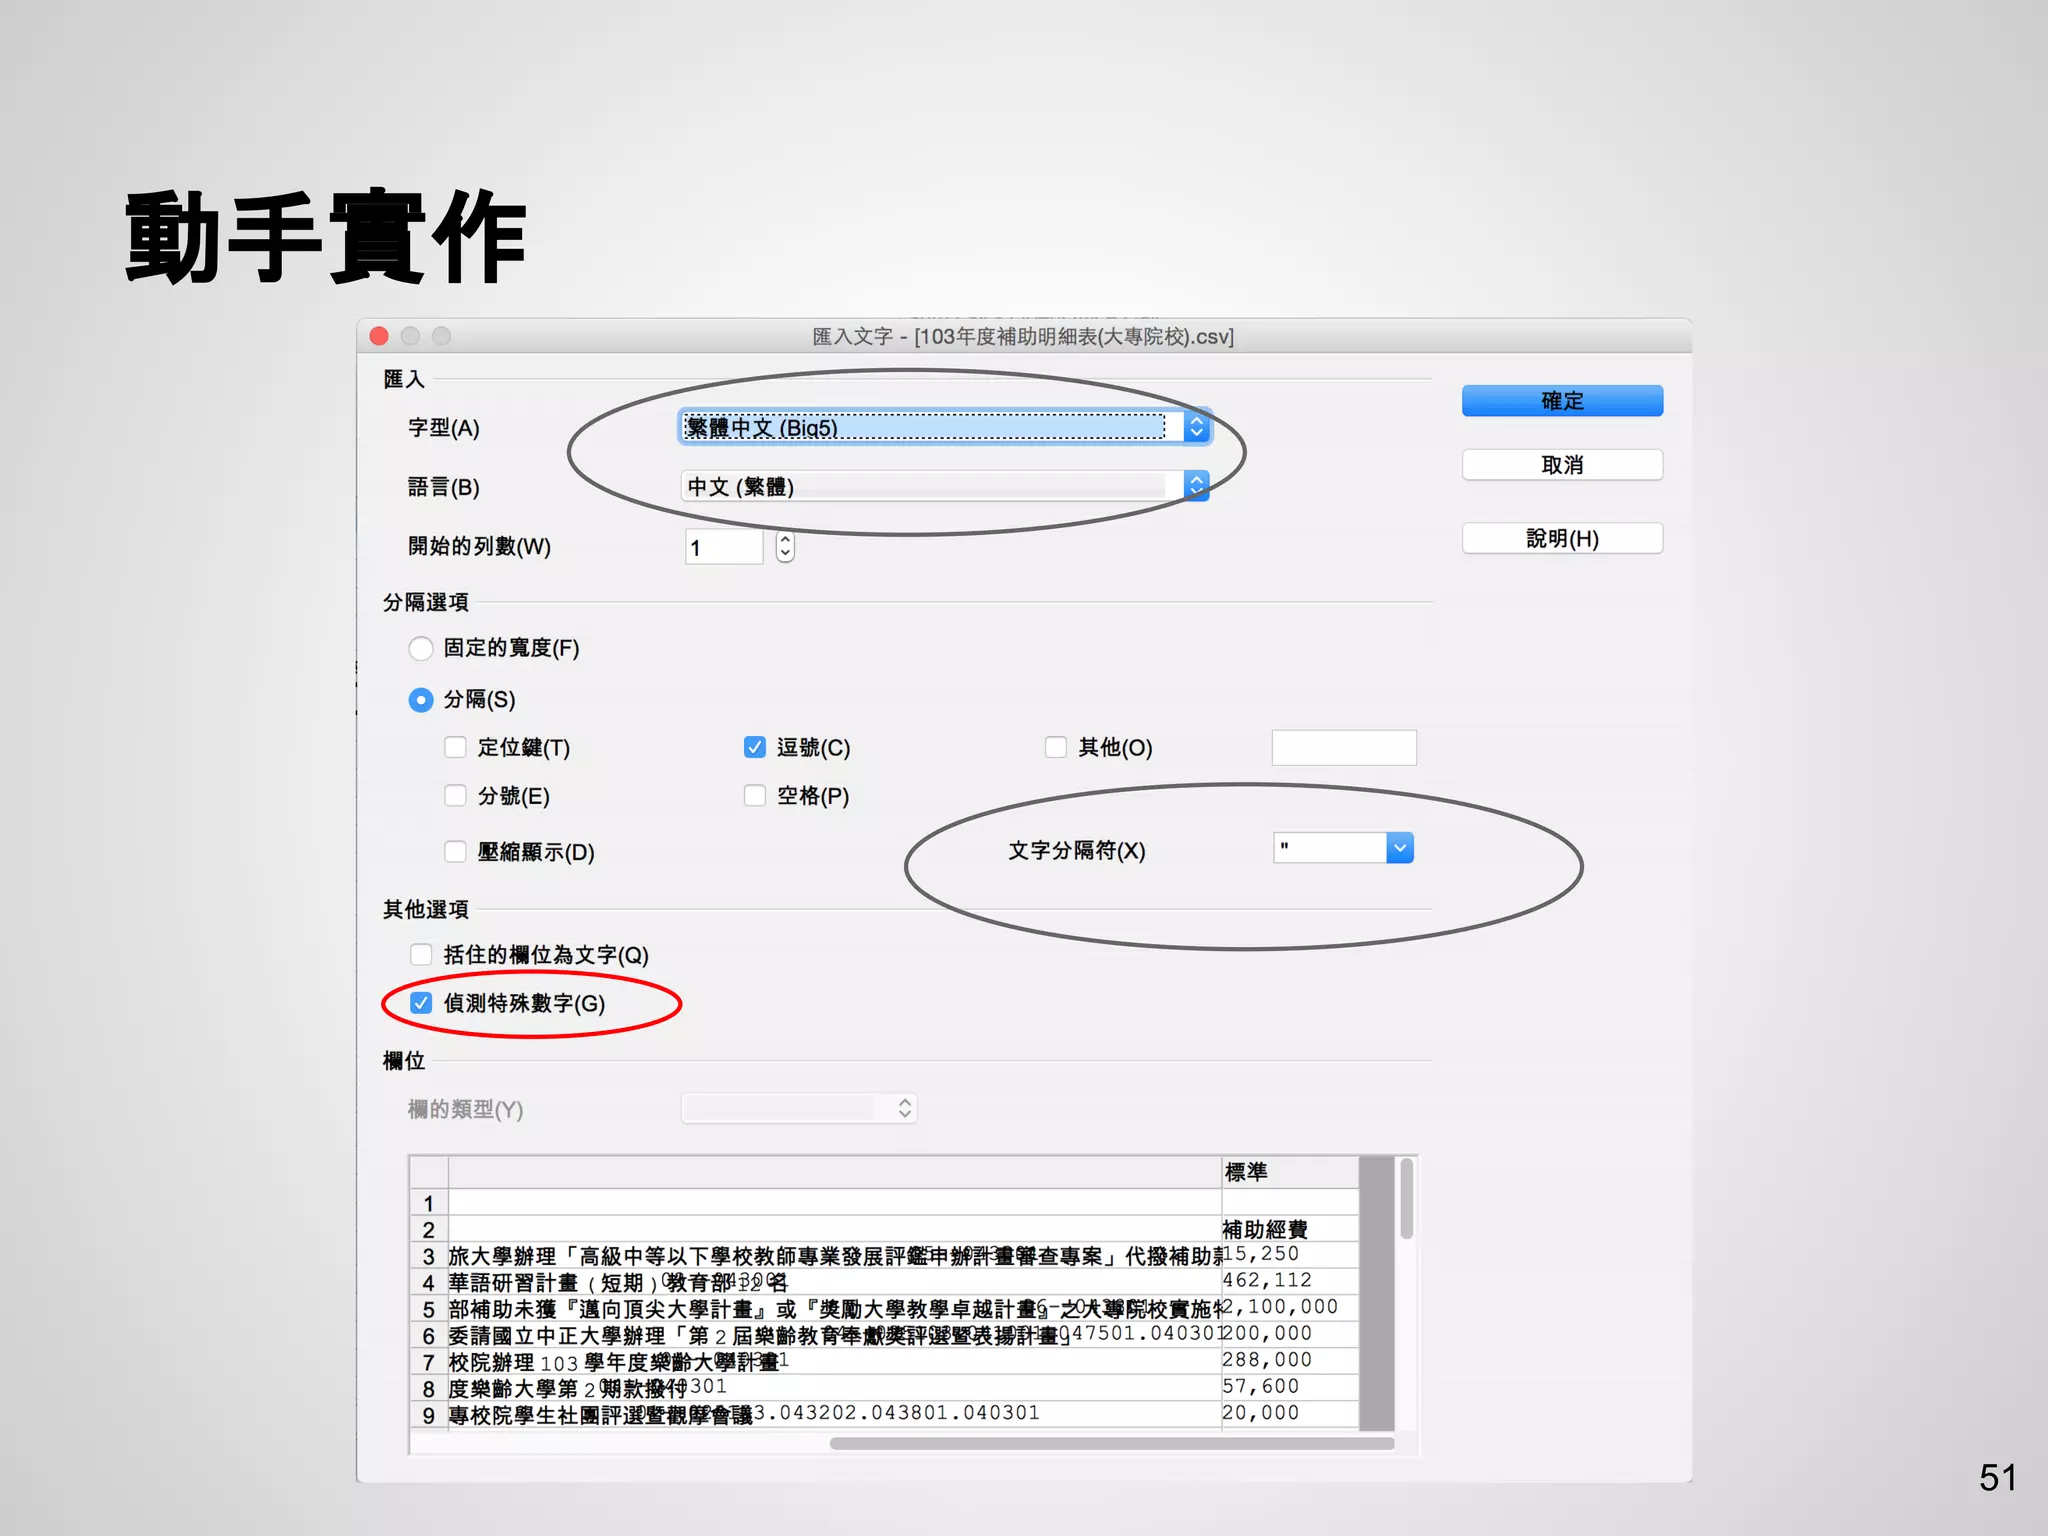
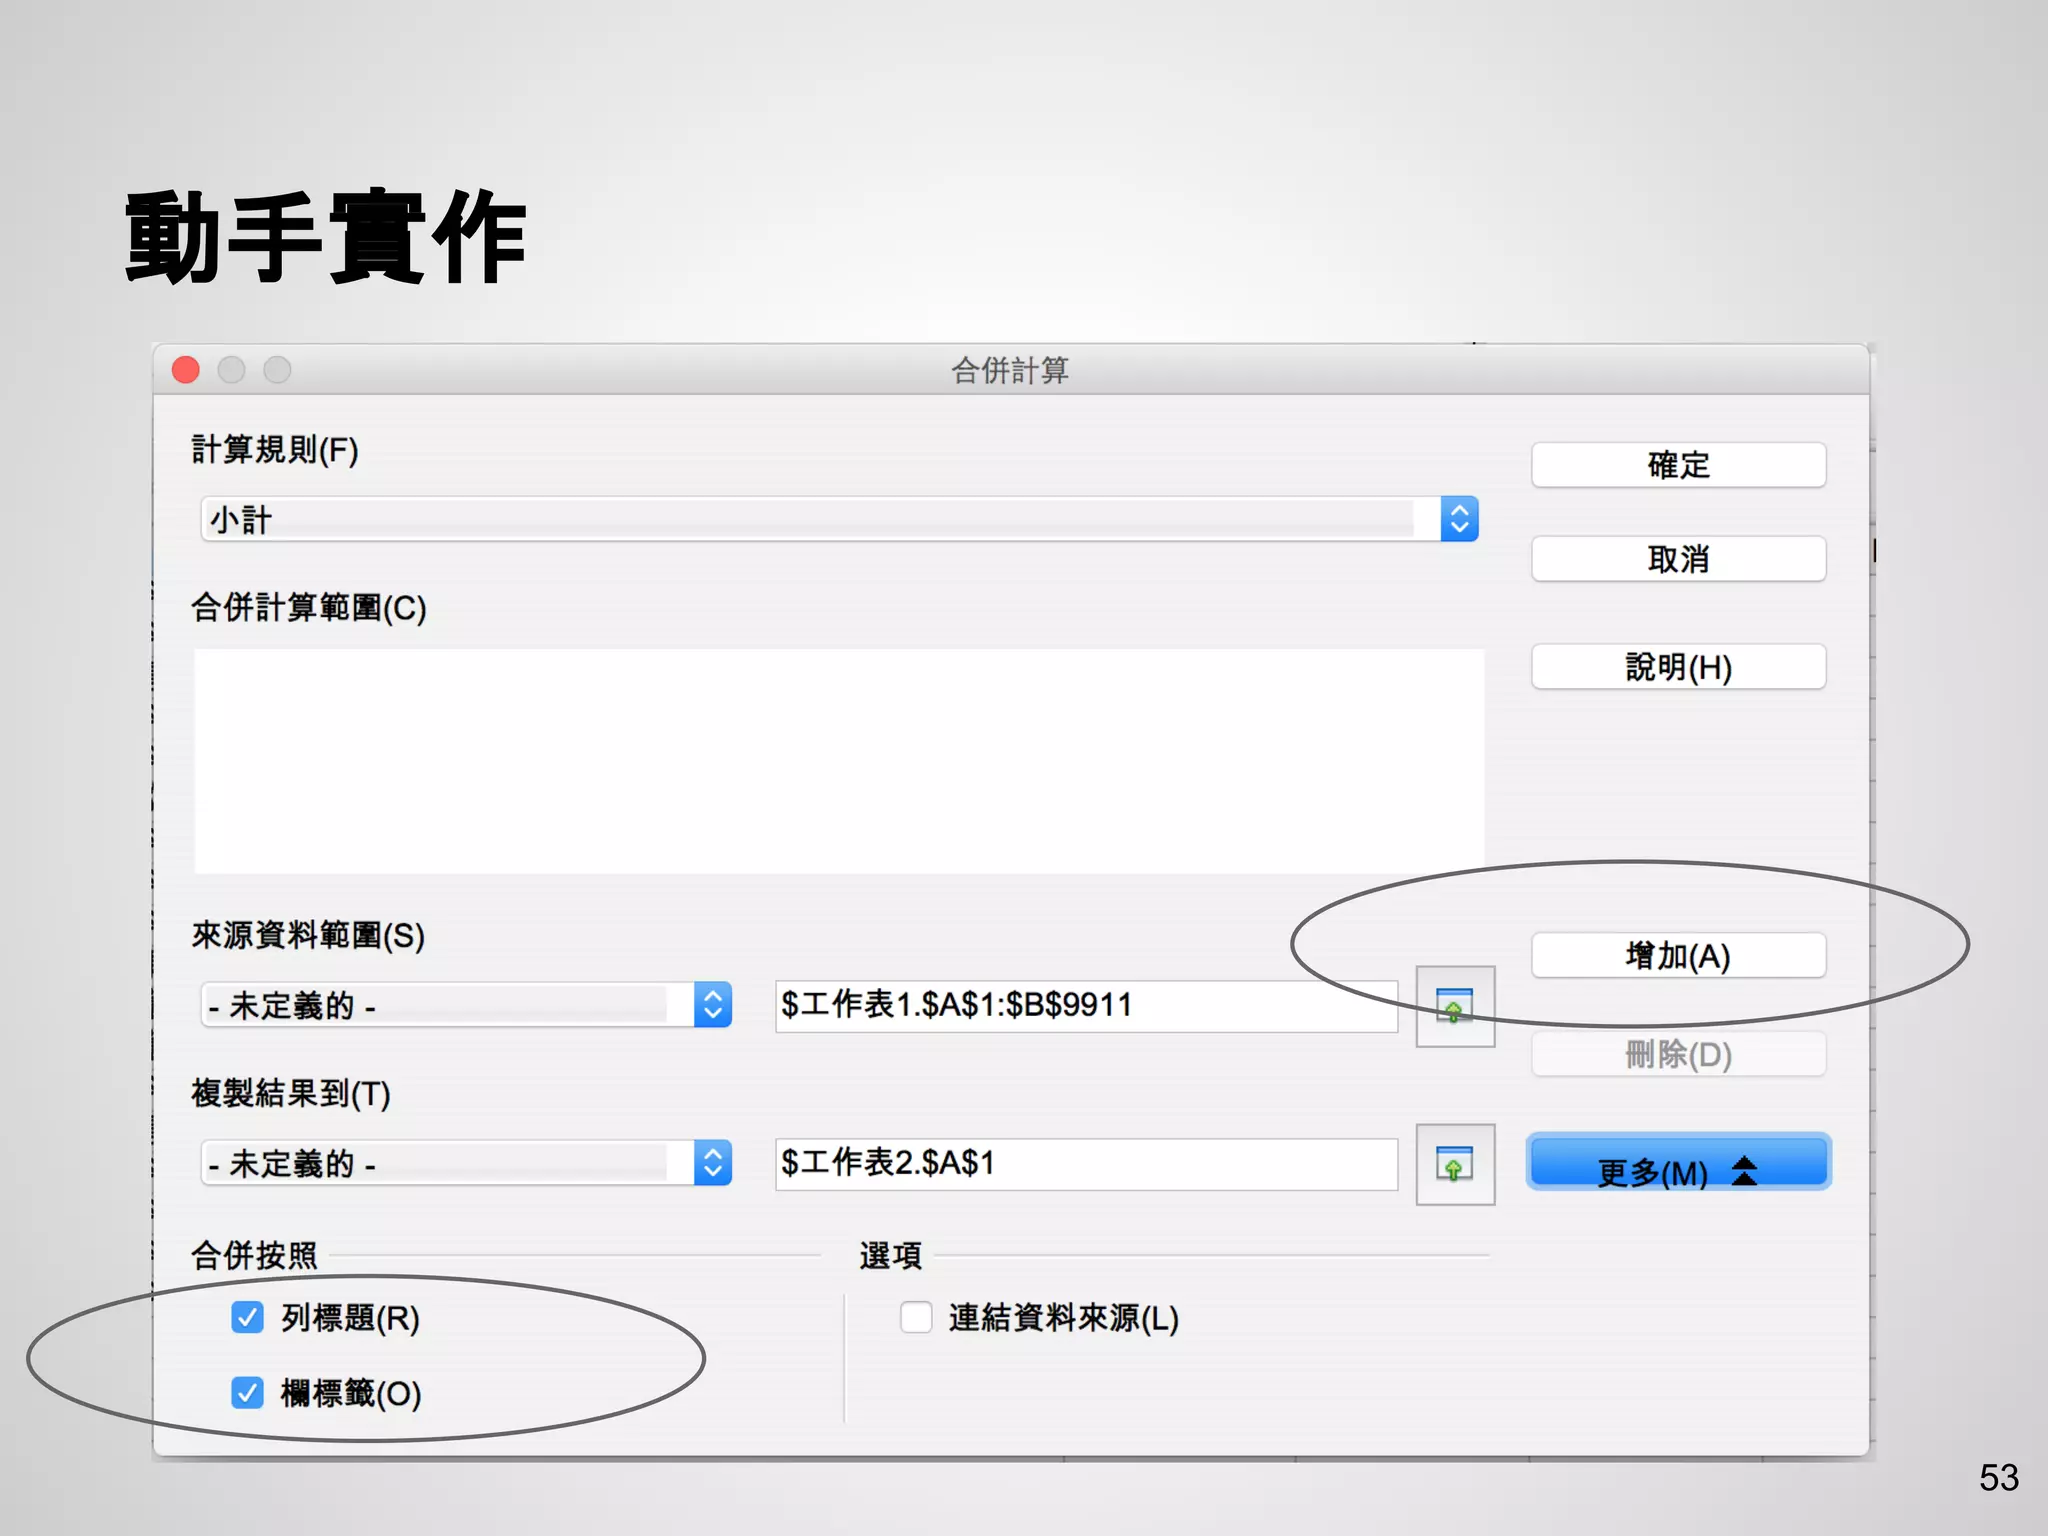
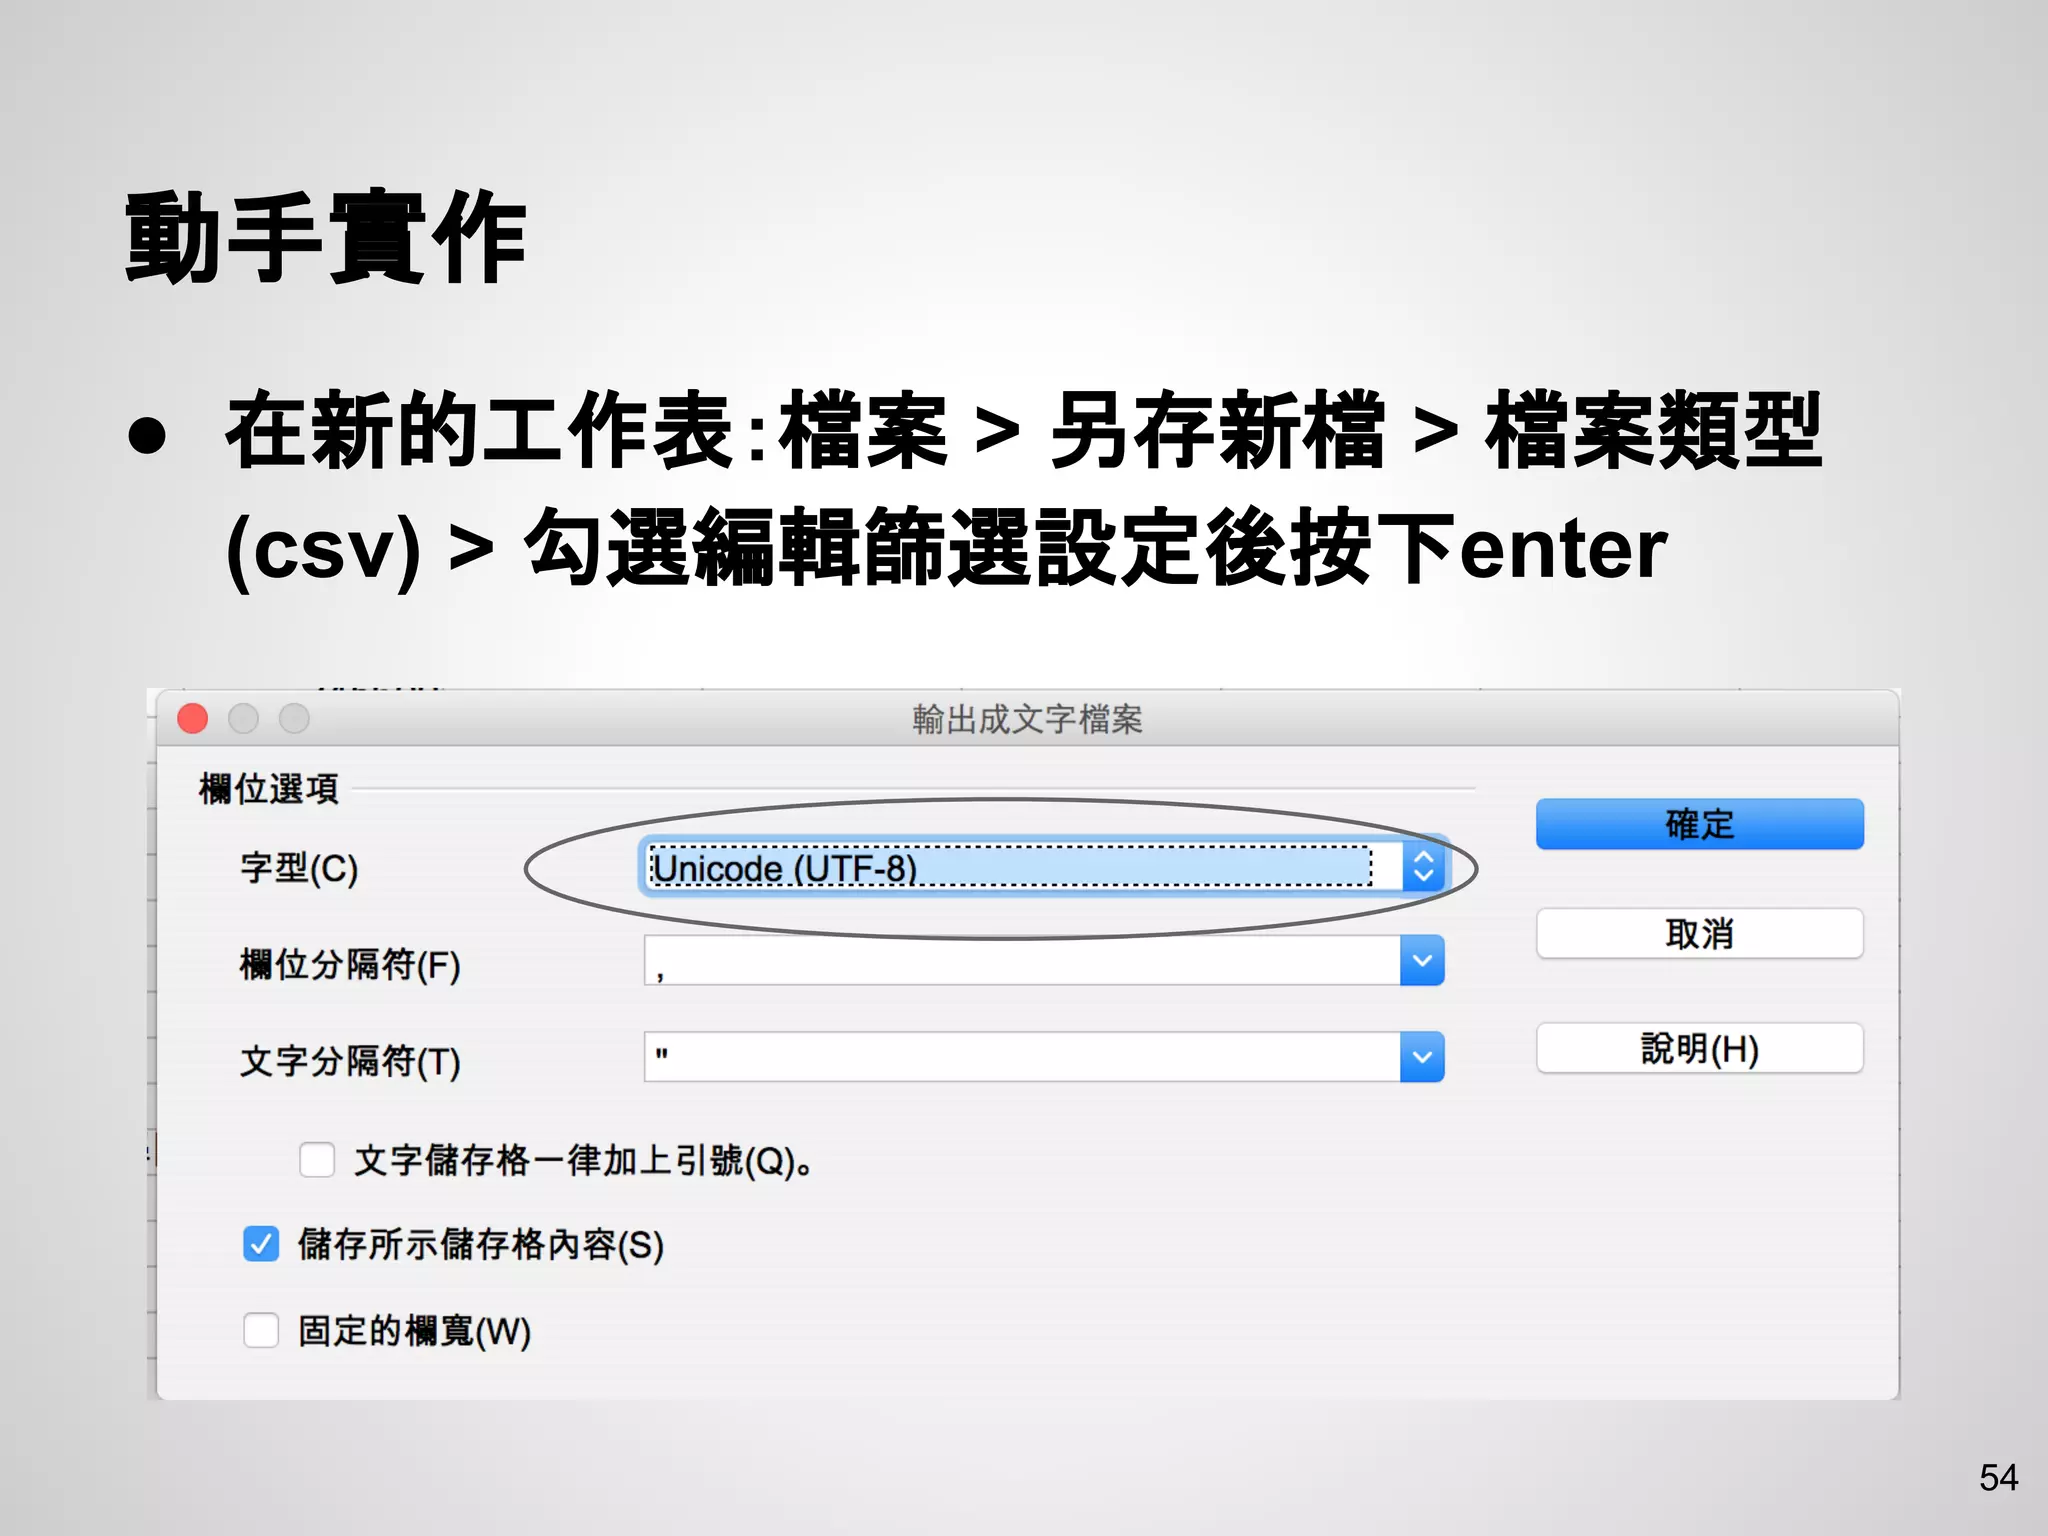
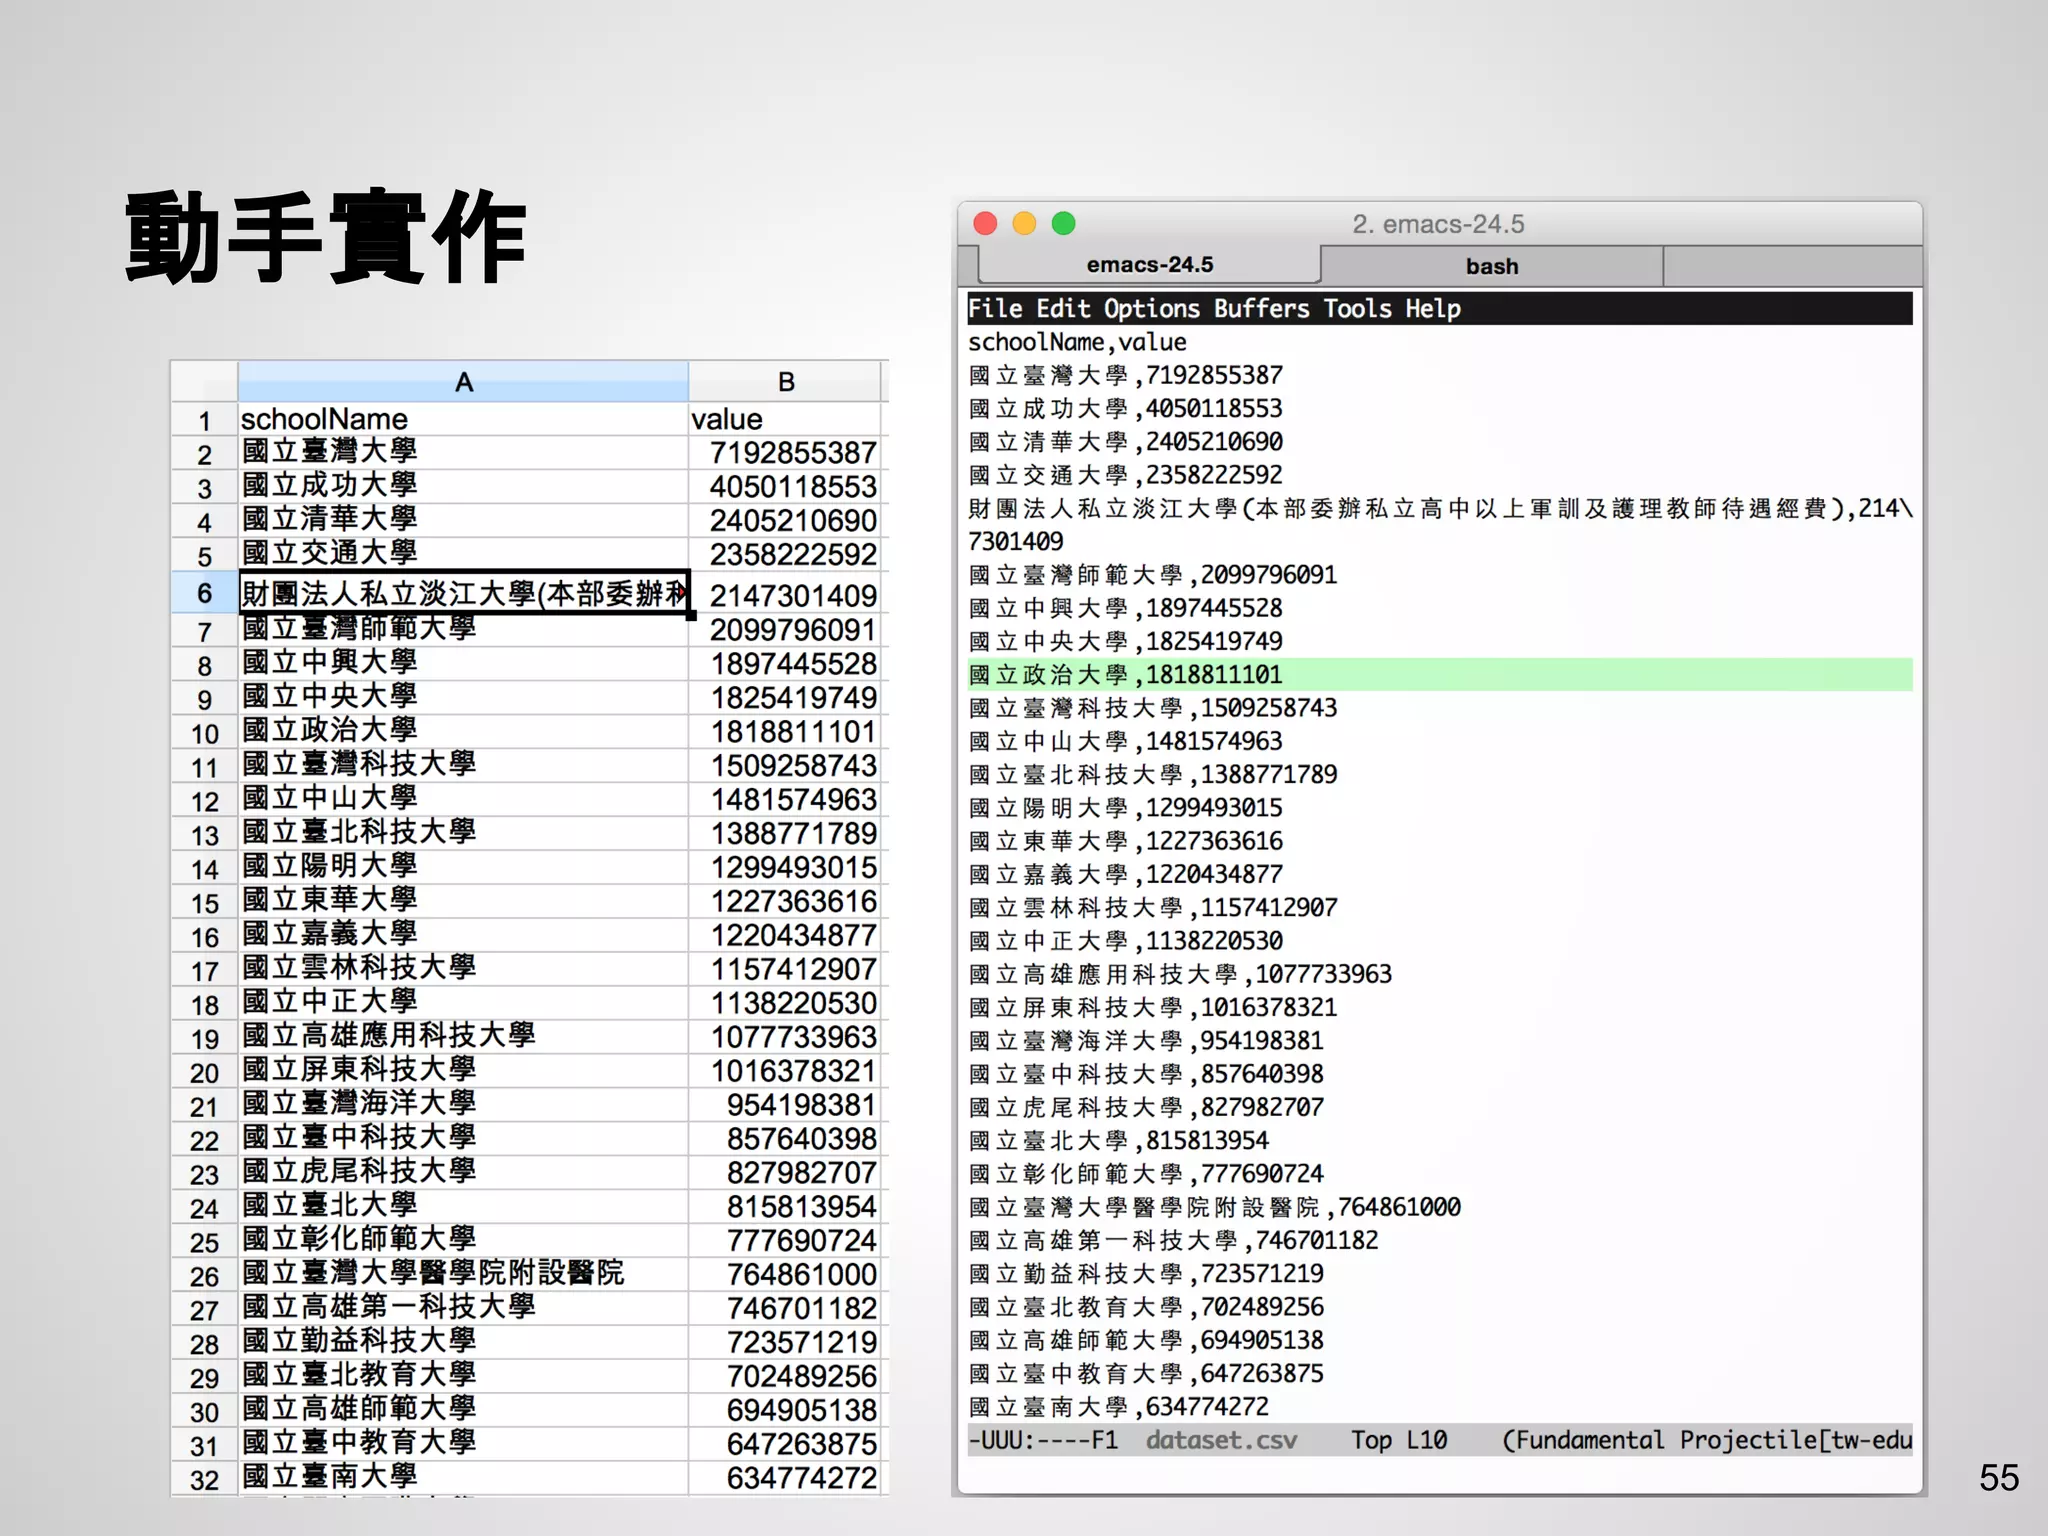
48
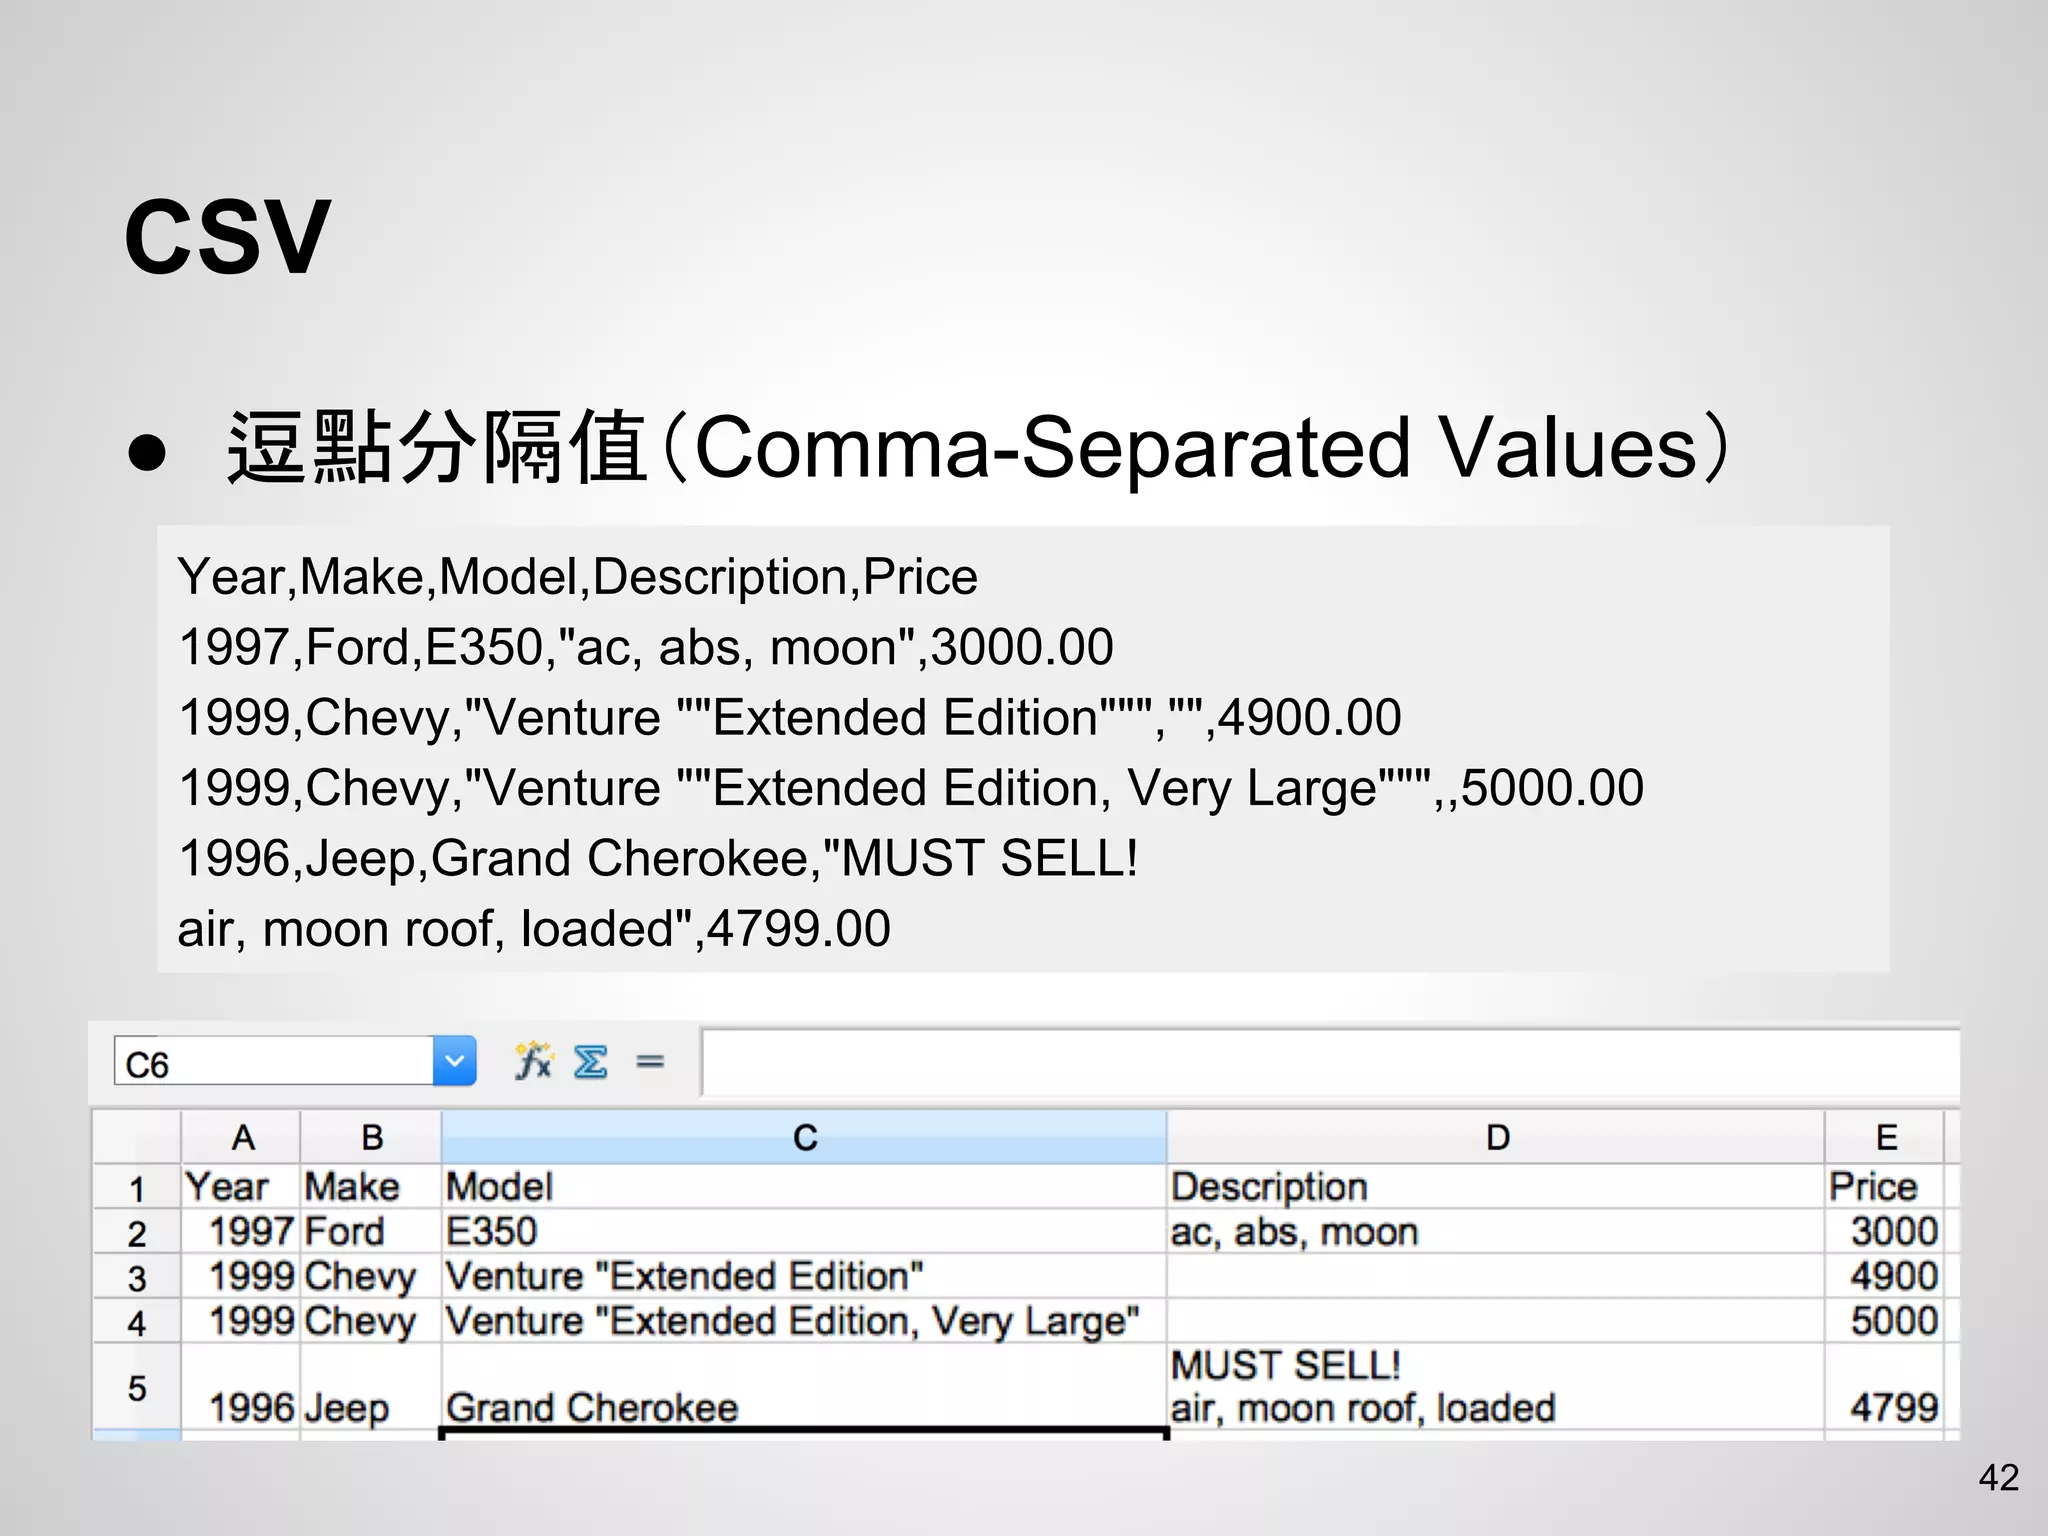
換行符
● 用來辨認換新一行的特殊符號
● Windows:rn
● UNIX: n
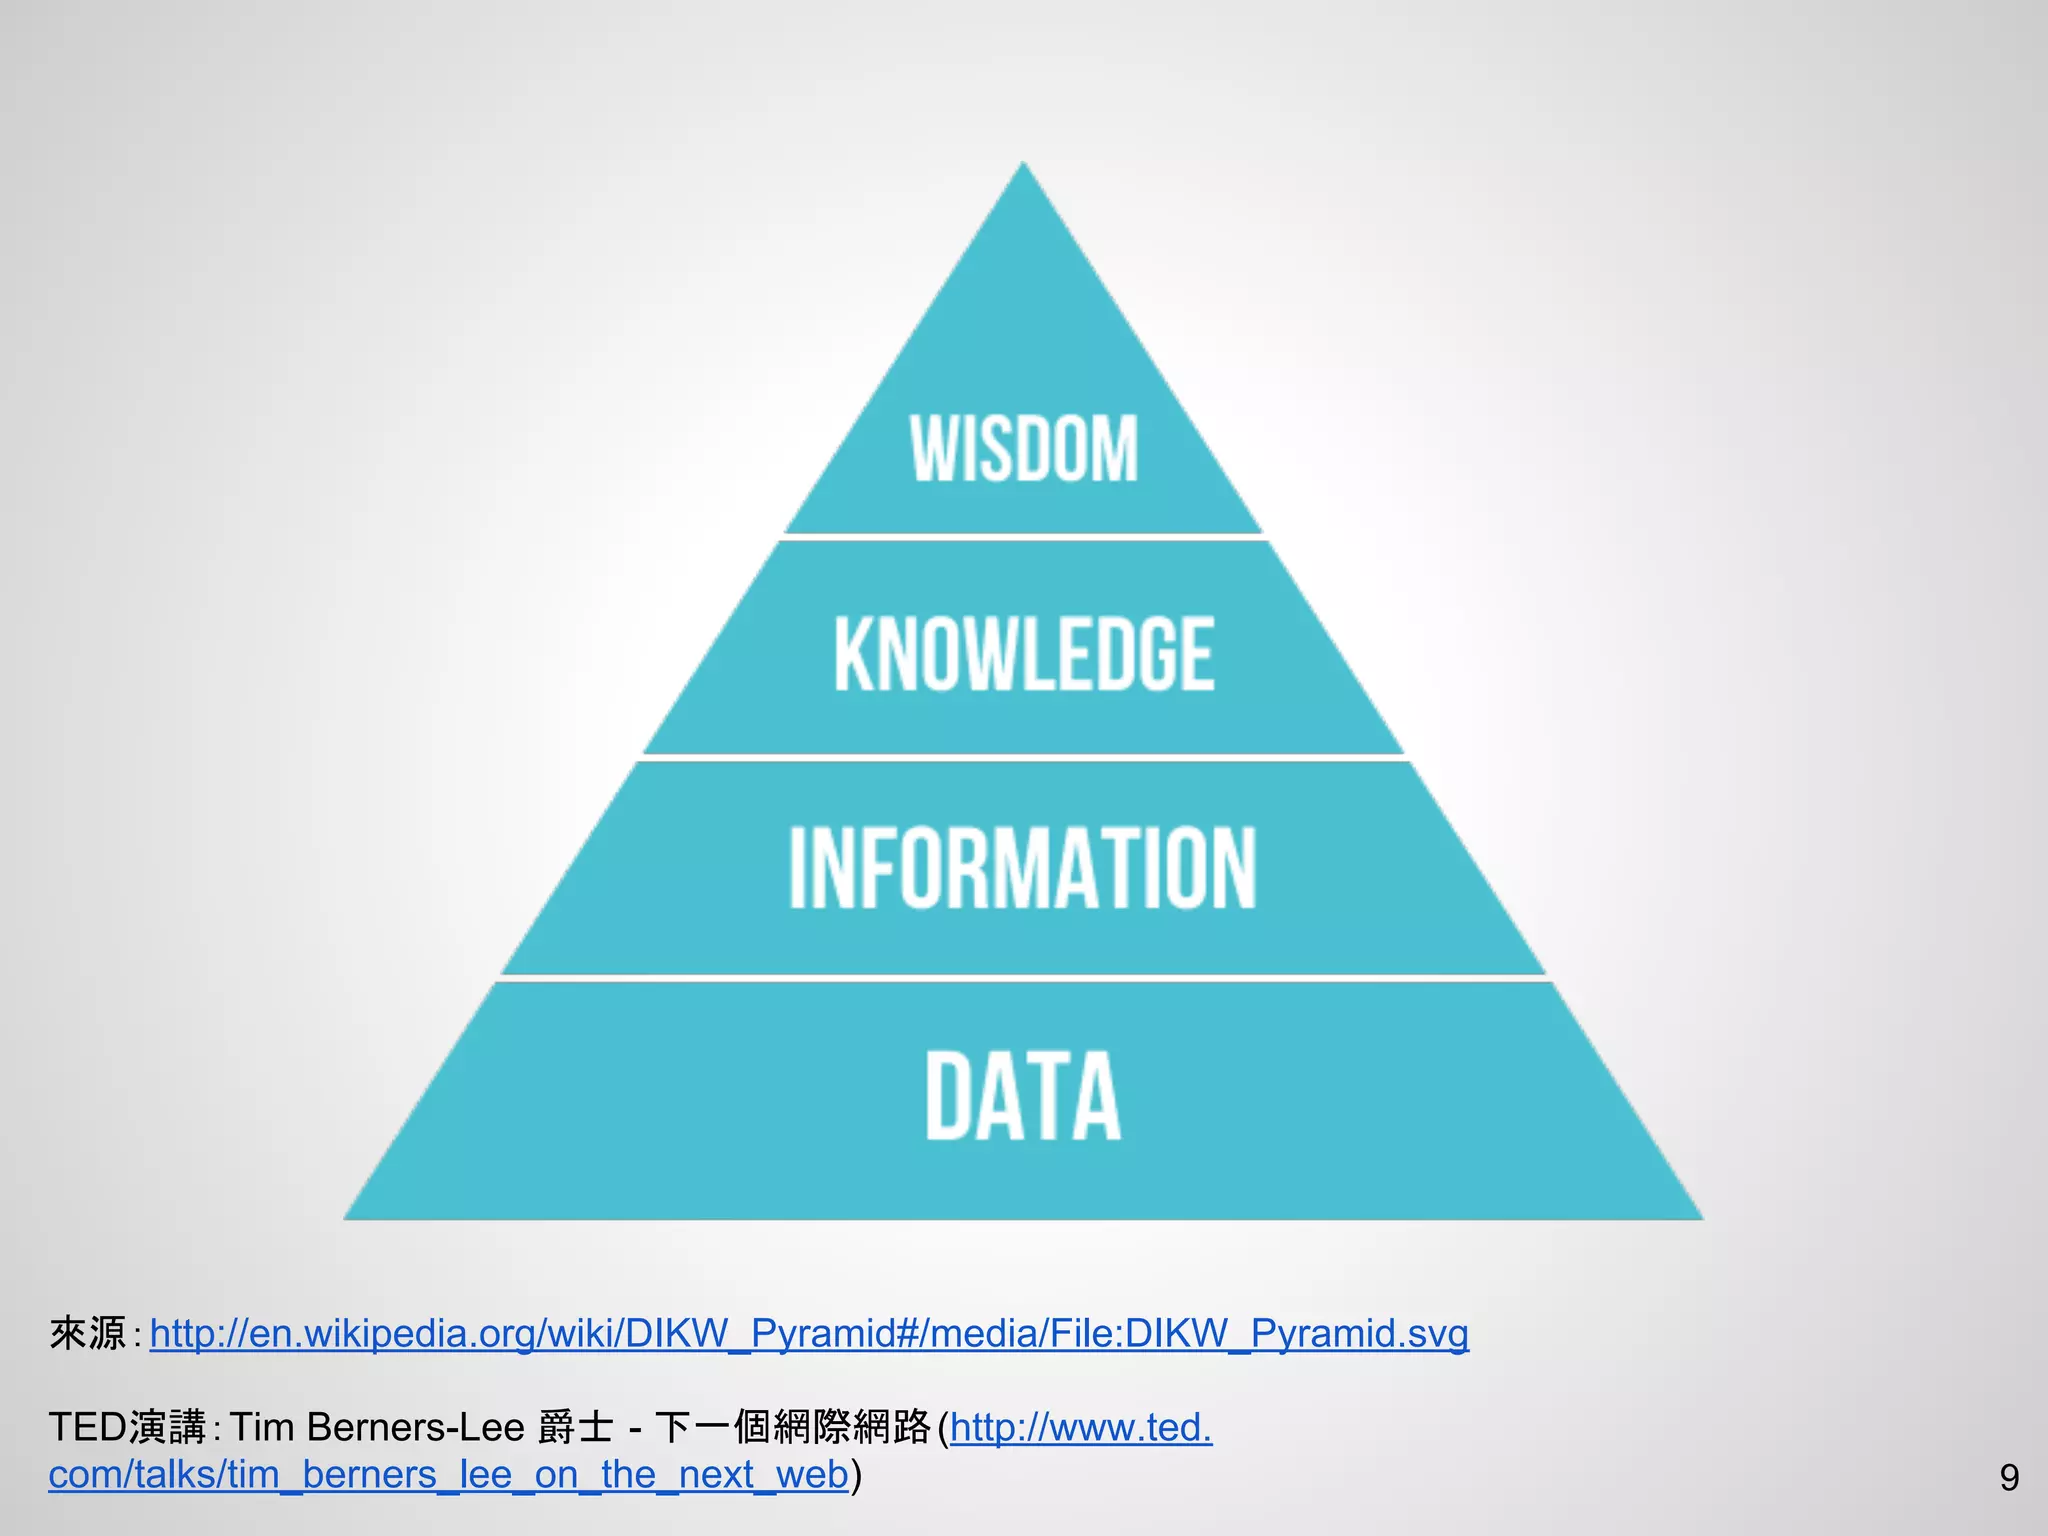
The greater my wisdom, then
greater my grief.n
To increase knowledge onlyn
increases sorrow.n
n
Ecclesiastes 1:18
The greater my wisdom, the
greater my grief.
To increase knowledge only
increases sorrow.
Ecclesiastes 1:18
The greater my wisdom, the
greater my grief. To increase
knowledge only increases
sorrow.Ecclesiastes 1:18
UNIX系統上的樣子
Windows系統上的樣子
原始檔
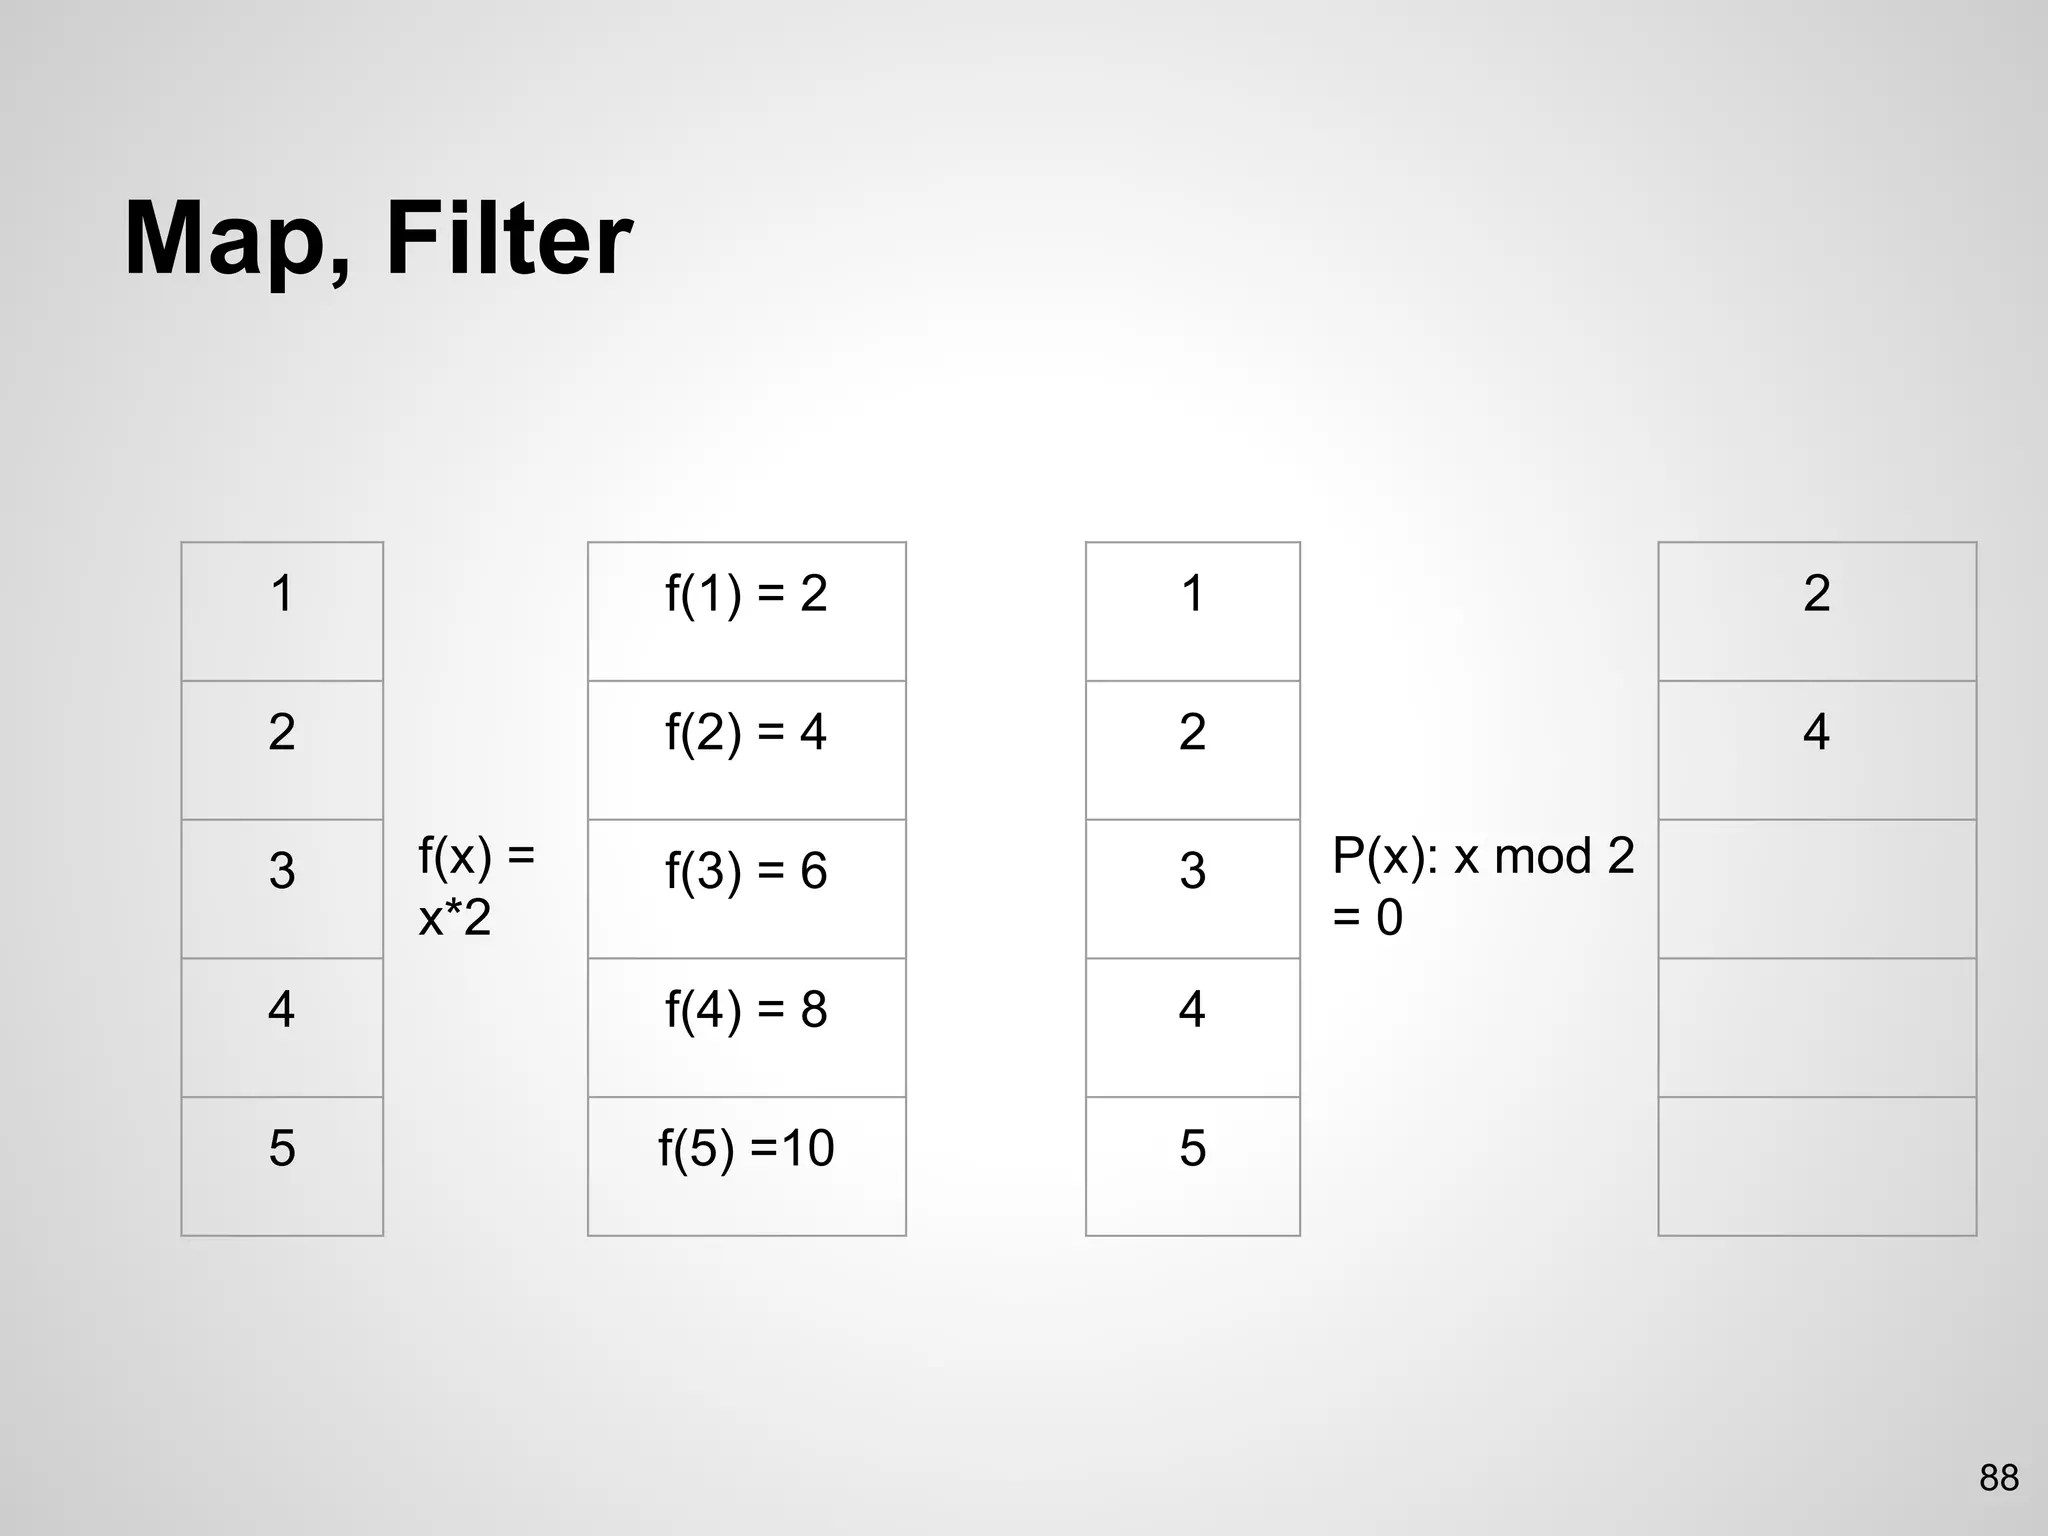
Why?
87
var data ={ children: rawData };
var pack = d3.layout.pack();
pack = pack.padding(2)
.size([1024, 768])
.sort(function (a, b) {
return b.value - a.value;
}); // set the layout
var nodes = pack.nodes(data);
nodes = nodes.filter(function(it) { return it.parent; });
var color = d3.scale.category20(); // helper function to
pick color
89
d3.select('svg')
.selectAll('circle') // selectexisting circles, or create a placeholder
.data(nodes) // parse the data
.enter() // bind the data
.append('circle') // create circle if placeholder exists
.attr({
cx: function (d) { return d.x; },
cy: function (d) { return d.y; },
r: function (d) { return d.r; }
fill: function (d) { return color(d.schoolName); },
stroke: '#444'
}).append('svg:title').text(function (d) {
return d.schoolName + 'n$' +
Number(d.value.toFixed(1)).toLocaleString(); // format the number
to currency
}); // using title attribute to simulate tooltip
注意x, y, r在資料轉變前還
不存在
(如果有人欠揍,資料有key叫x, y or z怎辦?)

![Before we start
2
● Download Startkit
● Download Apache OpenOffice
● For those who use Chrome: (ajax issue)
○ Use Firefox! (it won’t burn your computer)
○ Windows: https://code.google.com/p/mongoose/
○ OS X / Linux:
$ python -m SimpleHTTPServer
Serving HTTP on 0.0.0.0 port 8000 ...
127.0.0.1 - - [27/May/2015 00:33:23] "GET / HTTP/1.1" 200 -
127.0.0.1 - - [27/May/2015 00:33:23] "GET /js/d3.js HTTP/1.1" 200 -
127.0.0.1 - - [27/May/2015 00:33:23] "GET /js/app.js HTTP/1.1" 200 -](https://image.slidesharecdn.com/d3-150530111541-lva1-app6892/75/D3-js-2-2048.jpg)


![JSON
43
[
{
"Year": "1997",
"Make": "Ford",
"Model": "E350",
"Description": "ac, abs, moon",
"Price": "3000.00"
},
…….
{
"Year": "1996",
"Make": "Jeep",
"Model": "Grand Cherokee",
"Description": "MUST SELL!nair, moon roof, loaded",
"Price": "4799.00"
}
]](https://image.slidesharecdn.com/d3-150530111541-lva1-app6892/75/D3-js-43-2048.jpg)


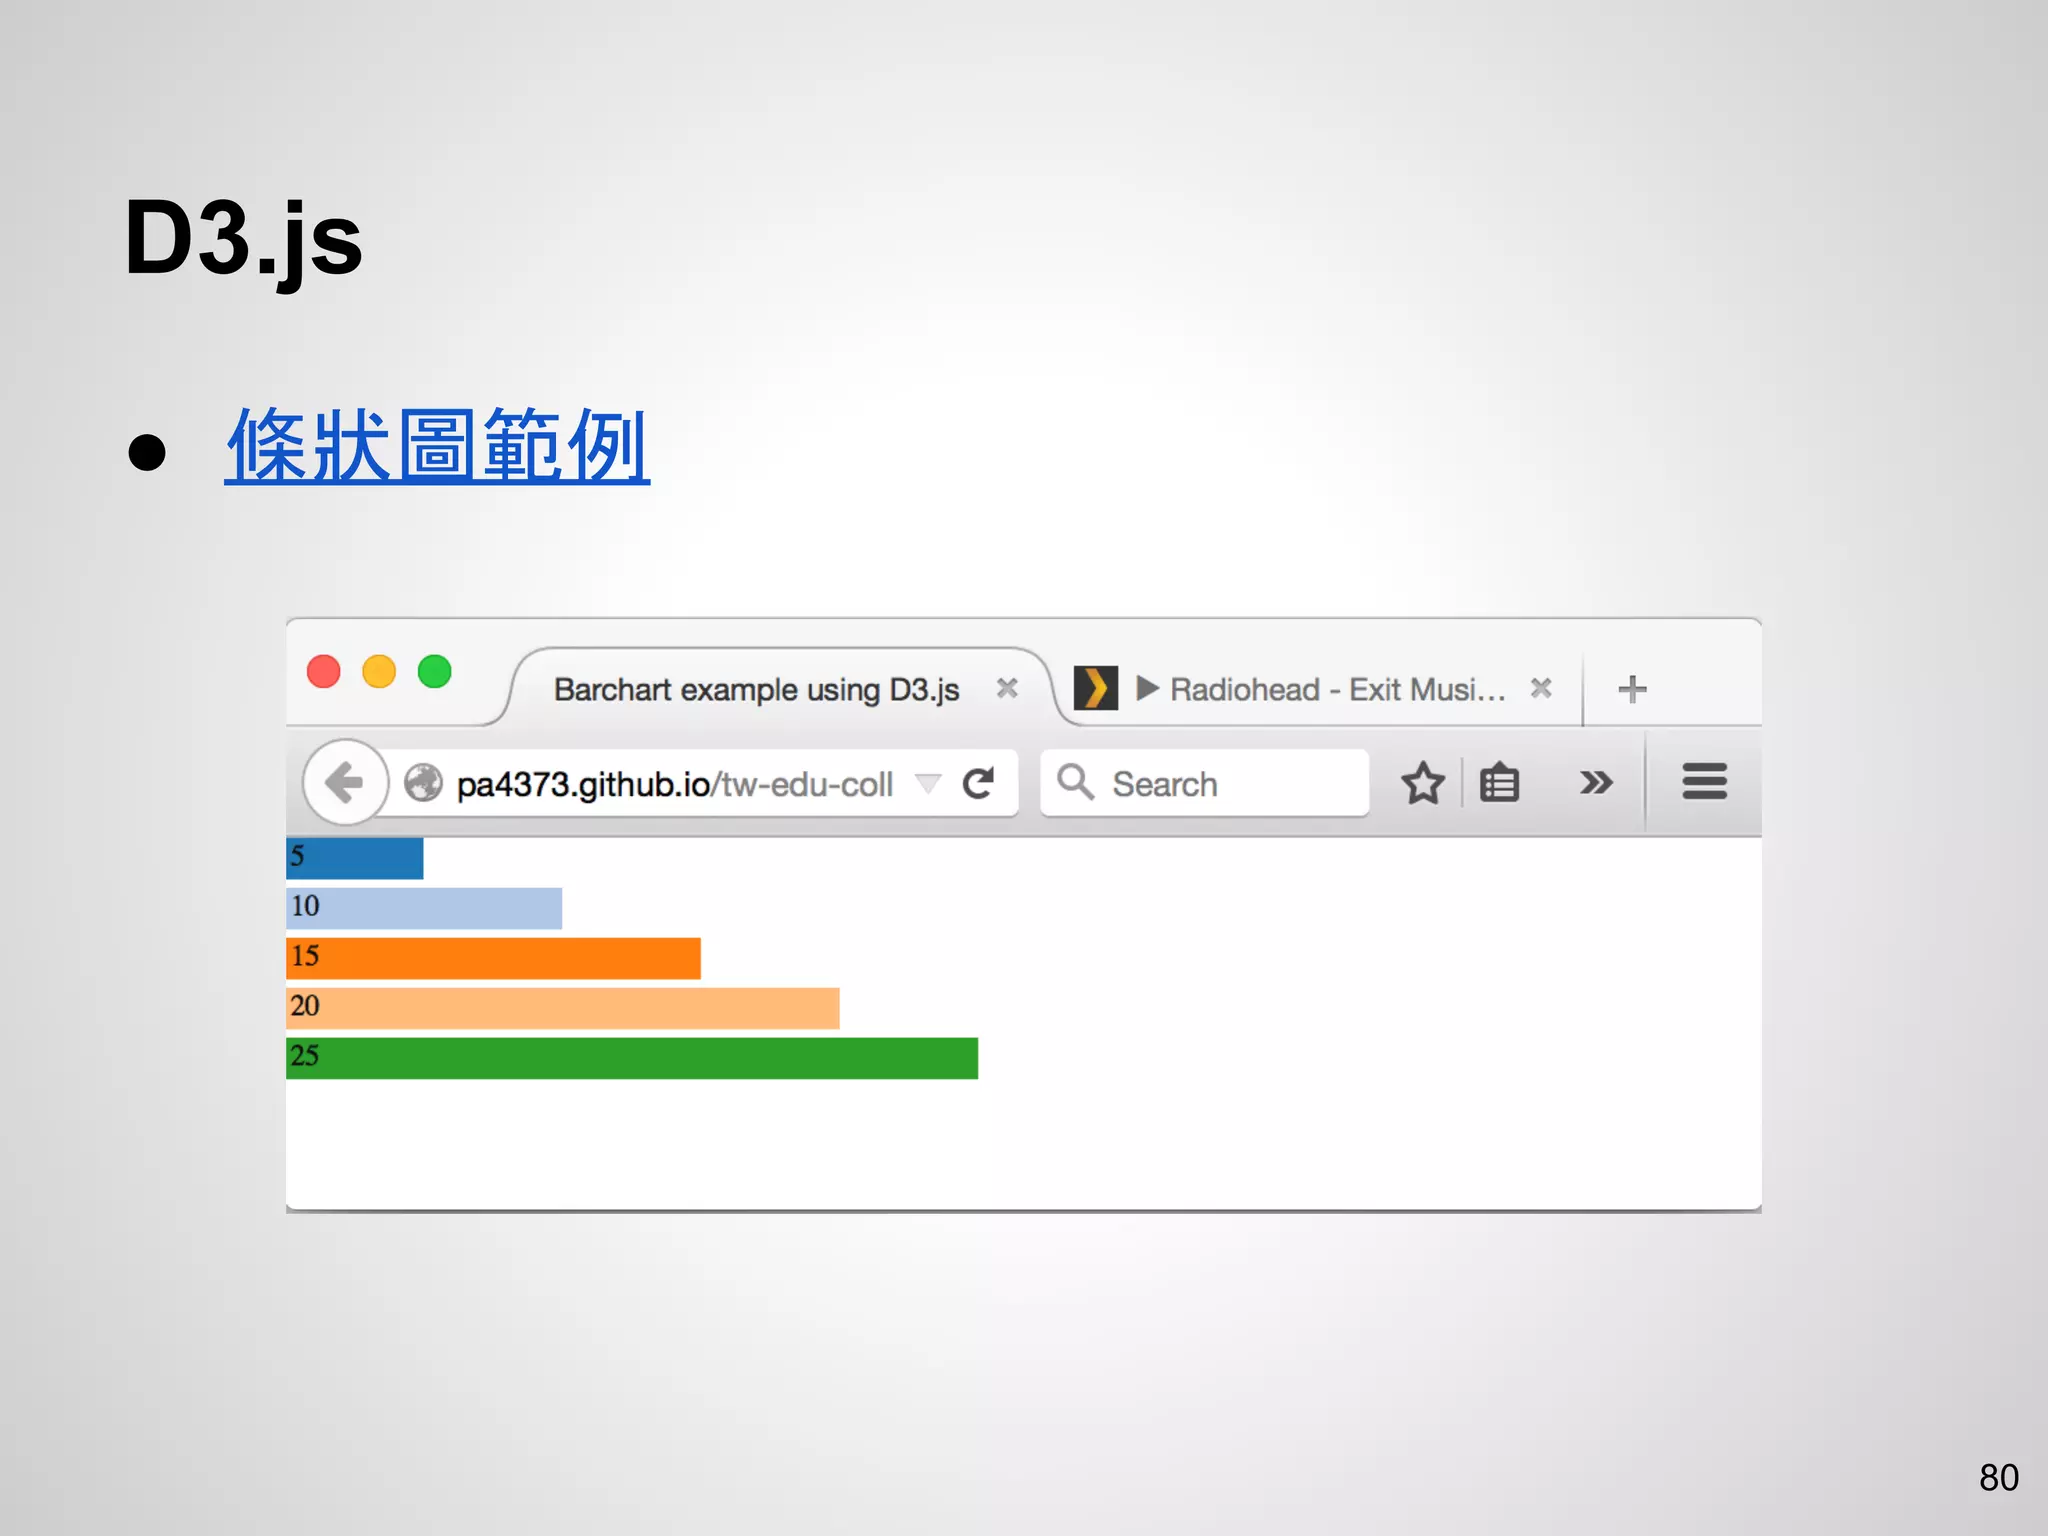
![D3.js: 產生頁面元素 & 綁定資料
● var data = [5, 10, 15, 20, 25];
● var rects = d3.select('svg')
.selectAll('rect')
.data(data)
.enter()
.append('rect');
81](https://image.slidesharecdn.com/d3-150530111541-lva1-app6892/75/D3-js-81-2048.jpg)


![87
var data = { children: rawData };
var pack = d3.layout.pack();
pack = pack.padding(2)
.size([1024, 768])
.sort(function (a, b) {
return b.value - a.value;
}); // set the layout
var nodes = pack.nodes(data);
nodes = nodes.filter(function(it) { return it.parent; });
var color = d3.scale.category20(); // helper function to
pick color](https://image.slidesharecdn.com/d3-150530111541-lva1-app6892/75/D3-js-87-2048.jpg)


![[朝陽科大] D3.js 資料視覺化入門](https://cdn.slidesharecdn.com/ss_thumbnails/d3-1-151223023440-thumbnail.jpg?width=640&height=640&fit=bounds)


![[JSDC 2015] Turf.js - 地理資訊的分析與地圖視覺化](https://cdn.slidesharecdn.com/ss_thumbnails/turfjs-jsdc-151003050030-lva1-app6891-thumbnail.jpg?width=640&height=640&fit=bounds)


