Download as PDF, PPTX


![Feature Engineering Implementation (2)
Example function call for feature generation
22
# Calculate feature: stats for in and out fields
# Register the table names
# Add the table name to the list of tables to be
# passed to the join function
keys = ['dst','date']
aggs=['min','max','sum','mean']
in_out_stats = agg_num_columns(keys, columns=['in','out'], aggs=aggs)
in_out_stats.registerTempTable('io_stats')
tables.append('io_stats')](https://image.slidesharecdn.com/read-180531210834/85/Cyber-Threat-Ranking-using-READ-22-320.jpg)


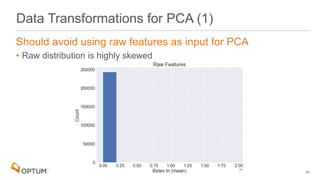


This document describes a proposed approach to rank cyber threat indicators of compromise (IOCs) matched in enterprise data based on reconstruction error from principal component analysis (PCA). The approach involves extracting IOCs from threat feeds, matching them to features engineered from proxy log and other data, decomposing the matched features with PCA, calculating a reconstruction error score to rank matches, and supplementing top ranked matches with contextual details to aid investigation. Future work may include adding an autoencoder model, incorporating analyst feedback, and using additional data sources.


![[DSC Europe 25] Elena Menshikova - AI-Powered Operational Excellence: Revolut...](https://cdn.slidesharecdn.com/ss_thumbnails/es6nholbqy3zaao2c2yd-2-elena-menshikova-data-ai-in-decision-making-260115093812-4fba8b38-thumbnail.jpg?width=640&height=640&fit=bounds)


![[DSC Europe 25] Srba Markovic - From Pilot to Production: Overcoming AI Deplo...](https://cdn.slidesharecdn.com/ss_thumbnails/yjjmrtytmwbalxlba7px-4-srba-markovic-from-pilot-to-production-overcoming-ai-deployment-blockers-with-260114111931-4a892d44-thumbnail.jpg?width=640&height=640&fit=bounds)
![[DSC Europe 25] Stefan Brankovic - #ResumeIsDead. AI-Powered Interviews and C...](https://cdn.slidesharecdn.com/ss_thumbnails/qnmbsv0xq3uysdrq3sev-2-stefan-brankovic-job-bolt-260114111931-a065aa3d-thumbnail.jpg?width=640&height=640&fit=bounds)


![[DSC Europe 25] Ivica Milaric - The Future of Gaming and AI Tools.pptx](https://cdn.slidesharecdn.com/ss_thumbnails/tijgzsmgse2kj2y5pzzp-5-ivica-milaric-the-future-of-gaming-x-ai-tools-260114111931-87c2b3ac-thumbnail.jpg?width=640&height=640&fit=bounds)
