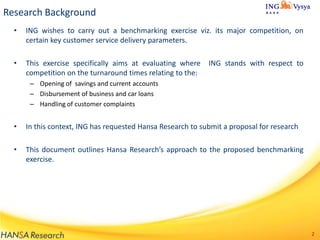
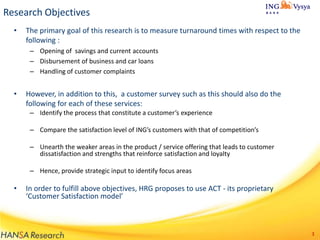
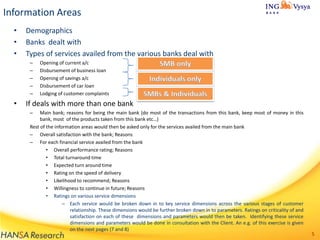
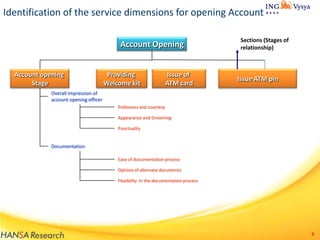
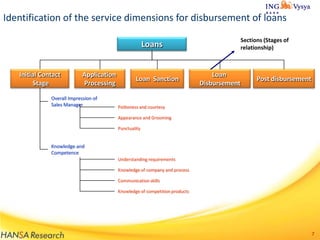
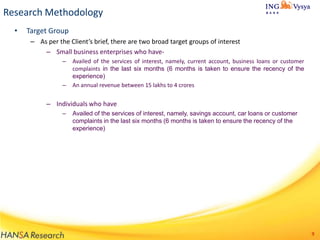
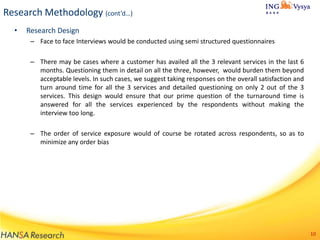
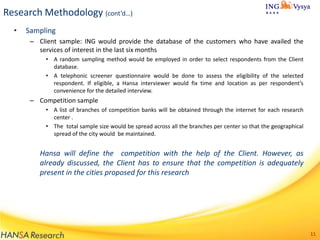
Benchmarking Customer Satisfaction :
ING vs. Competition
Prepared for

ING Vysya Bank
Prepared by

August, 2010

1
Research Background
•

ING wishes to carry out a benchmarking exercise viz. its major competition, on
certain key customer service delivery parameters.

•

This exercise specifically aims at evaluating where
competition on the turnaround times relating to the:

ING stands with respect to

– Opening of savings and current accounts
– Disbursement of business and car loans
– Handling of customer complaints

•

In this context, ING has requested Hansa Research to submit a proposal for research

•

This document outlines Hansa Research’s approach to the proposed benchmarking
exercise.

2
Research Objectives
•

The primary goal of this research is to measure turnaround times with respect to the
following :
– Opening of savings and current accounts
– Disbursement of business and car loans
– Handling of customer complaints

•

However, in addition to this, a customer survey such as this should also do the
following for each of these services:
– Identify the process that constitute a customer’s experience
– Compare the satisfaction level of ING’s customers with that of competition’s

– Unearth the weaker areas in the product / service offering that leads to customer
dissatisfaction and strengths that reinforce satisfaction and loyalty
– Hence, provide strategic input to identify focus areas

•

In order to fulfill above objectives, HRG proposes to use ACT - its proprietary
‘Customer Satisfaction model’

3
Information Areas

4
Information Areas
•
•
•

Demographics
Banks dealt with
Types of services availed from the various banks deal with
–
–
–
–
–

•

Opening of current a/c
Disbursement of business loan
Opening of savings a/c
Disbursement of car loan
Lodging of customer complaints

If deals with more than one bank
–

Main bank; reasons for being the main bank (do most of the transactions from this bank, keep most of money in this
bank, most of the products taken from this bank etc…)
Rest of the information areas would then be asked only for the services availed from the main bank
– Overall satisfaction with the bank; Reasons
– For each financial service availed from the bank
• Overall performance rating; Reasons
• Total turnaround time
• Expected turn around time
• Rating on the speed of delivery
• Likelihood to recommend; Reasons
• Willingness to continue in future; Reasons
• Ratings on various service dimensions
– Each service would be broken down in to key service dimensions across the various stages of customer
relationship. These dimensions would be further broken down in to parameters. Ratings on criticality of and
satisfaction on each of these dimensions and parameters would then be taken. Identifying these service
dimensions and parameters would be done in consultation with the Client. An e.g. of this exercise is given
on the next pages (7 and 8)

5
Identification of the service dimensions for opening Account
Account Opening
Account opening
Stage

Providing
Welcome kit

Issue of
ATM card

Sections (Stages of
relationship)

Issue ATM pin

Overall Impression of
account opening officer
Politeness and courtesy
Appearance and Grooming
Punctuality

Documentation
Ease of documentation process
Options of alternate documents
Flexibility in the documentation process

6
Identification of the service dimensions for disbursement of loans
Sections (Stages of
relationship)

Loans
Initial Contact
Stage

Application
Processing

Overall Impression of
Sales Manager

Loan Sanction

Loan
Disbursement

Post disbursement

Politeness and courtesy
Appearance and Grooming
Punctuality

Knowledge and
Competence
Understanding requirements
Knowledge of company and process
Communication skills

Knowledge of competition products

7
Research Methodology

8
Research Methodology
•

Target Group
– As per the Client’s brief, there are two broad target groups of interest
– Small business enterprises who have–

–

Availed of the services of interest, namely, current account, business loans or customer
complaints in the last six months (6 months is taken to ensure the recency of the
experience)
An annual revenue between 15 lakhs to 4 crores

– Individuals who have
–

Availed of the services of interest, namely, savings account, car loans or customer
complaints in the last six months (6 months is taken to ensure the recency of the
experience)

9
Research Methodology (cont’d…)
•

Research Design
– Face to face Interviews would be conducted using semi structured questionnaires
– There may be cases where a customer has availed all the 3 relevant services in the last 6
months. Questioning them in detail on all the three, however, would burden them beyond
acceptable levels. In such cases, we suggest taking responses on the overall satisfaction and
turn around time for all the 3 services and detailed questioning on only 2 out of the 3
services. This design would ensure that our prime question of the turnaround time is
answered for all the services experienced by the respondents without making the
interview too long.
– The order of service exposure would of course be rotated across respondents, so as to
minimize any order bias

10
Research Methodology (cont’d…)
•

Sampling
– Client sample: ING would provide the database of the customers who have availed the
services of interest in the last six months
• A random sampling method would be employed in order to select respondents from the Client
database.
• A telephonic screener questionnaire would be done to assess the eligibility of the selected
respondent. If eligible, a Hansa interviewer would fix time and location as per respondent’s
convenience for the detailed interview.

– Competition sample
• A list of branches of competition banks will be obtained through the internet for each research
center .
• The total sample size would be spread across all the branches per center so that the geographical
spread of the city would be maintained.

Hansa will define the competition with the help of the Client. However, as
already discussed, the Client has to ensure that the competition is adequately
present in the cities proposed for this research

11
Research Methodology (cont’d…)
•

Research Centers
– As per the client’s suggestion, this research is to be undertaken in the North, South and
West zones. However, in keeping with their business strategy, the Client would like this
research to focus more on the North zone .
• The centers chosen within each of these zones need to ensure the representation of the different
tiers of towns, geographical spread and the Client’s presence. Keeping these factors in mind,
Hansa proposes the following centers

Town Selection
North

South

West

Tier 1

Delhi

Chennai

Mumbai

Tier 2

Lucknow and Ludhiana

Vizag

Bhopal

12
Research Methodology (cont’d…)
•

Sample Sizes - SMBs
Option 1: City wise
Reporting

South
West

Per service /per
bank

30

450

Lucknow

30

450

Ludhiana

North

Town

Delhi

Zones

Total sample
size (3 services
and assuming 5
banks to be
covered)

30

450

Chennai

30

450

Vizag

30

450

Mumbai

30

450

Bhopal

30

450

210

3150

Option 2 : Zone wise
Reporting

Total Sample sizes

Per service /per
bank

Total sample
size (3 services
and assuming 5
banks to be
covered)

30

450

30

450

30

450

90

1350

– The total no. of interviews may be lesser than the above mentioned nos if respondents
qualify for questioning on more than one service

13
Research Methodology (cont’d…)
•

Sample Sizes - Individuals
Option 1: City wise
Reporting

South
West

Per service /per
bank

30

450

Lucknow

30

450

Ludhiana

North

Town

Delhi

Zones

Total sample
size (3 services
and assuming 5
banks to be
covered)

30

450

Chennai

30

450

Vizag

30

450

Mumbai

30

450

Bhopal

30

450

210

3150

Option 2 : Zone wise
Reporting

Total Sample sizes

Per service /per
bank

Total sample
size (3 services
and assuming 5
banks to be
covered)

30

450

30

450

30

450

90

1350

– The total no. of interviews may be lesser than the above mentioned nos if respondents
qualifies for more than one service

14
Hansa’s approach
ACT Measurement Indices

15
Performance Measurement - HANSA’s Approach

PERFORMANCE MEASUREMENT :
10 Point Scale with anchored end points
10
Excellent

09

08

07

06

05

04

03

02

01
Ext. Poor

16
Criticality Measurement - HANSA’s Approach
Let the customer specify how ‘Critical’ (not just important) is a dimension to him in
keeping a relationship going – in the context of the service

CRITICALITY MEASUREMENT :
This is an extremely
important dimension
and if some other
company delivers
beyond my expectation
on this dimension, I will
definitely switch to the
product of that
company

This is a very
important dimension
and if some other
company delivers
beyond my
expectation on this
dimension, I will
probably switch to
the product of that
company

This is an important
dimension, but even if
some other company
delivers beyond my
expectation on this
dimension, I may not
switch to the product
of that company

This is not so important
dimension, and even if
some other company
delivers beyond my
expectation on this
dimension, I will
definitely not switch to
the product of that
company

4

3

2

1

17
Performance x Criticality = ACT WINDOW

PERFORMANCE

High

Analyze to see if these have been
over invested in

Low priority areas - tackle later

Maintain

Key action areas

Low
Low

CRITICALITY

High

18
Customer ACT Deliverables

19
ACT DETAILED SCORE CARD - The ACT Blue Print©
The ACT Blue Print that has the following components:
I.

Executive Summary

II.

Customer Satisfaction
I. Turnaround Time
II. Overall Customer Satisfaction
I.
II.

For customers
Across various dimensions of service delivery (Time taken, Competence, Impression etc.)

III. Relative Criticality
IV. ACT Actionable Window - Criticality vs. Performance

III.

Diagnostics into customer satisfaction
I. Reasons for Satisfaction / Dissatisfaction
II. Likes / Dislikes with relevant dimensions
III. Dimensions in service delivery that need improvement
IV. How can delivery on service dimensions be improved?

IV.

Action Plan to improve satisfaction among customer segments

20
REPORT CARD - Turnaround Time

ING Vysya
vs. Bank 1

ING Vysya
vs. Bank 2

ING Vysya
vs. Bank 3

ING Vysya
vs. Bank 4

Savings A/c

++

++

--

+

Current A/c

=

--

++

=

Business Loan

-

=

-

-

Car Loan

+

+

-

+

Customer Complaint

+

=

-

=

“++” indicates “significantly lower turnaround time”
“--” indicates “significantly higher turnaround time”
“+” indicates “directionally lower turnaround time”
“-” indicates “directionally higher turnaround time”
“=” indicates “significantly lower turnaround time”

21
TURNAROUND TIME - In Days

ING
Vysya

Bank 1

Bank 2

Bank 3

Bank 4

Actual TA time (Mean)

4.8

3.4

5.4

4.6

6.7

Expected TA time (Mean)

4

3

5

4

6

Actual TA time (Mean)

3.5

3.9

6.9

5.5

7.5

Expected TA time (Mean)

4

5

6

5

7

Actual TA time (Mean)

3.6

5.4

5.9

3.8

4.5

Expected TA time (Mean)

3

5

6

3

4

Actual TA time (Mean)

5.2

4.5

8

6.9

5

Expected TA time (Mean)

5

4

6

7

4

Actual TA time (Mean)

1.6

1.3

3.1

3.2

2.5

Expected TA time (Mean)

2

1

2

3

2

Turnaround (TA) time (In Days)

Savings A/c

Current A/c
Business
Loan
Car Loan
Customer
Complaint

22
ING
Vysya
Bank 1

Bank 2

Bank 3

Bank 4

Extremely
poor

Excellent

Bank Name

SPEED OF DELIVERY - Savings Account

10

9

37

8

7

6

6

5

22

4

3

2

5

30

5

30

5

30

5

30

5

1

30

Mean - 6.9
37

6

22
Mean - 6.9

37

6

22
Mean - 6.9

37

6

22
Mean - 6.9

37

6

22

Mean - 6.9
23
ING
Vysya
Bank 1

Bank 2

Bank 3

Bank 4

Extremely
poor

Excellent

Bank Name

SPEED OF DELIVERY - Current Account

10

9

37

8

7

6

6

5

22

4

3

2

5

30

5

30

5

30

5

30

5

1

30

Mean - 6.9
37

6

22
Mean - 6.9

37

6

22
Mean - 6.9

37

6

22
Mean - 6.9

37

6

22

Mean - 6.9
24
ING
Vysya
Bank 1

Bank 2

Bank 3

Bank 4

Extremely
poor

Excellent

Bank Name

SPEED OF DELIVERY - Business Loan

10

9

37

8

7

6

6

5

22

4

3

2

5

30

5

30

5

30

5

30

5

1

30

Mean - 6.9
37

6

22
Mean - 6.9

37

6

22
Mean - 6.9

37

6

22
Mean - 6.9

37

6

22

Mean - 6.9
25
ING

Bank 1

Bank 2

Bank 3

Bank 4

Extremely
poor

Excellent

Bank Name

SPEED OF DELIVERY - Car Loan

10

9

37

8

7

6

6

5

22

4

3

2

5

30

5

30

5

30

5

30

5

1

30

Mean - 6.9
37

6

22
Mean - 6.9

37

6

22
Mean - 6.9

37

6

22
Mean - 6.9

37

6

22

Mean - 6.9
26
ING
Vysya
Bank 1

Bank 2

Bank 3

Bank 4

Extremely
poor

Excellent

Bank Name

SPEED OF SOLVING - Customer Complaint

10

9

37

8

7

6

6

5

22

4

3

2

5

30

5

30

5

30

5

30

5

1

30

Mean - 6.9
37

6

22
Mean - 6.9

37

6

22
Mean - 6.9

37

6

22
Mean - 6.9

37

6

22

Mean - 6.9
27
Managing Quality

28
Quality Control
•

Hansa Research meets or exceeds industry standards for quality control in data
collection
and
data processing. The following steps would be taken to
ensure quality control:
– Fieldwork would be carried out by teams of interviewers trained by Hansa researchers and
senior field staff.
– A centralized briefing of our full data collection team would be organized on the goals and
specifications of a project before data collection.
– Daily contact with researchers during the fieldwork process.
– 25% of all interviewed would be back checked
– 10% of all interviews would be accompanied
– 100% of all questionnaires would be scrutinized

29
Required Investments

30
Time

Option 1 - City wise

Option 2 - Zone wise

Questionnaire Design

1 week

1 week

Field Material Preparation and Briefing

1 week

1 week

Field Work

2 weeks

1 ½ weeks

Tabulation and Analysis

1 week

1 week

Report Preparation

1 week

1 week

6 weeks

5 ½ weeks

TOTAL Time

31
Cost

Option 1 - City wise

Option 2 - Zone wise

SMB

10,92,000

5,20,000

Individual

7,51,000

3,60,000

TOTAL

18,43,000

8,80,000

• The costs given above do not include the mandatory service tax component of
10.36% payable to the Government of India
• Payment terms and conditions
– 50% advance at the stage of project commissioning
– 50% balance on presentation of findings

32
Hansa Research’s
Customer Satisfaction Experience

33
Customer Satisfaction Survey: Branch (Liability)
•

Objective: To capture customer feedback for the services offered at branches.

•

Methodology: Information is captured using a self-administered feedback form.

•

Scope: Services are monitored at around 390 branches spread across 188 cities of
India

•

Frequency: Continuous track (initiated in Dec 2003) where each branch is monitored
twice in a month and the data is reported on fortnightly basis.

•

Reporting: The data is reported by branch, city, cluster, region, zone and also by
different service parameters ( for instance, soft skills, waiting time etc)
– Data reported on fifth day from fieldwork

34
Customer Satisfaction Survey: Phone Banking
•

Objective: To capture customer feedback for the services offered at Phone Banking
Channel.

•

Methodology: Online survey where after seeking customer’s approval, the call is
transferred to the Research Officer who then captures customer’s feedback on

today’s experience. The data is captured on a website and gets automatically saved
on HRG’s server.
•

Frequency: Continuous track where the data is captured on daily basis. The data is
analyzed and reported on weekly basis.

•

Reporting: The data is reported by location (Mumbai, Hyderabad), skill (for instance,
credit card, loans etc), team leaders, etc and also by different service parameters ( for
instance, soft skills, waiting time etc)

35
Customer Satisfaction Survey: Email
•

Objective: To capture customer feedback on his experience on query resolution via
Email Channel.

•

Methodology: A customer may raise a query to the client via Email. The query then
gets transferred to different teams depending on the product or which the query has

been raised. Along with the resolution, goes a link where customer is requested to
submit his responses regarding his experiences on the query resolution process. The
data then gets automatically saved on HRG’s server.
•

Frequency: Continuous track where the data is captured on daily basis. The data is

analyzed and reported on weekly basis
•

Reporting: The data is reported separately for each product (for instance, credit card,
private banking, loans, FDs etc)

36
Service Quality Survey: Initial Interaction Experience
•

Objective: To capture customer feedback on his experience on the initial interaction
with the bank

•

Methodology: During the initial interaction with the bank, a customer gets a
welcome kit (across all the products and services). The kit along with other

documents, also contains a Business Reply Envelope (BRE) asking the customer to
submit his responses with respect to his experiences on the initial interaction with
the bank.
•

Frequency: Continuous track

•

Reporting: The data is analyzed and reported separately for each product (for
instance, credit card, savings account, loans, etc)

37
Customer Satisfaction Survey
•

Objective: To assess satisfaction using Hansa’s proprietary ACT model
– Factoring in criticality of individual dimensions across all interaction points
– Assessed against customers’ expectation
– Benchmarked across competition

•

Methodology :Respondents selected from database provided by client following
systematic random sampling, sorting by size of relationship. For benchmarking
competition customers selected purposively.

•

Sample size: 9000 covered across 32 cities

•

Products and Services covered in the study:
– Savings Account, Salary Account, Current Account
– Credit Cards
– Home Loan, Car Loan, Personal Loan, Commercial Vehicle Loan and Two Wheeler Loan

38
Engagement Team Profile
(Quantitative Research)

39
Anuradha Roy Chowdhury
Senior Vice President and Head of Hansa Tech
Hansa Research Group, Bangalore

Anuradha Roy Chowdhury heads Hansa Tech, the Technology research business of Hansa Research.
She has about 20 years of experience in all areas of Market Research including Customer Satisfaction Research,
Brand Health Measurement and monitoring, Advertising Research, Concept and Product Tests, Corporate
Image Measurement. Post launch evaluation, Pricing research, Baseline market studies, Demand estimations,
Industry/Category studies and Database building. This experience spans diverse categories and verticals … including
Technology, FMCG, Durables and Retail.
Anuradha has considerable experience in different data collection methodologies, including face to face, telephone
and Online. She has worked on data from a range of countries, including both developed markets such as the US and
UK, and developing ones such as India, Malaysia, China and Turkey.

Anuradha has a Masters degree in Research and Evaluation Methodology from Utah State University.
She was with ACNielsen ORG-Marg for 15 years prior to joining Hansa Research, where she help positions such as
Head - Branded Products, Head – Claritas Micromarketing and Head – Tobacco Business

40
Sonakshi Singh
Associate Research Director
Hansa Research Group, Bangalore

Sonakshi Singh has around 4 years of research experience in Quantitative research. During this period, she has
executed and managed projects of varying sizes across a number of categories. She has handled projects across
a wide stream of verticals such as FMCG, beverages, finance and IT
Also, she has experience in conducting and managing an array of customised and syndicated research studies …
to name a few  Product tests, Catchment area profiling, Advertisement concept tests, Pricing research,
Satisfaction measurement, Market sizing and Syndicated research.
Sonakshi has considerable experience in different data collection methodologies, including face to face,
telephone and Online. She has worked on data from a range of countries, including both developed markets
such as the US and UK, and developing ones such as India, Malaysia, China and Turkey.

Sonakshi has a post graduate degree in business administration

41
Gurpreet Singh Aulakh
Senior Research Executive
Hansa Research Group, Bangalore

Gurpreet Singh has around 3 years of research experience in Quantitative research. During this period, he has
executed and managed projects of varying sizes across a number of categories. This experience spans diverse
categories and verticals such as Technology, FMCG, Alcoholic beverages, Retail, and Durables.
Also, he has experience in conducting and managing an array of customised and syndicated research studies …
to name a few  Product tests, Catchment area profiling, Advertisement concept tests, Pricing research,
Satisfaction measurement, Market sizing and Syndicated research.
Gurpreet has considerable experience in different data collection methodologies, including face to face,
telephone and Online. He has worked on data from a range of countries, including both developed markets such
as the US and UK, and developing ones such as India, Malaysia, China and Turkey.

Gurpreet has a bachelors degree in electronics and communication engineering and a post graduate
degree in business administration.

42
CH Jagadish
Senior Research Executive
Hansa Research Group, Bangalore

Jagadish currently works with Hansa Tech, the Technology research business of Hansa Research.
He has 2 years of research experience in Quantitative research. During this period, he has executed and
managed projects of varying sizes across a number of categories. This experience spans diverse categories and
verticals such as Technology, Alcoholic beverages, Retail, and Durables.
Also, he has experience in conducting and managing an array of customised and syndicated research studies …
to name a few  Product tests, Catchment area profiling, Advertisement concept tests, Satisfaction
measurement and Syndicated research.
Jagadish has considerable experience in different data collection methodologies, including face to face,
telephone and Online. He has worked on data from a range of countries, including both developed markets such
as the US and UK, and developing ones such as India, Malaysia, China and Turkey.
Jagadish has a Master’s degree in Business Administration from ICFAI Business School, Chennai and a
Bachelor’s degree in Pharmacy from JNTU, Hyderabad.

43
ANALYSIS
Swati D. Satam
Analysis Manager
Hansa Research Group, Mumbai

Swati Satam heads the Analysis Dept. of Hansa Research, Mumbai.
She is involved in several aspects of analysis engagements including setting up the analysis of projects, using
software’s like Quantum/SPSS, Job allocation & Monitoring, Recruitment & Training, and delivery of Quality
outputs within given time .
In the span of 12 years in Analysis, she has garnered considerable experience in projects from all industries,
including Media, Pharma, Financial Services, and Telecom & Industrial Products. She has honed the skills of
handling large volume of data & analysed data for any type of interview including Pen & Paper, online / web
based, CATI and CAPI.
She has hands on studies like syndicated studies, Brand Scan, product testing, Readership survey, Outdoor. In
addition, she has exposure to an array of statistical tools like Cluster, Factor, Regression, Correlation, Conjoint,
Correspondence, MDPref, BPTO, Jaccard and CHAID
Swati has a Masters degree in Statistics from Mumbai University & a Diploma in Computer
programming & systems analysis. She has worked with IMRB, Ugam Solutions & ACNielsen ORG-Marg for about
6 years prior to joining Hansa Research
44

Custome satisfaction proposal

  • 1.
    Benchmarking Customer Satisfaction: ING vs. Competition Prepared for ING Vysya Bank Prepared by August, 2010 1
  • 2.
    Research Background • ING wishesto carry out a benchmarking exercise viz. its major competition, on certain key customer service delivery parameters. • This exercise specifically aims at evaluating where competition on the turnaround times relating to the: ING stands with respect to – Opening of savings and current accounts – Disbursement of business and car loans – Handling of customer complaints • In this context, ING has requested Hansa Research to submit a proposal for research • This document outlines Hansa Research’s approach to the proposed benchmarking exercise. 2
  • 3.
    Research Objectives • The primarygoal of this research is to measure turnaround times with respect to the following : – Opening of savings and current accounts – Disbursement of business and car loans – Handling of customer complaints • However, in addition to this, a customer survey such as this should also do the following for each of these services: – Identify the process that constitute a customer’s experience – Compare the satisfaction level of ING’s customers with that of competition’s – Unearth the weaker areas in the product / service offering that leads to customer dissatisfaction and strengths that reinforce satisfaction and loyalty – Hence, provide strategic input to identify focus areas • In order to fulfill above objectives, HRG proposes to use ACT - its proprietary ‘Customer Satisfaction model’ 3
  • 4.
  • 5.
    Information Areas • • • Demographics Banks dealtwith Types of services availed from the various banks deal with – – – – – • Opening of current a/c Disbursement of business loan Opening of savings a/c Disbursement of car loan Lodging of customer complaints If deals with more than one bank – Main bank; reasons for being the main bank (do most of the transactions from this bank, keep most of money in this bank, most of the products taken from this bank etc…) Rest of the information areas would then be asked only for the services availed from the main bank – Overall satisfaction with the bank; Reasons – For each financial service availed from the bank • Overall performance rating; Reasons • Total turnaround time • Expected turn around time • Rating on the speed of delivery • Likelihood to recommend; Reasons • Willingness to continue in future; Reasons • Ratings on various service dimensions – Each service would be broken down in to key service dimensions across the various stages of customer relationship. These dimensions would be further broken down in to parameters. Ratings on criticality of and satisfaction on each of these dimensions and parameters would then be taken. Identifying these service dimensions and parameters would be done in consultation with the Client. An e.g. of this exercise is given on the next pages (7 and 8) 5
  • 6.
    Identification of theservice dimensions for opening Account Account Opening Account opening Stage Providing Welcome kit Issue of ATM card Sections (Stages of relationship) Issue ATM pin Overall Impression of account opening officer Politeness and courtesy Appearance and Grooming Punctuality Documentation Ease of documentation process Options of alternate documents Flexibility in the documentation process 6
  • 7.
    Identification of theservice dimensions for disbursement of loans Sections (Stages of relationship) Loans Initial Contact Stage Application Processing Overall Impression of Sales Manager Loan Sanction Loan Disbursement Post disbursement Politeness and courtesy Appearance and Grooming Punctuality Knowledge and Competence Understanding requirements Knowledge of company and process Communication skills Knowledge of competition products 7
  • 8.
  • 9.
    Research Methodology • Target Group –As per the Client’s brief, there are two broad target groups of interest – Small business enterprises who have– – Availed of the services of interest, namely, current account, business loans or customer complaints in the last six months (6 months is taken to ensure the recency of the experience) An annual revenue between 15 lakhs to 4 crores – Individuals who have – Availed of the services of interest, namely, savings account, car loans or customer complaints in the last six months (6 months is taken to ensure the recency of the experience) 9
  • 10.
    Research Methodology (cont’d…) • ResearchDesign – Face to face Interviews would be conducted using semi structured questionnaires – There may be cases where a customer has availed all the 3 relevant services in the last 6 months. Questioning them in detail on all the three, however, would burden them beyond acceptable levels. In such cases, we suggest taking responses on the overall satisfaction and turn around time for all the 3 services and detailed questioning on only 2 out of the 3 services. This design would ensure that our prime question of the turnaround time is answered for all the services experienced by the respondents without making the interview too long. – The order of service exposure would of course be rotated across respondents, so as to minimize any order bias 10
  • 11.
    Research Methodology (cont’d…) • Sampling –Client sample: ING would provide the database of the customers who have availed the services of interest in the last six months • A random sampling method would be employed in order to select respondents from the Client database. • A telephonic screener questionnaire would be done to assess the eligibility of the selected respondent. If eligible, a Hansa interviewer would fix time and location as per respondent’s convenience for the detailed interview. – Competition sample • A list of branches of competition banks will be obtained through the internet for each research center . • The total sample size would be spread across all the branches per center so that the geographical spread of the city would be maintained. Hansa will define the competition with the help of the Client. However, as already discussed, the Client has to ensure that the competition is adequately present in the cities proposed for this research 11
  • 12.
    Research Methodology (cont’d…) • ResearchCenters – As per the client’s suggestion, this research is to be undertaken in the North, South and West zones. However, in keeping with their business strategy, the Client would like this research to focus more on the North zone . • The centers chosen within each of these zones need to ensure the representation of the different tiers of towns, geographical spread and the Client’s presence. Keeping these factors in mind, Hansa proposes the following centers Town Selection North South West Tier 1 Delhi Chennai Mumbai Tier 2 Lucknow and Ludhiana Vizag Bhopal 12
  • 13.
    Research Methodology (cont’d…) • SampleSizes - SMBs Option 1: City wise Reporting South West Per service /per bank 30 450 Lucknow 30 450 Ludhiana North Town Delhi Zones Total sample size (3 services and assuming 5 banks to be covered) 30 450 Chennai 30 450 Vizag 30 450 Mumbai 30 450 Bhopal 30 450 210 3150 Option 2 : Zone wise Reporting Total Sample sizes Per service /per bank Total sample size (3 services and assuming 5 banks to be covered) 30 450 30 450 30 450 90 1350 – The total no. of interviews may be lesser than the above mentioned nos if respondents qualify for questioning on more than one service 13
  • 14.
    Research Methodology (cont’d…) • SampleSizes - Individuals Option 1: City wise Reporting South West Per service /per bank 30 450 Lucknow 30 450 Ludhiana North Town Delhi Zones Total sample size (3 services and assuming 5 banks to be covered) 30 450 Chennai 30 450 Vizag 30 450 Mumbai 30 450 Bhopal 30 450 210 3150 Option 2 : Zone wise Reporting Total Sample sizes Per service /per bank Total sample size (3 services and assuming 5 banks to be covered) 30 450 30 450 30 450 90 1350 – The total no. of interviews may be lesser than the above mentioned nos if respondents qualifies for more than one service 14
  • 15.
  • 16.
    Performance Measurement -HANSA’s Approach PERFORMANCE MEASUREMENT : 10 Point Scale with anchored end points 10 Excellent 09 08 07 06 05 04 03 02 01 Ext. Poor 16
  • 17.
    Criticality Measurement -HANSA’s Approach Let the customer specify how ‘Critical’ (not just important) is a dimension to him in keeping a relationship going – in the context of the service CRITICALITY MEASUREMENT : This is an extremely important dimension and if some other company delivers beyond my expectation on this dimension, I will definitely switch to the product of that company This is a very important dimension and if some other company delivers beyond my expectation on this dimension, I will probably switch to the product of that company This is an important dimension, but even if some other company delivers beyond my expectation on this dimension, I may not switch to the product of that company This is not so important dimension, and even if some other company delivers beyond my expectation on this dimension, I will definitely not switch to the product of that company 4 3 2 1 17
  • 18.
    Performance x Criticality= ACT WINDOW PERFORMANCE High Analyze to see if these have been over invested in Low priority areas - tackle later Maintain Key action areas Low Low CRITICALITY High 18
  • 19.
  • 20.
    ACT DETAILED SCORECARD - The ACT Blue Print© The ACT Blue Print that has the following components: I. Executive Summary II. Customer Satisfaction I. Turnaround Time II. Overall Customer Satisfaction I. II. For customers Across various dimensions of service delivery (Time taken, Competence, Impression etc.) III. Relative Criticality IV. ACT Actionable Window - Criticality vs. Performance III. Diagnostics into customer satisfaction I. Reasons for Satisfaction / Dissatisfaction II. Likes / Dislikes with relevant dimensions III. Dimensions in service delivery that need improvement IV. How can delivery on service dimensions be improved? IV. Action Plan to improve satisfaction among customer segments 20
  • 21.
    REPORT CARD -Turnaround Time ING Vysya vs. Bank 1 ING Vysya vs. Bank 2 ING Vysya vs. Bank 3 ING Vysya vs. Bank 4 Savings A/c ++ ++ -- + Current A/c = -- ++ = Business Loan - = - - Car Loan + + - + Customer Complaint + = - = “++” indicates “significantly lower turnaround time” “--” indicates “significantly higher turnaround time” “+” indicates “directionally lower turnaround time” “-” indicates “directionally higher turnaround time” “=” indicates “significantly lower turnaround time” 21
  • 22.
    TURNAROUND TIME -In Days ING Vysya Bank 1 Bank 2 Bank 3 Bank 4 Actual TA time (Mean) 4.8 3.4 5.4 4.6 6.7 Expected TA time (Mean) 4 3 5 4 6 Actual TA time (Mean) 3.5 3.9 6.9 5.5 7.5 Expected TA time (Mean) 4 5 6 5 7 Actual TA time (Mean) 3.6 5.4 5.9 3.8 4.5 Expected TA time (Mean) 3 5 6 3 4 Actual TA time (Mean) 5.2 4.5 8 6.9 5 Expected TA time (Mean) 5 4 6 7 4 Actual TA time (Mean) 1.6 1.3 3.1 3.2 2.5 Expected TA time (Mean) 2 1 2 3 2 Turnaround (TA) time (In Days) Savings A/c Current A/c Business Loan Car Loan Customer Complaint 22
  • 23.
    ING Vysya Bank 1 Bank 2 Bank3 Bank 4 Extremely poor Excellent Bank Name SPEED OF DELIVERY - Savings Account 10 9 37 8 7 6 6 5 22 4 3 2 5 30 5 30 5 30 5 30 5 1 30 Mean - 6.9 37 6 22 Mean - 6.9 37 6 22 Mean - 6.9 37 6 22 Mean - 6.9 37 6 22 Mean - 6.9 23
  • 24.
    ING Vysya Bank 1 Bank 2 Bank3 Bank 4 Extremely poor Excellent Bank Name SPEED OF DELIVERY - Current Account 10 9 37 8 7 6 6 5 22 4 3 2 5 30 5 30 5 30 5 30 5 1 30 Mean - 6.9 37 6 22 Mean - 6.9 37 6 22 Mean - 6.9 37 6 22 Mean - 6.9 37 6 22 Mean - 6.9 24
  • 25.
    ING Vysya Bank 1 Bank 2 Bank3 Bank 4 Extremely poor Excellent Bank Name SPEED OF DELIVERY - Business Loan 10 9 37 8 7 6 6 5 22 4 3 2 5 30 5 30 5 30 5 30 5 1 30 Mean - 6.9 37 6 22 Mean - 6.9 37 6 22 Mean - 6.9 37 6 22 Mean - 6.9 37 6 22 Mean - 6.9 25
  • 26.
    ING Bank 1 Bank 2 Bank3 Bank 4 Extremely poor Excellent Bank Name SPEED OF DELIVERY - Car Loan 10 9 37 8 7 6 6 5 22 4 3 2 5 30 5 30 5 30 5 30 5 1 30 Mean - 6.9 37 6 22 Mean - 6.9 37 6 22 Mean - 6.9 37 6 22 Mean - 6.9 37 6 22 Mean - 6.9 26
  • 27.
    ING Vysya Bank 1 Bank 2 Bank3 Bank 4 Extremely poor Excellent Bank Name SPEED OF SOLVING - Customer Complaint 10 9 37 8 7 6 6 5 22 4 3 2 5 30 5 30 5 30 5 30 5 1 30 Mean - 6.9 37 6 22 Mean - 6.9 37 6 22 Mean - 6.9 37 6 22 Mean - 6.9 37 6 22 Mean - 6.9 27
  • 28.
  • 29.
    Quality Control • Hansa Researchmeets or exceeds industry standards for quality control in data collection and data processing. The following steps would be taken to ensure quality control: – Fieldwork would be carried out by teams of interviewers trained by Hansa researchers and senior field staff. – A centralized briefing of our full data collection team would be organized on the goals and specifications of a project before data collection. – Daily contact with researchers during the fieldwork process. – 25% of all interviewed would be back checked – 10% of all interviews would be accompanied – 100% of all questionnaires would be scrutinized 29
  • 30.
  • 31.
    Time Option 1 -City wise Option 2 - Zone wise Questionnaire Design 1 week 1 week Field Material Preparation and Briefing 1 week 1 week Field Work 2 weeks 1 ½ weeks Tabulation and Analysis 1 week 1 week Report Preparation 1 week 1 week 6 weeks 5 ½ weeks TOTAL Time 31
  • 32.
    Cost Option 1 -City wise Option 2 - Zone wise SMB 10,92,000 5,20,000 Individual 7,51,000 3,60,000 TOTAL 18,43,000 8,80,000 • The costs given above do not include the mandatory service tax component of 10.36% payable to the Government of India • Payment terms and conditions – 50% advance at the stage of project commissioning – 50% balance on presentation of findings 32
  • 33.
  • 34.
    Customer Satisfaction Survey:Branch (Liability) • Objective: To capture customer feedback for the services offered at branches. • Methodology: Information is captured using a self-administered feedback form. • Scope: Services are monitored at around 390 branches spread across 188 cities of India • Frequency: Continuous track (initiated in Dec 2003) where each branch is monitored twice in a month and the data is reported on fortnightly basis. • Reporting: The data is reported by branch, city, cluster, region, zone and also by different service parameters ( for instance, soft skills, waiting time etc) – Data reported on fifth day from fieldwork 34
  • 35.
    Customer Satisfaction Survey:Phone Banking • Objective: To capture customer feedback for the services offered at Phone Banking Channel. • Methodology: Online survey where after seeking customer’s approval, the call is transferred to the Research Officer who then captures customer’s feedback on today’s experience. The data is captured on a website and gets automatically saved on HRG’s server. • Frequency: Continuous track where the data is captured on daily basis. The data is analyzed and reported on weekly basis. • Reporting: The data is reported by location (Mumbai, Hyderabad), skill (for instance, credit card, loans etc), team leaders, etc and also by different service parameters ( for instance, soft skills, waiting time etc) 35
  • 36.
    Customer Satisfaction Survey:Email • Objective: To capture customer feedback on his experience on query resolution via Email Channel. • Methodology: A customer may raise a query to the client via Email. The query then gets transferred to different teams depending on the product or which the query has been raised. Along with the resolution, goes a link where customer is requested to submit his responses regarding his experiences on the query resolution process. The data then gets automatically saved on HRG’s server. • Frequency: Continuous track where the data is captured on daily basis. The data is analyzed and reported on weekly basis • Reporting: The data is reported separately for each product (for instance, credit card, private banking, loans, FDs etc) 36
  • 37.
    Service Quality Survey:Initial Interaction Experience • Objective: To capture customer feedback on his experience on the initial interaction with the bank • Methodology: During the initial interaction with the bank, a customer gets a welcome kit (across all the products and services). The kit along with other documents, also contains a Business Reply Envelope (BRE) asking the customer to submit his responses with respect to his experiences on the initial interaction with the bank. • Frequency: Continuous track • Reporting: The data is analyzed and reported separately for each product (for instance, credit card, savings account, loans, etc) 37
  • 38.
    Customer Satisfaction Survey • Objective:To assess satisfaction using Hansa’s proprietary ACT model – Factoring in criticality of individual dimensions across all interaction points – Assessed against customers’ expectation – Benchmarked across competition • Methodology :Respondents selected from database provided by client following systematic random sampling, sorting by size of relationship. For benchmarking competition customers selected purposively. • Sample size: 9000 covered across 32 cities • Products and Services covered in the study: – Savings Account, Salary Account, Current Account – Credit Cards – Home Loan, Car Loan, Personal Loan, Commercial Vehicle Loan and Two Wheeler Loan 38
  • 39.
  • 40.
    Anuradha Roy Chowdhury SeniorVice President and Head of Hansa Tech Hansa Research Group, Bangalore Anuradha Roy Chowdhury heads Hansa Tech, the Technology research business of Hansa Research. She has about 20 years of experience in all areas of Market Research including Customer Satisfaction Research, Brand Health Measurement and monitoring, Advertising Research, Concept and Product Tests, Corporate Image Measurement. Post launch evaluation, Pricing research, Baseline market studies, Demand estimations, Industry/Category studies and Database building. This experience spans diverse categories and verticals … including Technology, FMCG, Durables and Retail. Anuradha has considerable experience in different data collection methodologies, including face to face, telephone and Online. She has worked on data from a range of countries, including both developed markets such as the US and UK, and developing ones such as India, Malaysia, China and Turkey. Anuradha has a Masters degree in Research and Evaluation Methodology from Utah State University. She was with ACNielsen ORG-Marg for 15 years prior to joining Hansa Research, where she help positions such as Head - Branded Products, Head – Claritas Micromarketing and Head – Tobacco Business 40
  • 41.
    Sonakshi Singh Associate ResearchDirector Hansa Research Group, Bangalore Sonakshi Singh has around 4 years of research experience in Quantitative research. During this period, she has executed and managed projects of varying sizes across a number of categories. She has handled projects across a wide stream of verticals such as FMCG, beverages, finance and IT Also, she has experience in conducting and managing an array of customised and syndicated research studies … to name a few  Product tests, Catchment area profiling, Advertisement concept tests, Pricing research, Satisfaction measurement, Market sizing and Syndicated research. Sonakshi has considerable experience in different data collection methodologies, including face to face, telephone and Online. She has worked on data from a range of countries, including both developed markets such as the US and UK, and developing ones such as India, Malaysia, China and Turkey. Sonakshi has a post graduate degree in business administration 41
  • 42.
    Gurpreet Singh Aulakh SeniorResearch Executive Hansa Research Group, Bangalore Gurpreet Singh has around 3 years of research experience in Quantitative research. During this period, he has executed and managed projects of varying sizes across a number of categories. This experience spans diverse categories and verticals such as Technology, FMCG, Alcoholic beverages, Retail, and Durables. Also, he has experience in conducting and managing an array of customised and syndicated research studies … to name a few  Product tests, Catchment area profiling, Advertisement concept tests, Pricing research, Satisfaction measurement, Market sizing and Syndicated research. Gurpreet has considerable experience in different data collection methodologies, including face to face, telephone and Online. He has worked on data from a range of countries, including both developed markets such as the US and UK, and developing ones such as India, Malaysia, China and Turkey. Gurpreet has a bachelors degree in electronics and communication engineering and a post graduate degree in business administration. 42
  • 43.
    CH Jagadish Senior ResearchExecutive Hansa Research Group, Bangalore Jagadish currently works with Hansa Tech, the Technology research business of Hansa Research. He has 2 years of research experience in Quantitative research. During this period, he has executed and managed projects of varying sizes across a number of categories. This experience spans diverse categories and verticals such as Technology, Alcoholic beverages, Retail, and Durables. Also, he has experience in conducting and managing an array of customised and syndicated research studies … to name a few  Product tests, Catchment area profiling, Advertisement concept tests, Satisfaction measurement and Syndicated research. Jagadish has considerable experience in different data collection methodologies, including face to face, telephone and Online. He has worked on data from a range of countries, including both developed markets such as the US and UK, and developing ones such as India, Malaysia, China and Turkey. Jagadish has a Master’s degree in Business Administration from ICFAI Business School, Chennai and a Bachelor’s degree in Pharmacy from JNTU, Hyderabad. 43
  • 44.
    ANALYSIS Swati D. Satam AnalysisManager Hansa Research Group, Mumbai Swati Satam heads the Analysis Dept. of Hansa Research, Mumbai. She is involved in several aspects of analysis engagements including setting up the analysis of projects, using software’s like Quantum/SPSS, Job allocation & Monitoring, Recruitment & Training, and delivery of Quality outputs within given time . In the span of 12 years in Analysis, she has garnered considerable experience in projects from all industries, including Media, Pharma, Financial Services, and Telecom & Industrial Products. She has honed the skills of handling large volume of data & analysed data for any type of interview including Pen & Paper, online / web based, CATI and CAPI. She has hands on studies like syndicated studies, Brand Scan, product testing, Readership survey, Outdoor. In addition, she has exposure to an array of statistical tools like Cluster, Factor, Regression, Correlation, Conjoint, Correspondence, MDPref, BPTO, Jaccard and CHAID Swati has a Masters degree in Statistics from Mumbai University & a Diploma in Computer programming & systems analysis. She has worked with IMRB, Ugam Solutions & ACNielsen ORG-Marg for about 6 years prior to joining Hansa Research 44