This document provides instructions and questions for a CTE Math Assessment with two parts:
1) A short answer section with 7 math word problems involving money, time, area, percentages, and setting up and solving equations.
2) A performance assessment section requiring using a computer, measuring tools, and materials to complete 3 math-related tasks: writing a memo estimating costs for a summer camp, creating an invoice for marketing services, and measuring and cutting 6 strings to specified lengths using different units of measurement.
Instructions This is an open-book exam. You may refer to you.docxdirkrplav
Instructions:
This is an open-book exam. You may refer to your text and other course materials as you work on the exam, and you may use a calculator.
Record your answers and work in this document.
There are 25 problems.
Problems #1-12 are multiple choice. Record your choice for each problem.
Problems #13-15 are short answer. Record your answer for each problem.
Problems #16-25 are short answer with work required when directed. When requested, show all work and write all answers in the spaces allotted on the following pages. You may type your work using plain-text formatting or an equation editor, or you may hand-write your work and scan it. In either case, show work neatly and correctly, following standard mathematical conventions. Each step should follow clearly and completely from the previous step. If necessary, you may attach extra pages.
MULTIPLE CHOICE. Record your answer choices.
1.7.
2.8.
3.9.
4.10.
5.11.
6.12.
SHORT ANSWER. Record your answers below.
13. (a)
(b)
(c)
(d)
14. (a)
(b)
(c)
15. (a)
(b)
(c)
SHORT ANSWER with Work Shown. Record your answers and work.
Problem Number
Solution
16
Answers:
(a)
(b)
(c)
Work for (a), (b), and (c):
17
Answer:
Work:
18
Answer:
Work:
19
Answers:
(a)
(b)
(c)
Work for (a) and (b):
20
Answer:
Work:
21
Answer:
Work:
22
Answer:
Work:
23
Answers:
(a)
(b)
(c)
(d)
Work for (b), (c), and (d):
24
Answer:
Work:
25
Answers:
(a)
(b) Region I:
Region II:
Region III:
Region IV:
Work:
MATH 106 Finite Mathematics 2148-OL4-7983-3D
Page 1 of 10
MATH 106 FINAL EXAMINATION
This is an open-book exam. You may refer to your text and other course materials as you work
on the exam, and you may use a calculator. You must complete the exam individually.
Neither collaboration nor consultation with others is allowed. Use of instructors’ solutions
manuals or online problem solving services in NOT allowed.
Record your answers and work on the separate answer sheet provided.
There are 25 problems.
Problems #1–12 are Multiple Choice.
Problems #13–15 are Short Answer. (Work not required to be shown)
Problems #16–25 are Short Answer with work required to be shown.
MULTIPLE CHOICE
1. – 2. Amalgamated Furniture Company makes dining room tables and chairs. A table requires
8 labor-hours for assembling and 2 labor-hours for finishing. A chair requires 2 labor-hours for
assembly and 1 labor-hour for finishing. The maximum labor-hours available per day for
assembling and finishing are 400 and 120, respectively. Production costs are $600 per table and
$150 per chair. Let x represent number of tables and y represent number of chairs made per day.
1. Identify the daily production constraint for finishing:
.
Statement of Operations and Financial StatementsSubmit written r.docxwhitneyleman54422
Statement of Operations and Financial Statements
Submit written responses to these questions.
This assignment needs to be in APA style, plagiarism free, and each to understand.
1. List several efforts that have been enacted by payors to control costs.
2. Explain the ramifications of allowing/disallowing an individual to be able to sue his or her HMO.
3. What are each of the financial statements commonly called in for-profit health care organizations and in not for-profit care organizations?
The following questions relate to the statement of operations of not for-profit health care organizations.
1. What is the analogous for-profit statement called? What are the main sections of the statement of operations?
2. What are revenues, gains, and other support?
3. What are expenses and losses?
4. Funds released from restricted net assets to unrestricted net assets are presented in what section of the statement of revenue, expenses and other activities?
The following questions relate to the statement of changes in net assets.
1. What is the traditional name for this statement?
2. What is the purpose of this statement?
3. What are the main sections of this statement?
4. Discuss the difference between permanently restricted and temporarily restricted net assets.
The following questions relate to the statement of cash flows of a not-profit health care organization.
1. What are its main sections?
2. What is the purpose of this statement?
3. Where in the financial statements would there be important explanatory information?
4. In what financial statement would one identify the purchase of long-term investments?
5. How does the accrual basis of accounting differ from the cash basis of accounting?
1
Foundations of Technical Programming
ASSIGNMENT (25%)
Q.1 Computers are often used for data analysis to compile and analyze the results of
surveys and opinion polls. You are asked to write a complete C program to use array
response initialized with 99 responses to a survey. Each response is a number from
1 to 9. The program computes the mean, median and mode of the 99 values. In your
program, you need to
(i) Define a function mean() to compute the mean by totalling 99 elements and
dividing the result by 99.
(ii) Define a function median(), to determine the median, that sorts the array of
responses into ascending order, then picking the middle element of the
sorted array.
(iii) Define a function mode() to determine the mode by counting the number of
responses of each type then selecting the value with the greatest count.
(iv) Print out the responses, frequencies and the corresponding histogram.
The following shows the sample run of your program:
The unsorted array of responses is
7875616546578352447
87987869874649352765
35798989872989787876
98798989877878939876
87878959879898789876
The sorted array is
9999999999999999999
88888888888888888888
88888887777777777777
77777777776666666665
55555554444433332.
BUSI 331Marketing Research Report Part 3 InstructionsData .docxhumphrieskalyn
BUSI 331
Marketing Research Report Part 3 Instructions
Data Submission
Review the Basic Data Analysis section in the Zikmund & Babin text and the presentation from Module/Week 4, Presentation: Using Excel for Data Analysis. There will be 2 submissions in this assignment: the Excel document with the raw data that includes a code guide and the Marketing Research Report as a continuation of your Part 1 Word document.
1. Submit the raw data from your survey results in an Excel document. To do this, you will need to build an Excel spreadsheet to organize your data. You may find that Survey Monkey or other online survey tools will already do this for you.
2. In order to get the best results from your data analysis, you will need to code your responses that are not already numerical. For example, if your question asked if the respondent was male or female, male=0, and female=1. If it was yes or no question, yes=0, no=1. Please include a code guide with your raw data.
Your Excel document submission is your raw data with a code chart to clarify what the raw numbers stand for. Please note that raw data is numerical and the data has not been manipulated in any way. You can post the Code Guide in Sheet 2 of your Excel document if that is easier for you. As an example, your raw data and code guide will look like this:
Respondent
Gender
Age
Q1
1
1
1
1
2
1
2
4
3
2
3
3
4
2
2
5
5
1
3
2
Code Guide:
Gender: 1=male, 2=female
Age Range: 1=18-24, 2=25-30, etc.
Q1 (5 point likert scale): 1=very unlikely, 2=unlikely, 3=neutral, etc.
3. Submit 3 tables that were created in Excel from your data, inclusive of 1 frequency table and 2 cross-tabulation tables. This needs to be relevant information that will directly impact your research problem. Please write 1 comprehensive paragraph underneath each individual table that clearly describes what the table is showing and what the inferences are from this table and information in relation to the research problem. Turn at least 1 of your tables into a graph (either a bar or pie chart) to show the data from the table. Place this material (three charts/tables and three written discussions of each) as Appendix 2 in your research report, and submit this part as a compilation with your Parts 1 and 2.
This assignment is due by 11:59 p.m. (ET) on Monday of Module/Week 6.
Show all your work neatly for full credit.
1) Solve the differential equations:
2) Compute the solution of the given initial value problem.
3) For the equation
a) determine the frequency of the beats.
b) determine the frequency of the rapid oscillations.
c) Use the informayion from parts a) and b) to give a rough sketch of the graph of a typical solution.
4) Consider the equation
a) Compute the general solution.
a)
Solve the initial value problem
...
Read| The latest issue of The Challenger is here! We are thrilled to announce that our school paper has qualified for the NATIONAL SCHOOLS PRESS CONFERENCE (NSPC) 2024. Thank you for your unwavering support and trust. Dive into the stories that made us stand out!
A Strategic Approach: GenAI in EducationPeter Windle
Artificial Intelligence (AI) technologies such as Generative AI, Image Generators and Large Language Models have had a dramatic impact on teaching, learning and assessment over the past 18 months. The most immediate threat AI posed was to Academic Integrity with Higher Education Institutes (HEIs) focusing their efforts on combating the use of GenAI in assessment. Guidelines were developed for staff and students, policies put in place too. Innovative educators have forged paths in the use of Generative AI for teaching, learning and assessments leading to pockets of transformation springing up across HEIs, often with little or no top-down guidance, support or direction.
This Gasta posits a strategic approach to integrating AI into HEIs to prepare staff, students and the curriculum for an evolving world and workplace. We will highlight the advantages of working with these technologies beyond the realm of teaching, learning and assessment by considering prompt engineering skills, industry impact, curriculum changes, and the need for staff upskilling. In contrast, not engaging strategically with Generative AI poses risks, including falling behind peers, missed opportunities and failing to ensure our graduates remain employable. The rapid evolution of AI technologies necessitates a proactive and strategic approach if we are to remain relevant.
Embracing GenAI - A Strategic ImperativePeter Windle
Artificial Intelligence (AI) technologies such as Generative AI, Image Generators and Large Language Models have had a dramatic impact on teaching, learning and assessment over the past 18 months. The most immediate threat AI posed was to Academic Integrity with Higher Education Institutes (HEIs) focusing their efforts on combating the use of GenAI in assessment. Guidelines were developed for staff and students, policies put in place too. Innovative educators have forged paths in the use of Generative AI for teaching, learning and assessments leading to pockets of transformation springing up across HEIs, often with little or no top-down guidance, support or direction.
This Gasta posits a strategic approach to integrating AI into HEIs to prepare staff, students and the curriculum for an evolving world and workplace. We will highlight the advantages of working with these technologies beyond the realm of teaching, learning and assessment by considering prompt engineering skills, industry impact, curriculum changes, and the need for staff upskilling. In contrast, not engaging strategically with Generative AI poses risks, including falling behind peers, missed opportunities and failing to ensure our graduates remain employable. The rapid evolution of AI technologies necessitates a proactive and strategic approach if we are to remain relevant.
How to Make a Field invisible in Odoo 17Celine George
It is possible to hide or invisible some fields in odoo. Commonly using “invisible” attribute in the field definition to invisible the fields. This slide will show how to make a field invisible in odoo 17.
Introduction to AI for Nonprofits with Tapp NetworkTechSoup
Dive into the world of AI! Experts Jon Hill and Tareq Monaur will guide you through AI's role in enhancing nonprofit websites and basic marketing strategies, making it easy to understand and apply.
Biological screening of herbal drugs: Introduction and Need for
Phyto-Pharmacological Screening, New Strategies for evaluating
Natural Products, In vitro evaluation techniques for Antioxidants, Antimicrobial and Anticancer drugs. In vivo evaluation techniques
for Anti-inflammatory, Antiulcer, Anticancer, Wound healing, Antidiabetic, Hepatoprotective, Cardio protective, Diuretics and
Antifertility, Toxicity studies as per OECD guidelines
Synthetic Fiber Construction in lab .pptxPavel ( NSTU)
Synthetic fiber production is a fascinating and complex field that blends chemistry, engineering, and environmental science. By understanding these aspects, students can gain a comprehensive view of synthetic fiber production, its impact on society and the environment, and the potential for future innovations. Synthetic fibers play a crucial role in modern society, impacting various aspects of daily life, industry, and the environment. ynthetic fibers are integral to modern life, offering a range of benefits from cost-effectiveness and versatility to innovative applications and performance characteristics. While they pose environmental challenges, ongoing research and development aim to create more sustainable and eco-friendly alternatives. Understanding the importance of synthetic fibers helps in appreciating their role in the economy, industry, and daily life, while also emphasizing the need for sustainable practices and innovation.
1. CTE Math Assessment
Part 1: Short Answer
You may use a scientific calculator (a calculator that has parentheses) for this test. For each
question, use equations, complete sentences, and pictures or charts (where appropriate) to explain
your solution.
1. You receive a gift card for $75 for a local sandwich shop. You always order the same thing,
and the total cost of each lunch is $5.19. How many completely free lunches can you get with
your gift card? How much money will be left on the card?
2. On Monday, you start work at 9:10 AM and finish work at 1:25 PM. Your rate of pay is $10.25
per hour. How much money should you be paid for Monday’s work?
3. You currently pay $700 per month to rent a rectangular office space for your small business.
Your office is 13 yards long and 17 yards wide. You recently heard that a new office complex
is offering space for small businesses at a rate of $4.50 per square foot per year. If you rent
an office in the new complex which is the same size as your current office, what would your
monthly rent be? Would it be worthwhile to move?
4. Tom wants to buy items costing $27.96, $104.25, and $51.17. He earns $6.75 an hour doing
odd jobs. If fifteen percent of his income is put aside for other purposes, how many hours
must he work to earn the money he needs for his purchases?
5. It costs $4.19 for a whole box of Cheerios containing 32 cups of cereal. You use 11
8
of a cup
of Cheerios in your trail mix. What is the cost of the Cheerios that you used in your mix?
6. Create a situation described by 5x + 71 = 366. Include a question whose answer is x. Solve
the problem and explain what your answer means in the context of the problem you wrote.
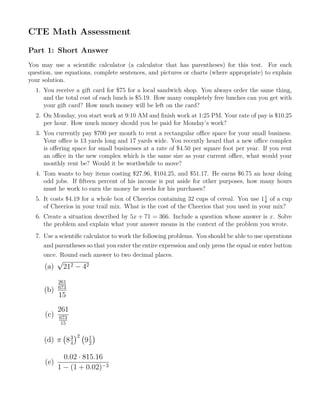
7. Use a scientific calculator to work the following problems. You should be able to use operations
and parentheses so that you enter the entire expression and only press the equal or enter button
once. Round each answer to two decimal places.
(a)
√
212 − 42
(b)
261
673
15
(c)
261
673
15
(d) π
(
83
4
)2 (
91
2
)
(e)
0.02 · 815.16
1 − (1 + 0.02)−3
2. Part 2: Performance Assessments
For this portion of the exam, you will need access to a computer with a spreadsheet, metric and
U. S. customary length measuring devices (meter sticks / yard sticks / tape measures / rulers),
scissors, and string or yarn.
1. Write a Memo. You work for a day care program, and your boss wants you to plan a 2-week
summer day camp for 50 elementary school students. Your cost estimate should include staff
time, meals and snacks, two field trips, and craft and activity supplies for each day.
Write a memo to your boss explaining how much this program will cost. Explain your com-
putations and your answer. How much do you think your day care program should charge for
each student?
2. Create an Invoice. You own an advertising firm, and a new nightclub that is opening
in downtown South Bend has hired you to design a multi-media marketing campaign for
them. Make an invoice that includes at least 5 different ways to advertise their grand opening
weekend. In your spreadsheet, include a column for the service description, the rate for each
service, the quantity of time or items provided, and the subtotal listing the cost of each
service. At the bottom of the spreadsheet, include a total of all items, taxes, and the grand
total. Invent a name and find a clip art logo for your company. Your invoice should also include
a (fictitious) address, phone number, and email address so that your client can contact you
with questions.
3. Measurement Challenge. Measure strings with the lengths indicated below and cut them
to the correct length.
(You should be able to select appropriate measuring tools for each challenge.)
Challenge 1. Length:
5
4
foot
Challenge 2. Length: 16.1 centimeters
Challenge 3. Length: 0.2 meters
Challenge 4. Length 6
7
8
inches
Challenge 5. Length:
2
9
yard
Challenge 6. Length: 76 millimeters