PASSING ACCURACY OF THE SOCCEROOS IN THE 2010 FIFA WOLRD CUP
•
0 likes•259 views

This study used performance analysis to determine the passing accuracy of the Socceroos and how various factors affect the accuracy. The objectives of this study included: •To determine the accuracy of each of the passes performed by Australia. •Define what effect defenders, field position and time in possession had on pass effectiveness. •Determine how the passing accuracy affected the game result.
Recommended

Recommended
More Related Content
Similar to PASSING ACCURACY OF THE SOCCEROOS IN THE 2010 FIFA WOLRD CUP
Similar to PASSING ACCURACY OF THE SOCCEROOS IN THE 2010 FIFA WOLRD CUP (13)
More from Keane Wheeler
Recently uploaded
Recently uploaded (20)
PASSING ACCURACY OF THE SOCCEROOS IN THE 2010 FIFA WOLRD CUP
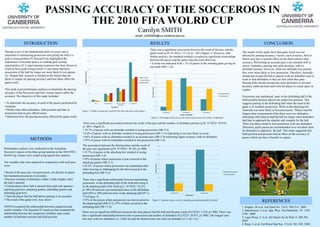
- 1. REFERENCES 1. Hughes, M et al. Jrnl Sport Sci, 23(5): 509-514, 2005 2. Impellizzeri, F et al. App. Phys. Nut.Metabolic. 33: 1192- 1198 , 2008 3. Lago-Penas, C et al. Jrnl Sports Sci & Med, 9: 288-293, 2010 4. Reep, C et al. Jrnl Royal Stat Soc, 131(4): 581-585, 1968 CONCLUSION The results of this study show that game result was not affected by passing accuracy. Factors, such as tactics, skill or fitness may have a greater effect on the final outcome than accuracy. Performing an accurate pass is an essential skill in soccer. Australia’s passing was quite accurate, with no defenders present. However, when one defender was present they were more likely to lose possession. Therefore, Australia should aim to pass the ball to players with no defenders near or work to beat defenders so they are free when they pass. Passing drills should incorporate more defenders to increase accuracy under pressure and work for player to create space in a game. Possession was maintained more in the defending half of the field possibly because players are under less pressure. This suggests passing in the defending half when the need of the game is to maintain possession. When in the attacking box Australia was more likely to lose possession. Players had the longest time in possession when there were two defenders, indicating when players had the ball for longer more defenders had time to approach the attacker and compete for the ball. There was then a trend to lose possession with two defenders. Therefore, quick passes are recommended so to not allow time for defenders to approach the ball. This study suggested that field position and pressure had an effect on the accuracy of passes which can have a benefit in a game. RESULTSINTRODUCTION Passing is one of the fundamental skills of soccer and is important in maintaining possession and getting the ball to a goal scoring position (4). Research has highlighted the importance of accurate passes in creating goal scoring opportunities (2). Longer passing sequences has been shown to result in more goals being scored (1) and teams that have possession of the ball for longer are more likely to win games (3). Despite this, research is limited on the factors that are likely to impact on passing accuracy and how these effect the game result. This study used performance analysis to determine the passing accuracy of the Socceroos and how various factors affect the accuracy. The objectives of this study included: • To determine the accuracy of each of the passes performed by Australia. • Define what effect defenders, field position and time in possession had on pass effectiveness. • Determine how the passing accuracy affected the game result. METHODS Performance analysis was conducted on the Australian Socceroo’s passes in the three group matches at the 2010 FIFA World Cup. Games were coded using lapsed time analysis. The variables that were analysed in conjunction with each pass were: • Result of the pass (out, lost possession, not directly to player but maintains possession or accurate) • Pressure (number of defenders within 2 body lengths when the ball is passed) • Field position where ball is passed from (split into quarters- attacking goal box, attacking quarter, defending quarter and defending goal box) • Time the player had the ball before passing it (in seconds) • The result of the game (win, lose, draw) ANOVA examined the relationship between categorical and scaled variables. Chi Squared (X2) analysis then examined the relationship between the categorical variables; pass result, number of defenders present and field position. Carolyn SMITH The association between the field position and the result of the pass was significant (χ2(9, N=922)= 30.183, p=.000). • 35.7% of passes in the attacking box resulted in losing possession (SR=3.4) • 45% of passes where possession is lost occurred in the attacking quarter (SR=1.5) • 45.2% of passes where possession was maintained after either moving or challenging for the ball occurred in the defending box (SR=2.4) There was a significant relationship between maintaining possession in the defending half of the field and losing it in the attacking half of the field (χ2(1, N=922)= 10.251, p=.001) Possession was maintained more in the defending half (459 vs 299) and lost more in the attacking half (87 vs 77) (Figure 3). • 53% of the passes where possession was lost occurred in the attacking half (SR=2.2), 47% of them occurred in the defending half (SR=-1.9). email: u3025464@uni.canberra.edu.au Figure 1. Number of each pass result for the three outcomes of the games There was a significant association between the result of the pass and the game result (χ2(6, N=922)= 13.114, p= .041) (figure 1). However, after further analysis, the standard residuals revealed no significant relationships between the passes and the game outcome were observed. • A trend was indicated with 1.1% of passes in the winning game giving an out result (SR=-1.6) Figure 3. Summary of pass result in attacking and defending half of the field There was no significant difference between the time players had the ball and the pass result (F(3,922)= 1.214, p=.908). There was also a significant relationship between time in possession and number of defenders (F(2,922)= 20.957, p=.008). The longest time was seen with two defenders (x= 2.0±2.4s) and the shortest time was with one defender (x=1.5± 1.5s). PASSING ACCURACY OF THE SOCCEROOS IN THE 2010 FIFA WOLRD CUP 0 50 100 150 200 250 300 Out Lose possession Work to maintain possession Accurate pass Numberofeachpass Pass Result Game Lost Game Drawn Game Won 0 50 100 150 200 250 300 350 400 450 500 Attacking half Defending half Numberofpasses Field position Maintain possession Lost possession 0 10 20 30 40 50 60 70 80 No Defenders One Defender Two Defenders Percentageofpasses Number of defenders Lost possession Accurate pass Figure 2. Percentage of lost possession and accurate passes for number of defenders There was a significant association between the result of the pass and the number of defenders present (χ2(6, N=922)= 29.918, p<.001) (figure 2). • 70.7% of passes with one defender resulted in losing possession (SR=2.4) • 8.4% of passes with no defender resulted in losing possession (SR=-3.4) indicating it was less likely to occur • 66% of passes with no defenders resulted in an accurate pass (SR=2.0) indicating higher accuracy with no defenders • 25% of passes with two defenders resulted in lost possession (SR=1.6)