Download to read offline


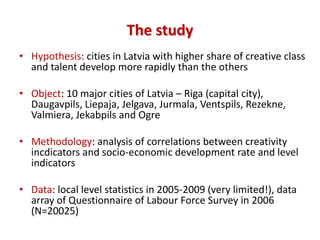
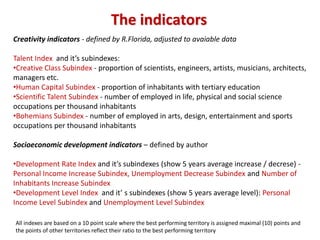


This document summarizes a study on creative cities in Latvia conducted by Alise Vitola. The study examines the relationship between creativity indicators and socioeconomic development rates and levels in 10 major Latvian cities from 2005-2009. The results show that cities with higher shares of creative class and human capital have higher socioeconomic development rates and levels, including higher income levels and lower unemployment. Specifically, cities like Ogre, Riga, and Jurmala scored highest on creativity indicators and have experienced stronger economic growth and development.


![Sg2 Web Seminar 06012007 Emerging Trends In Irf[1]](https://cdn.slidesharecdn.com/ss_thumbnails/Sg2WebSeminar06012007EmergingTrendsinIRF1-123355934675-phpapp02-thumbnail.jpg?width=640&height=640&fit=bounds)


