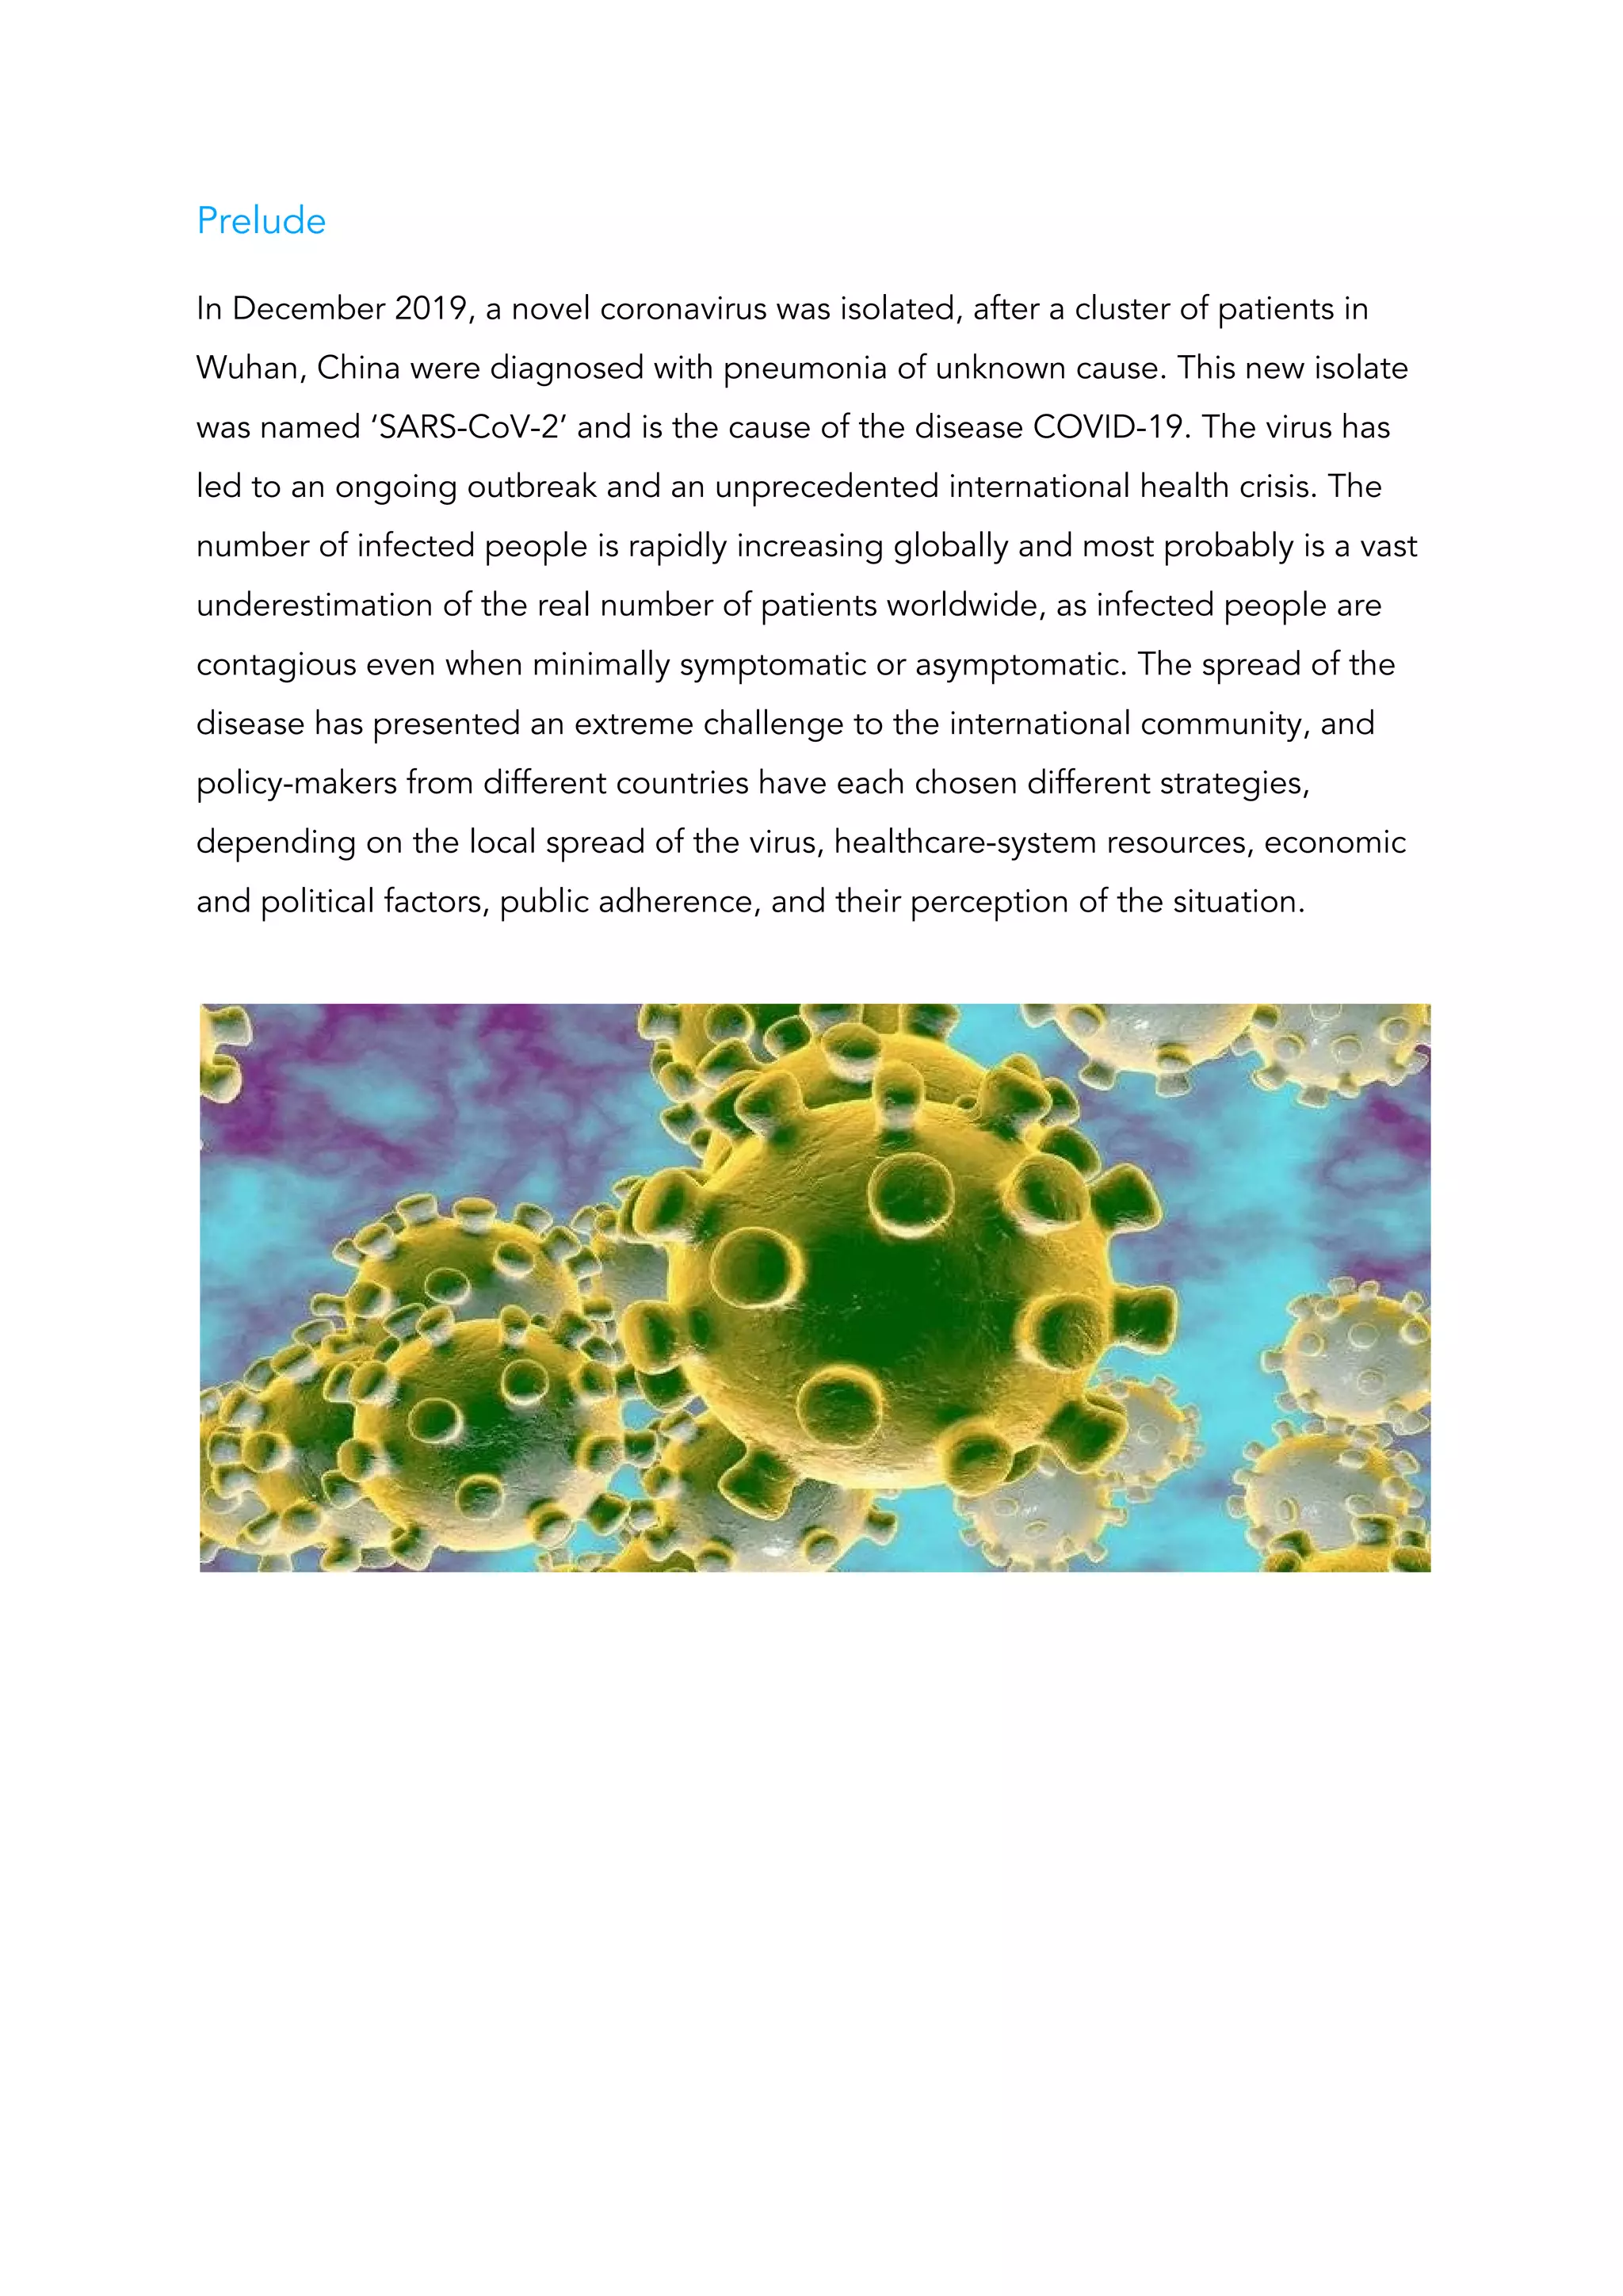
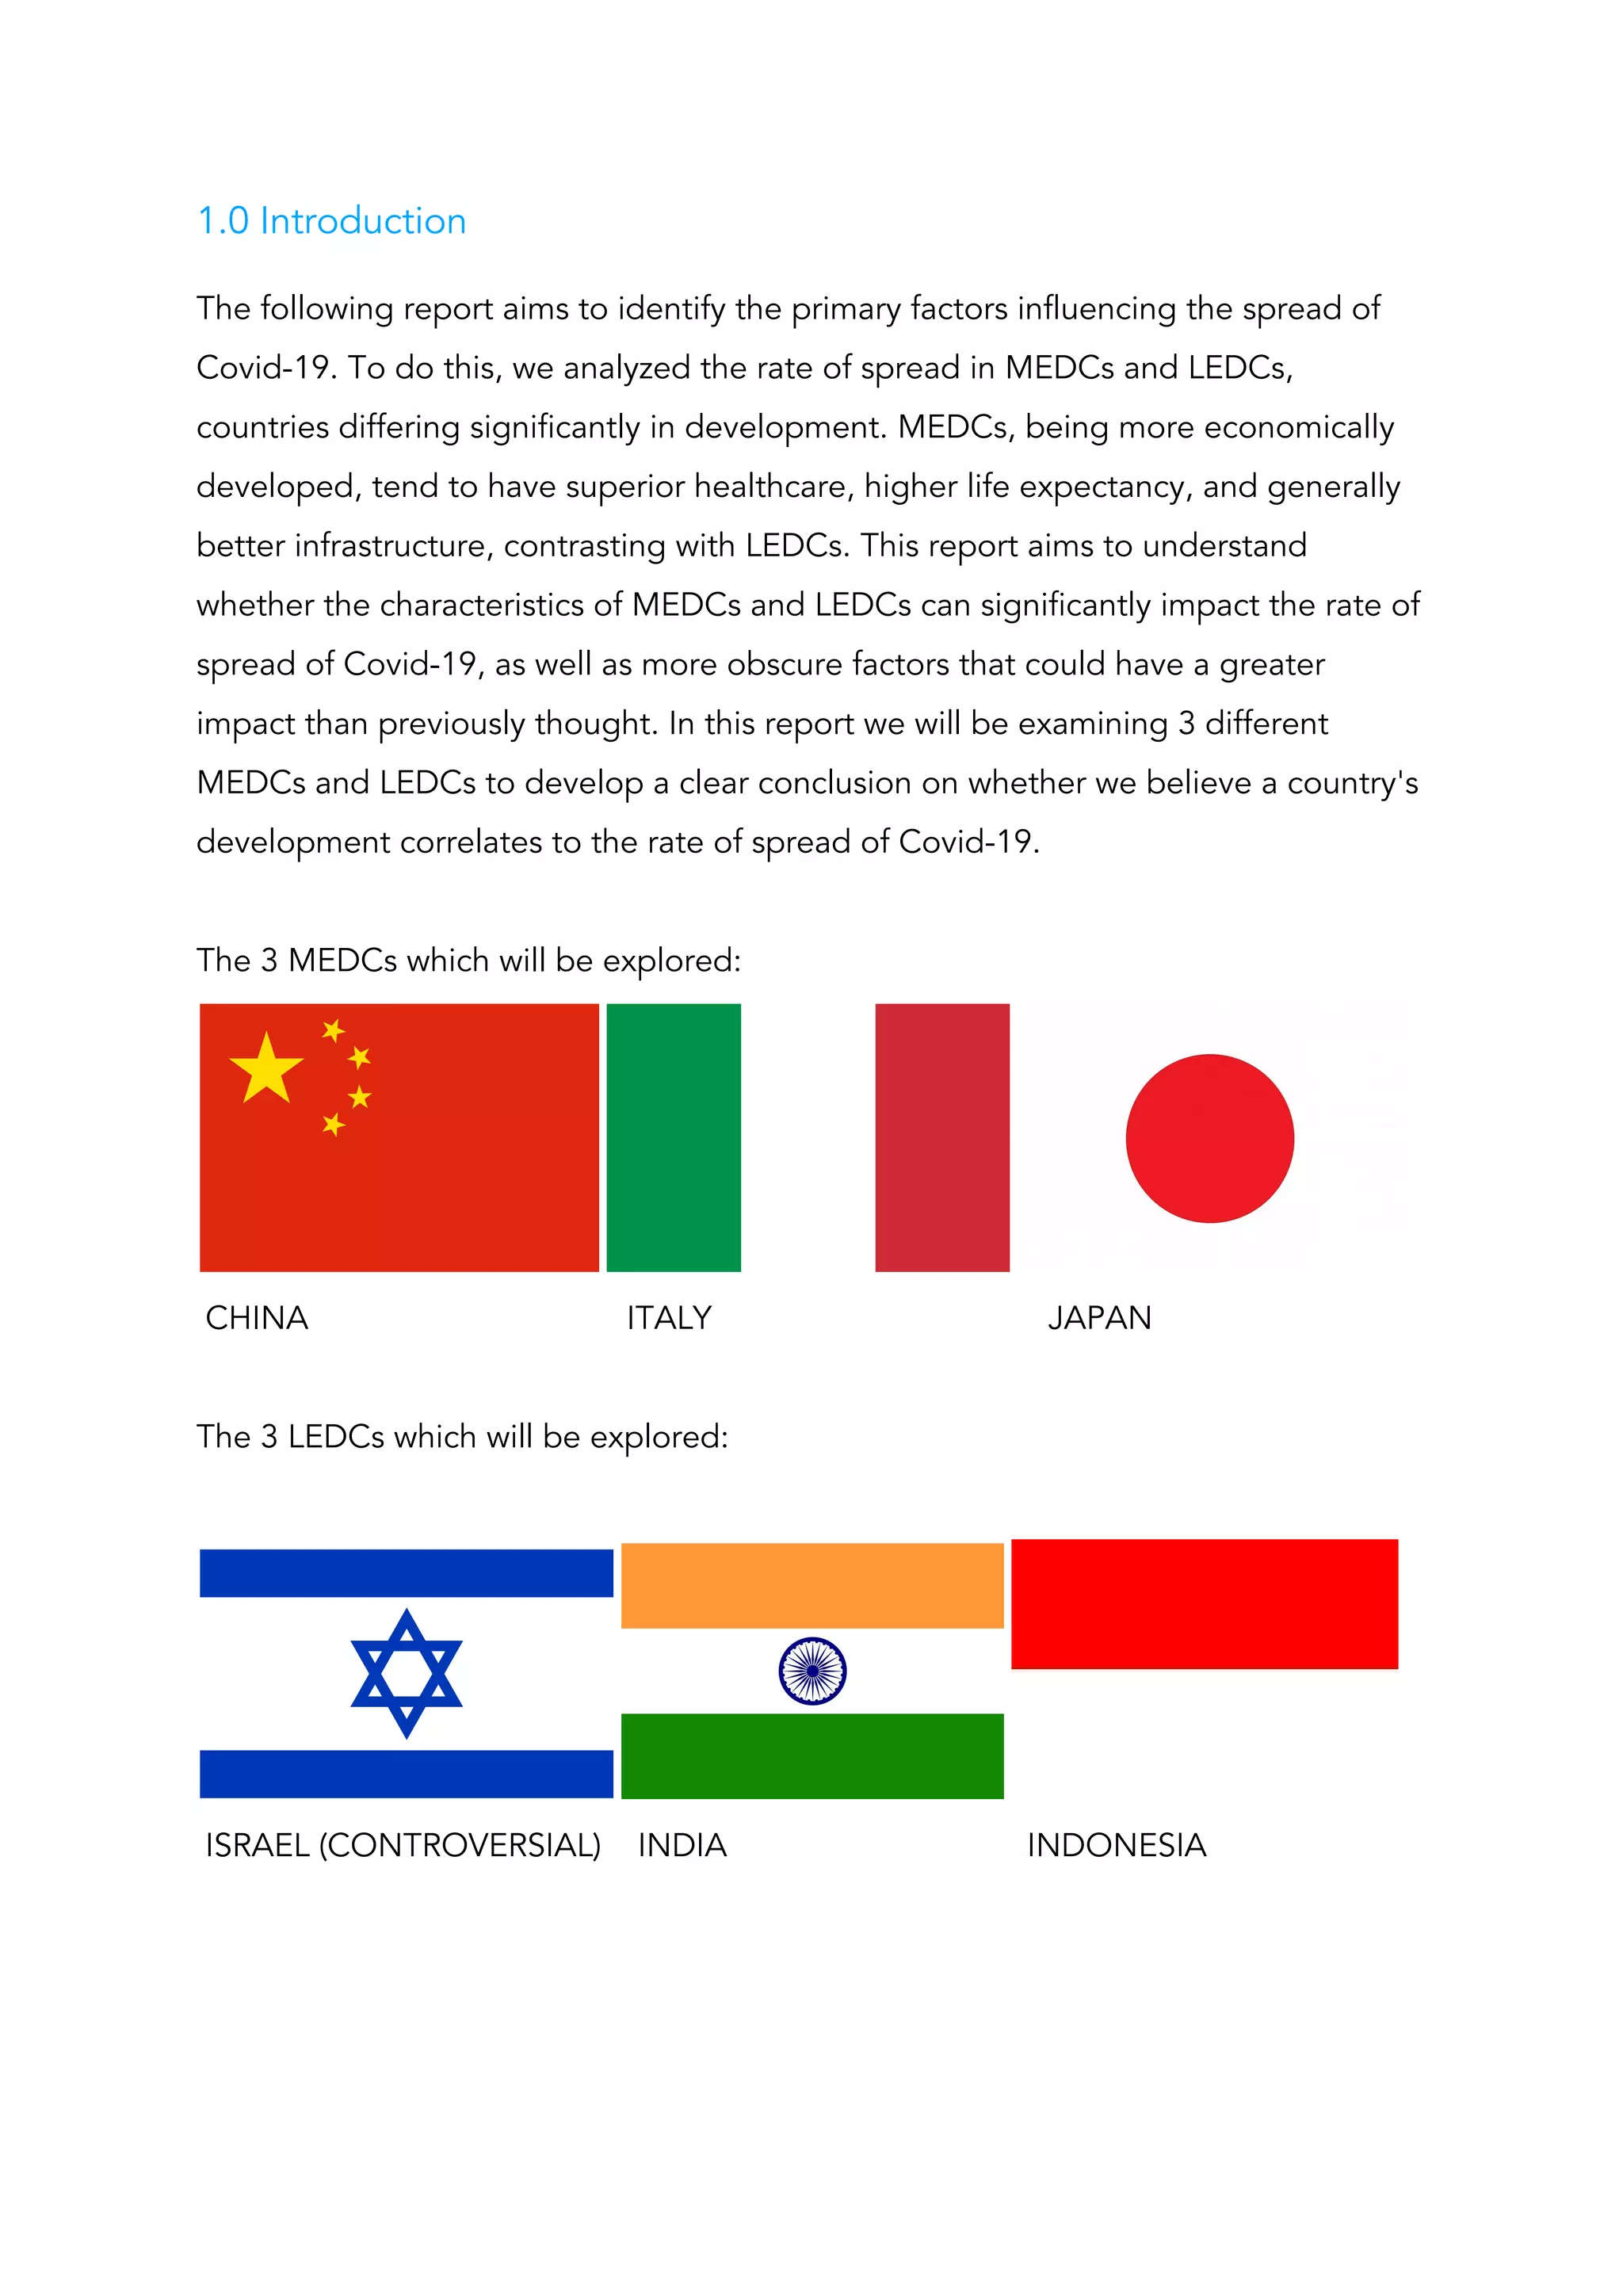
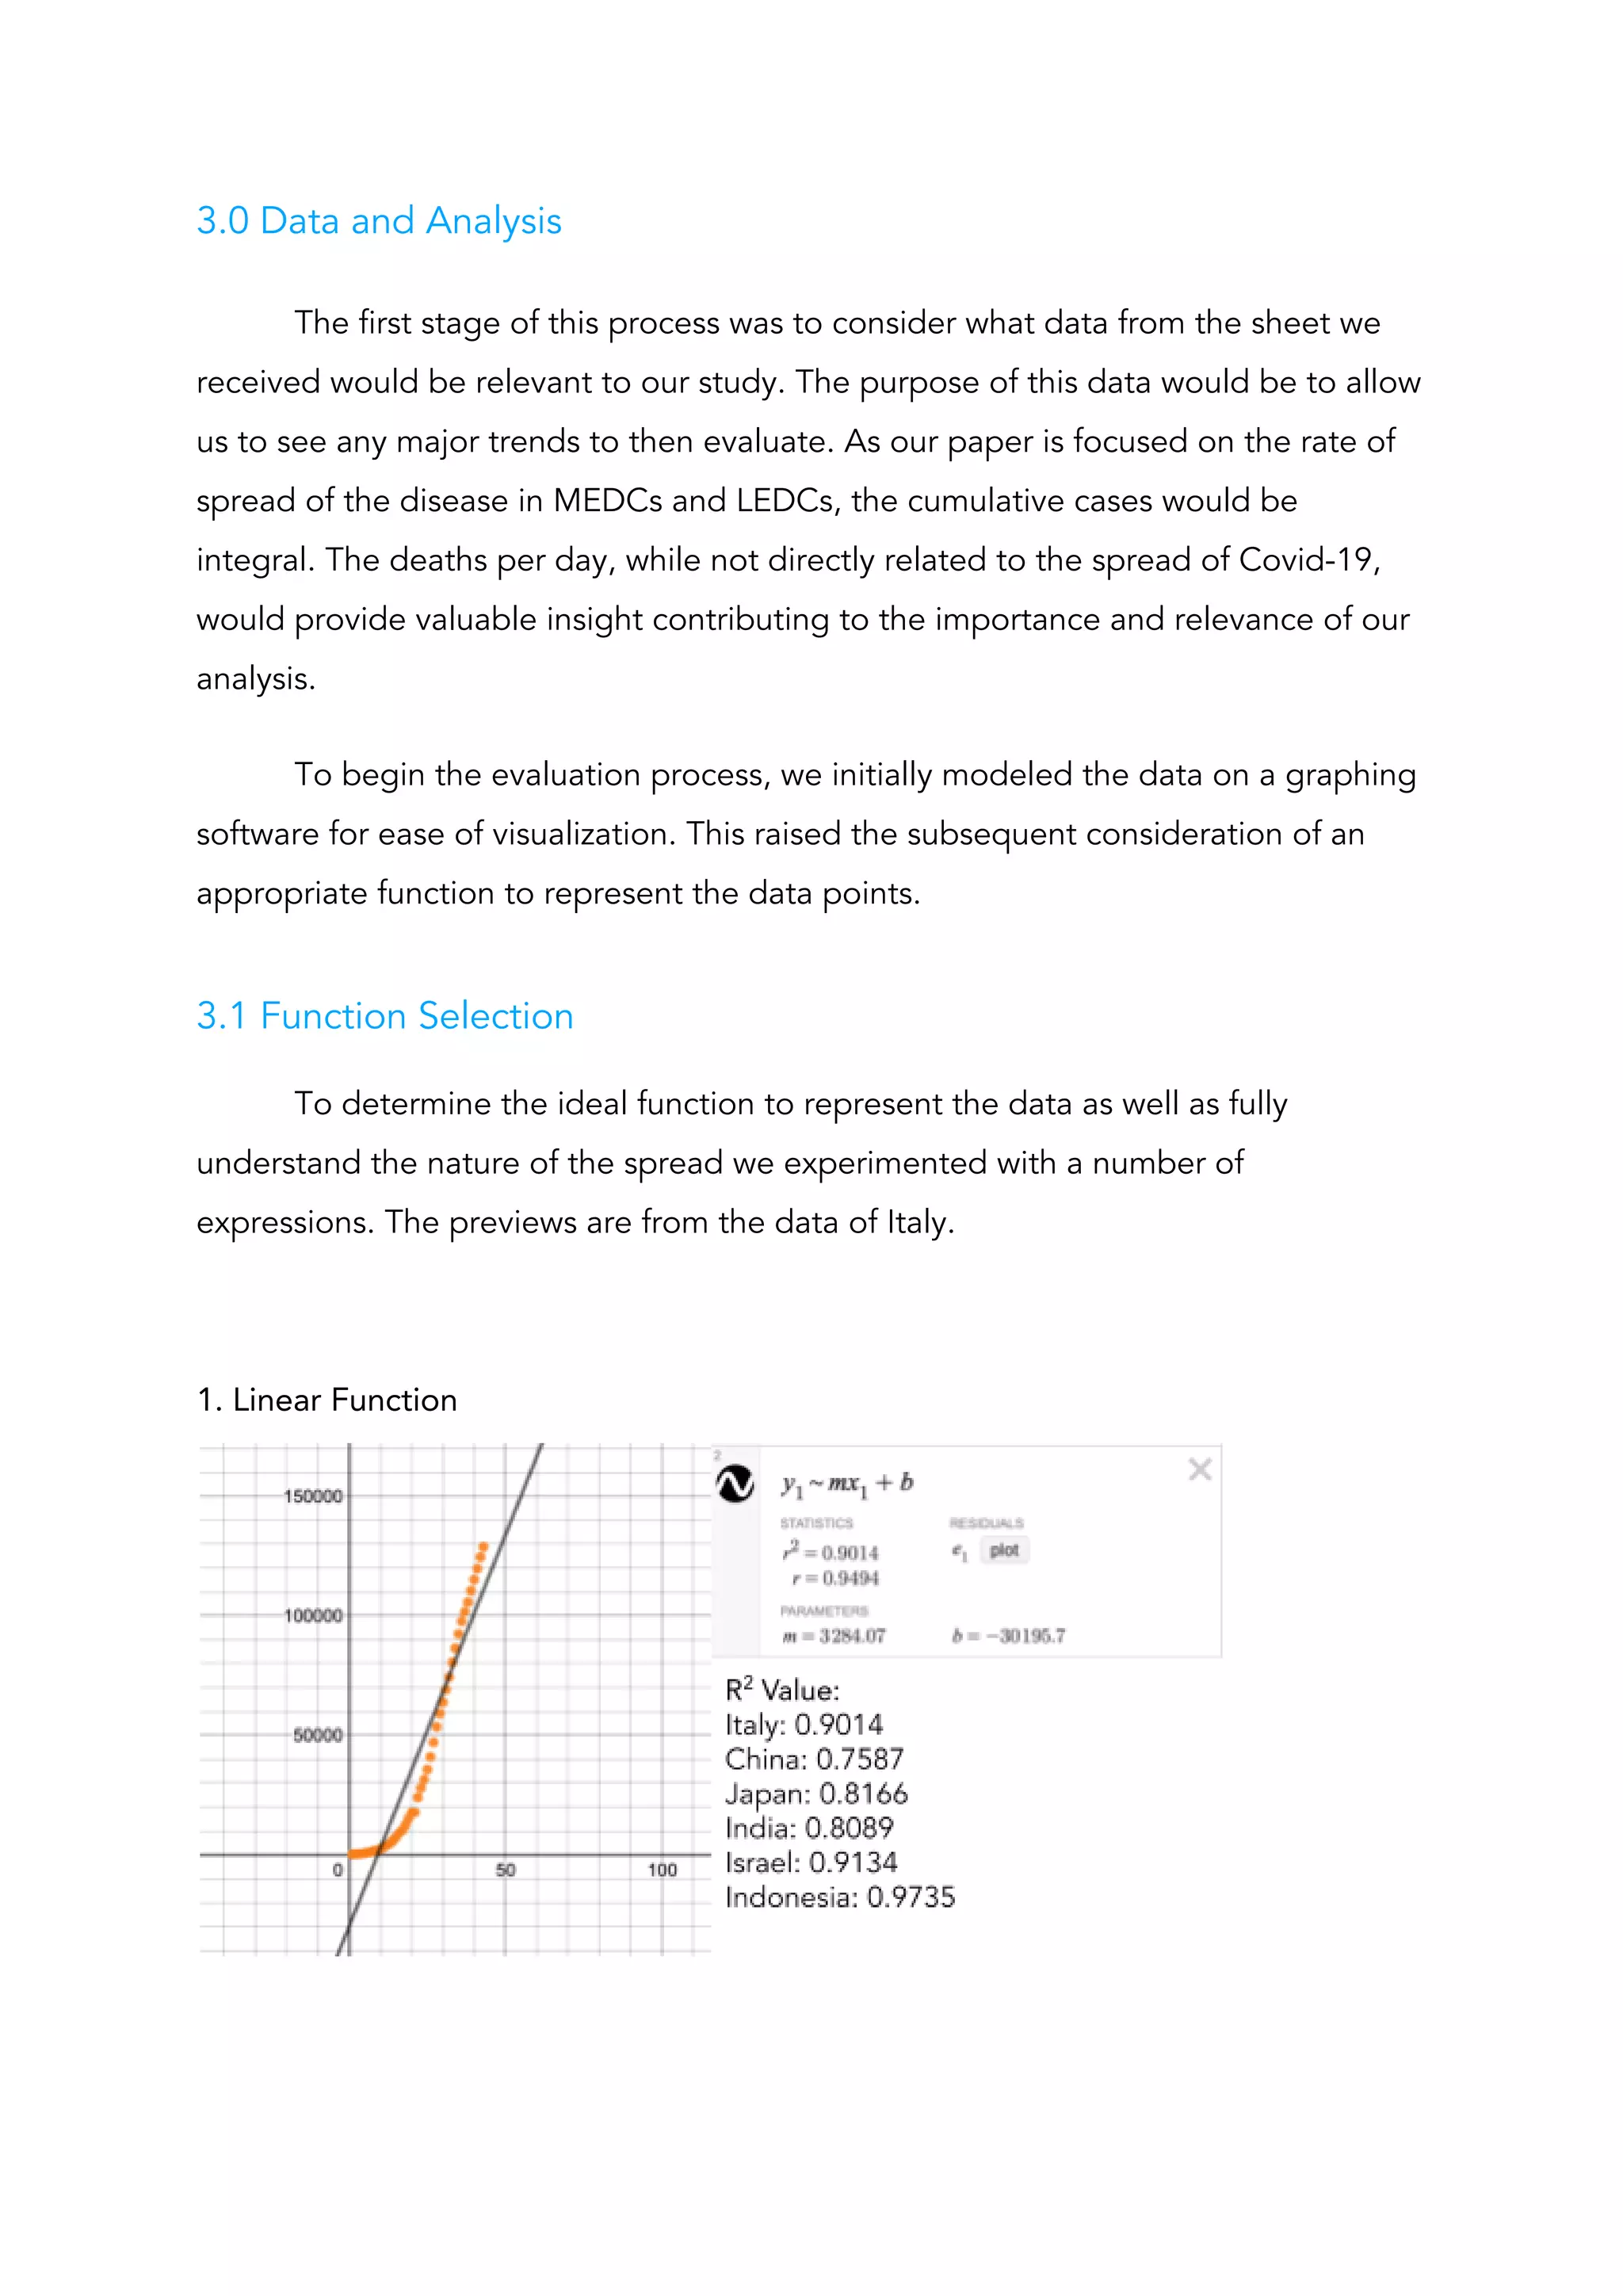
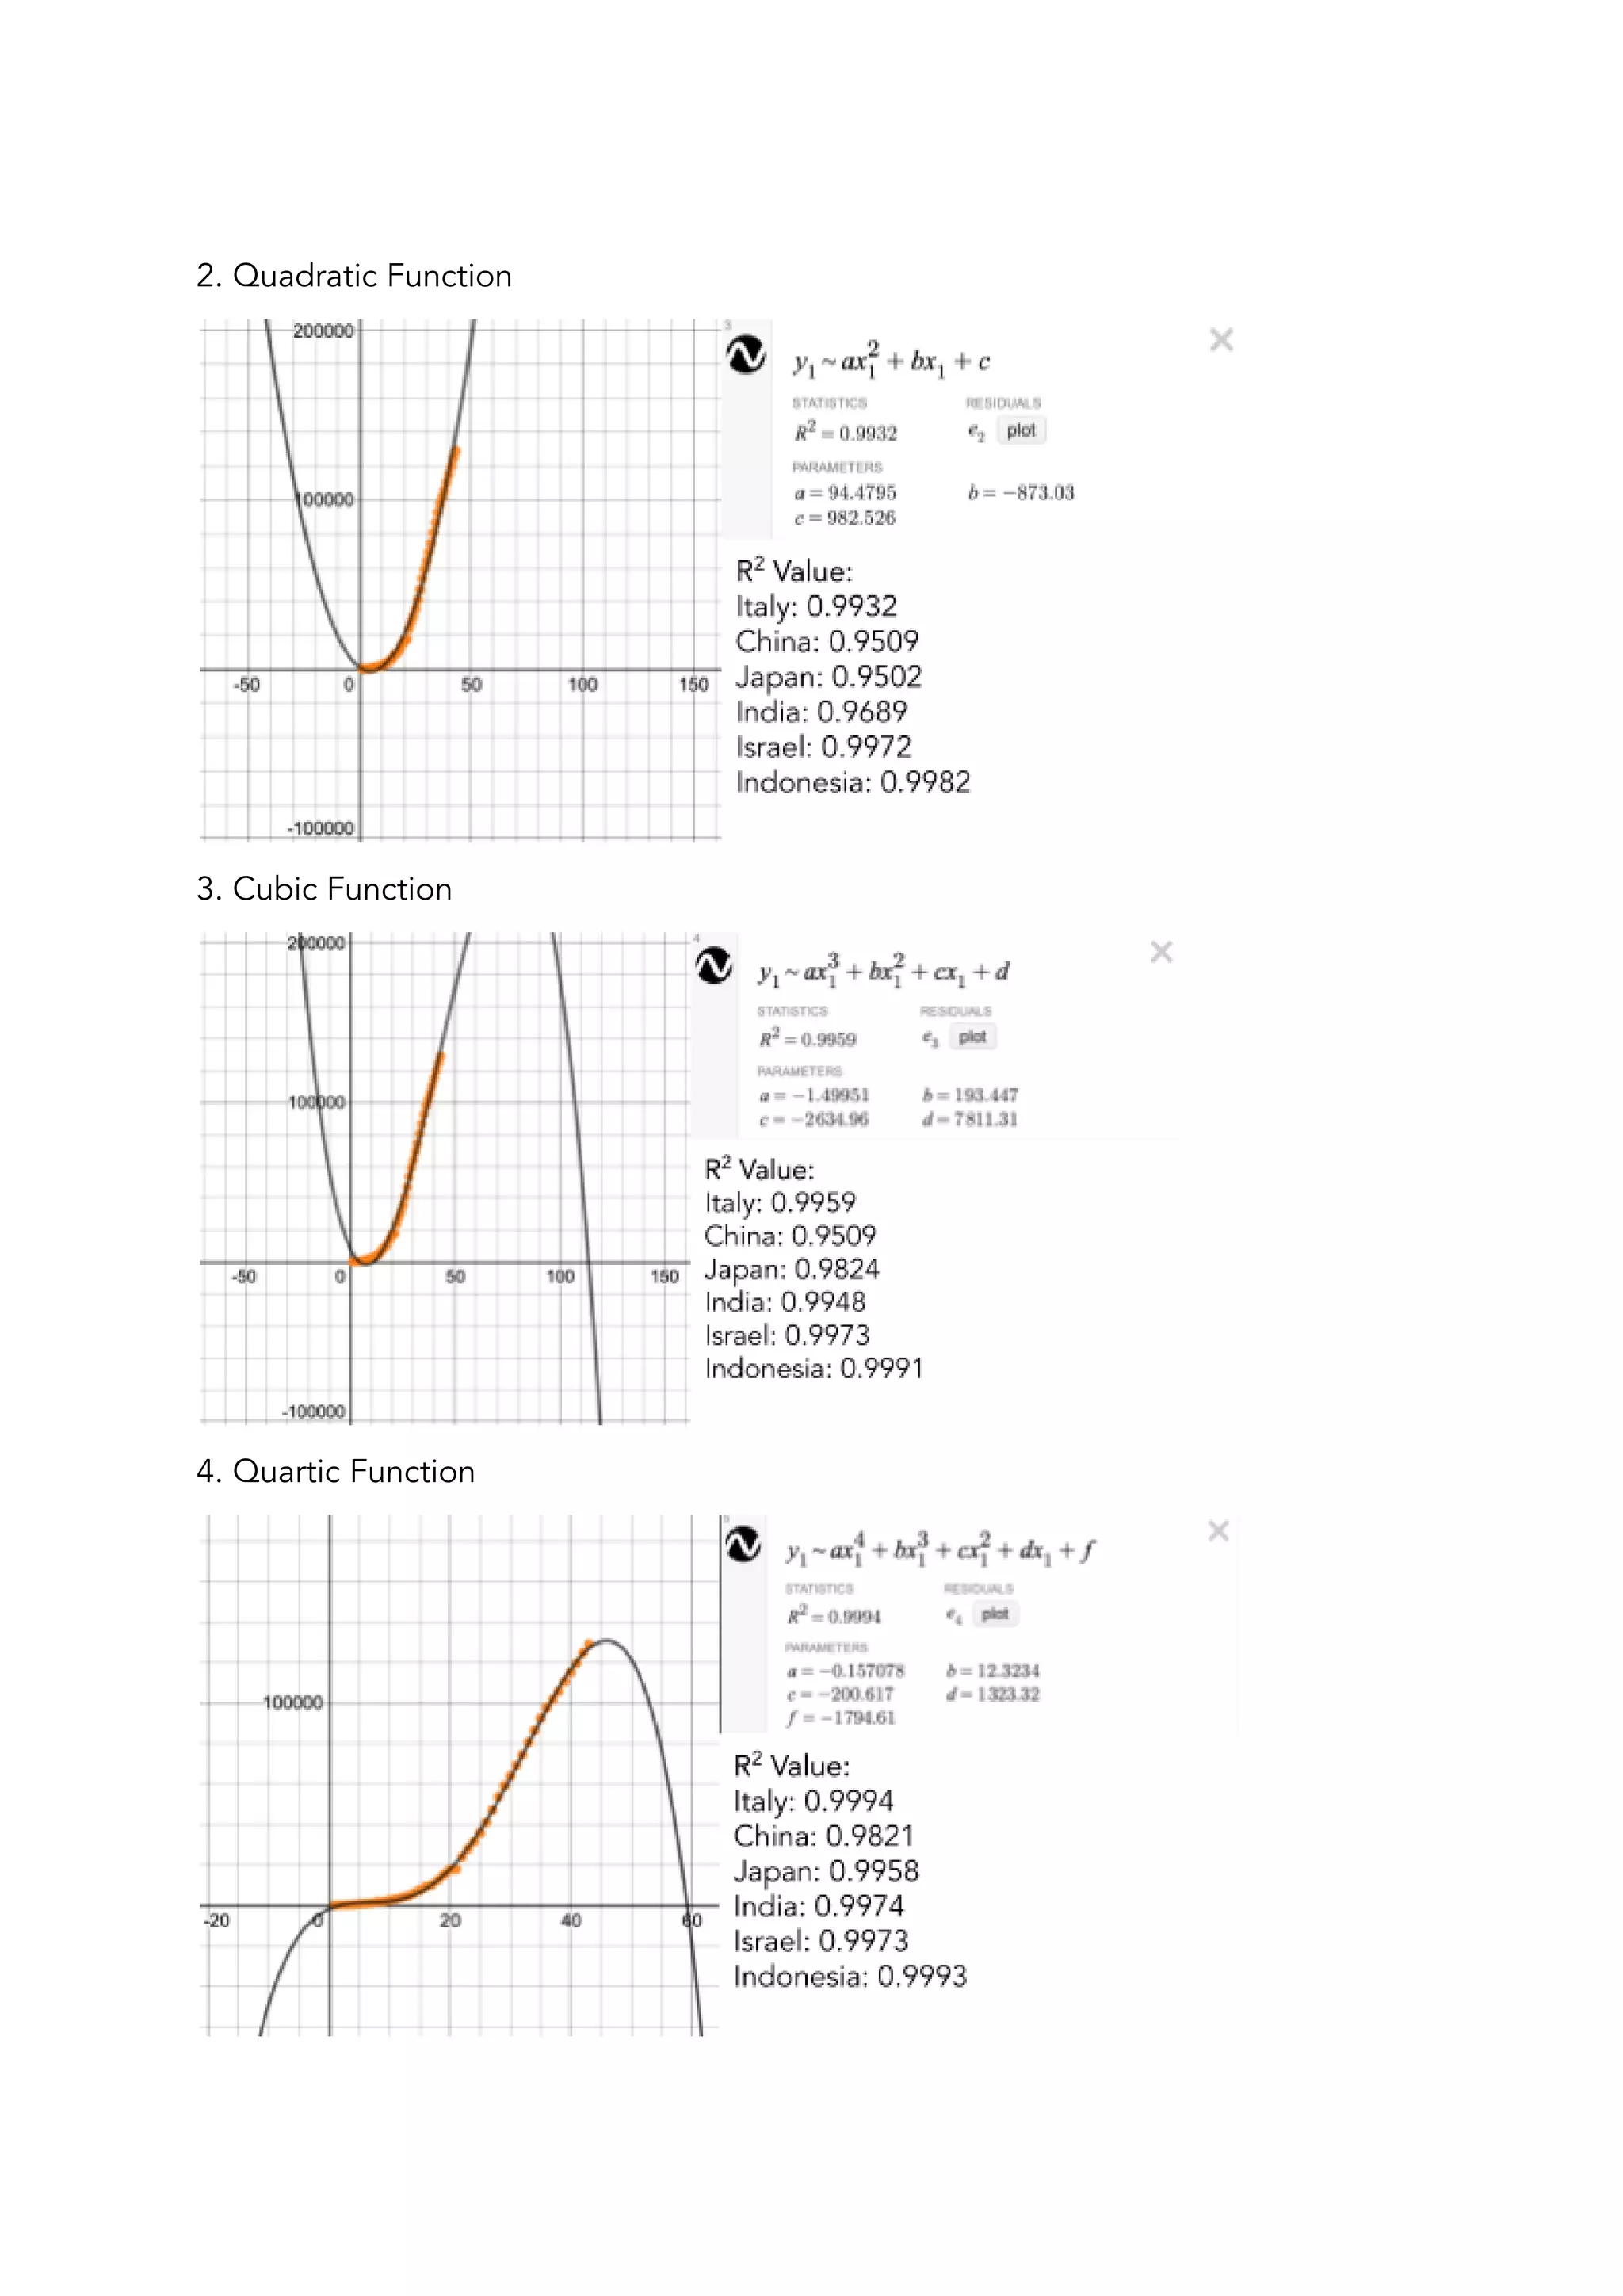
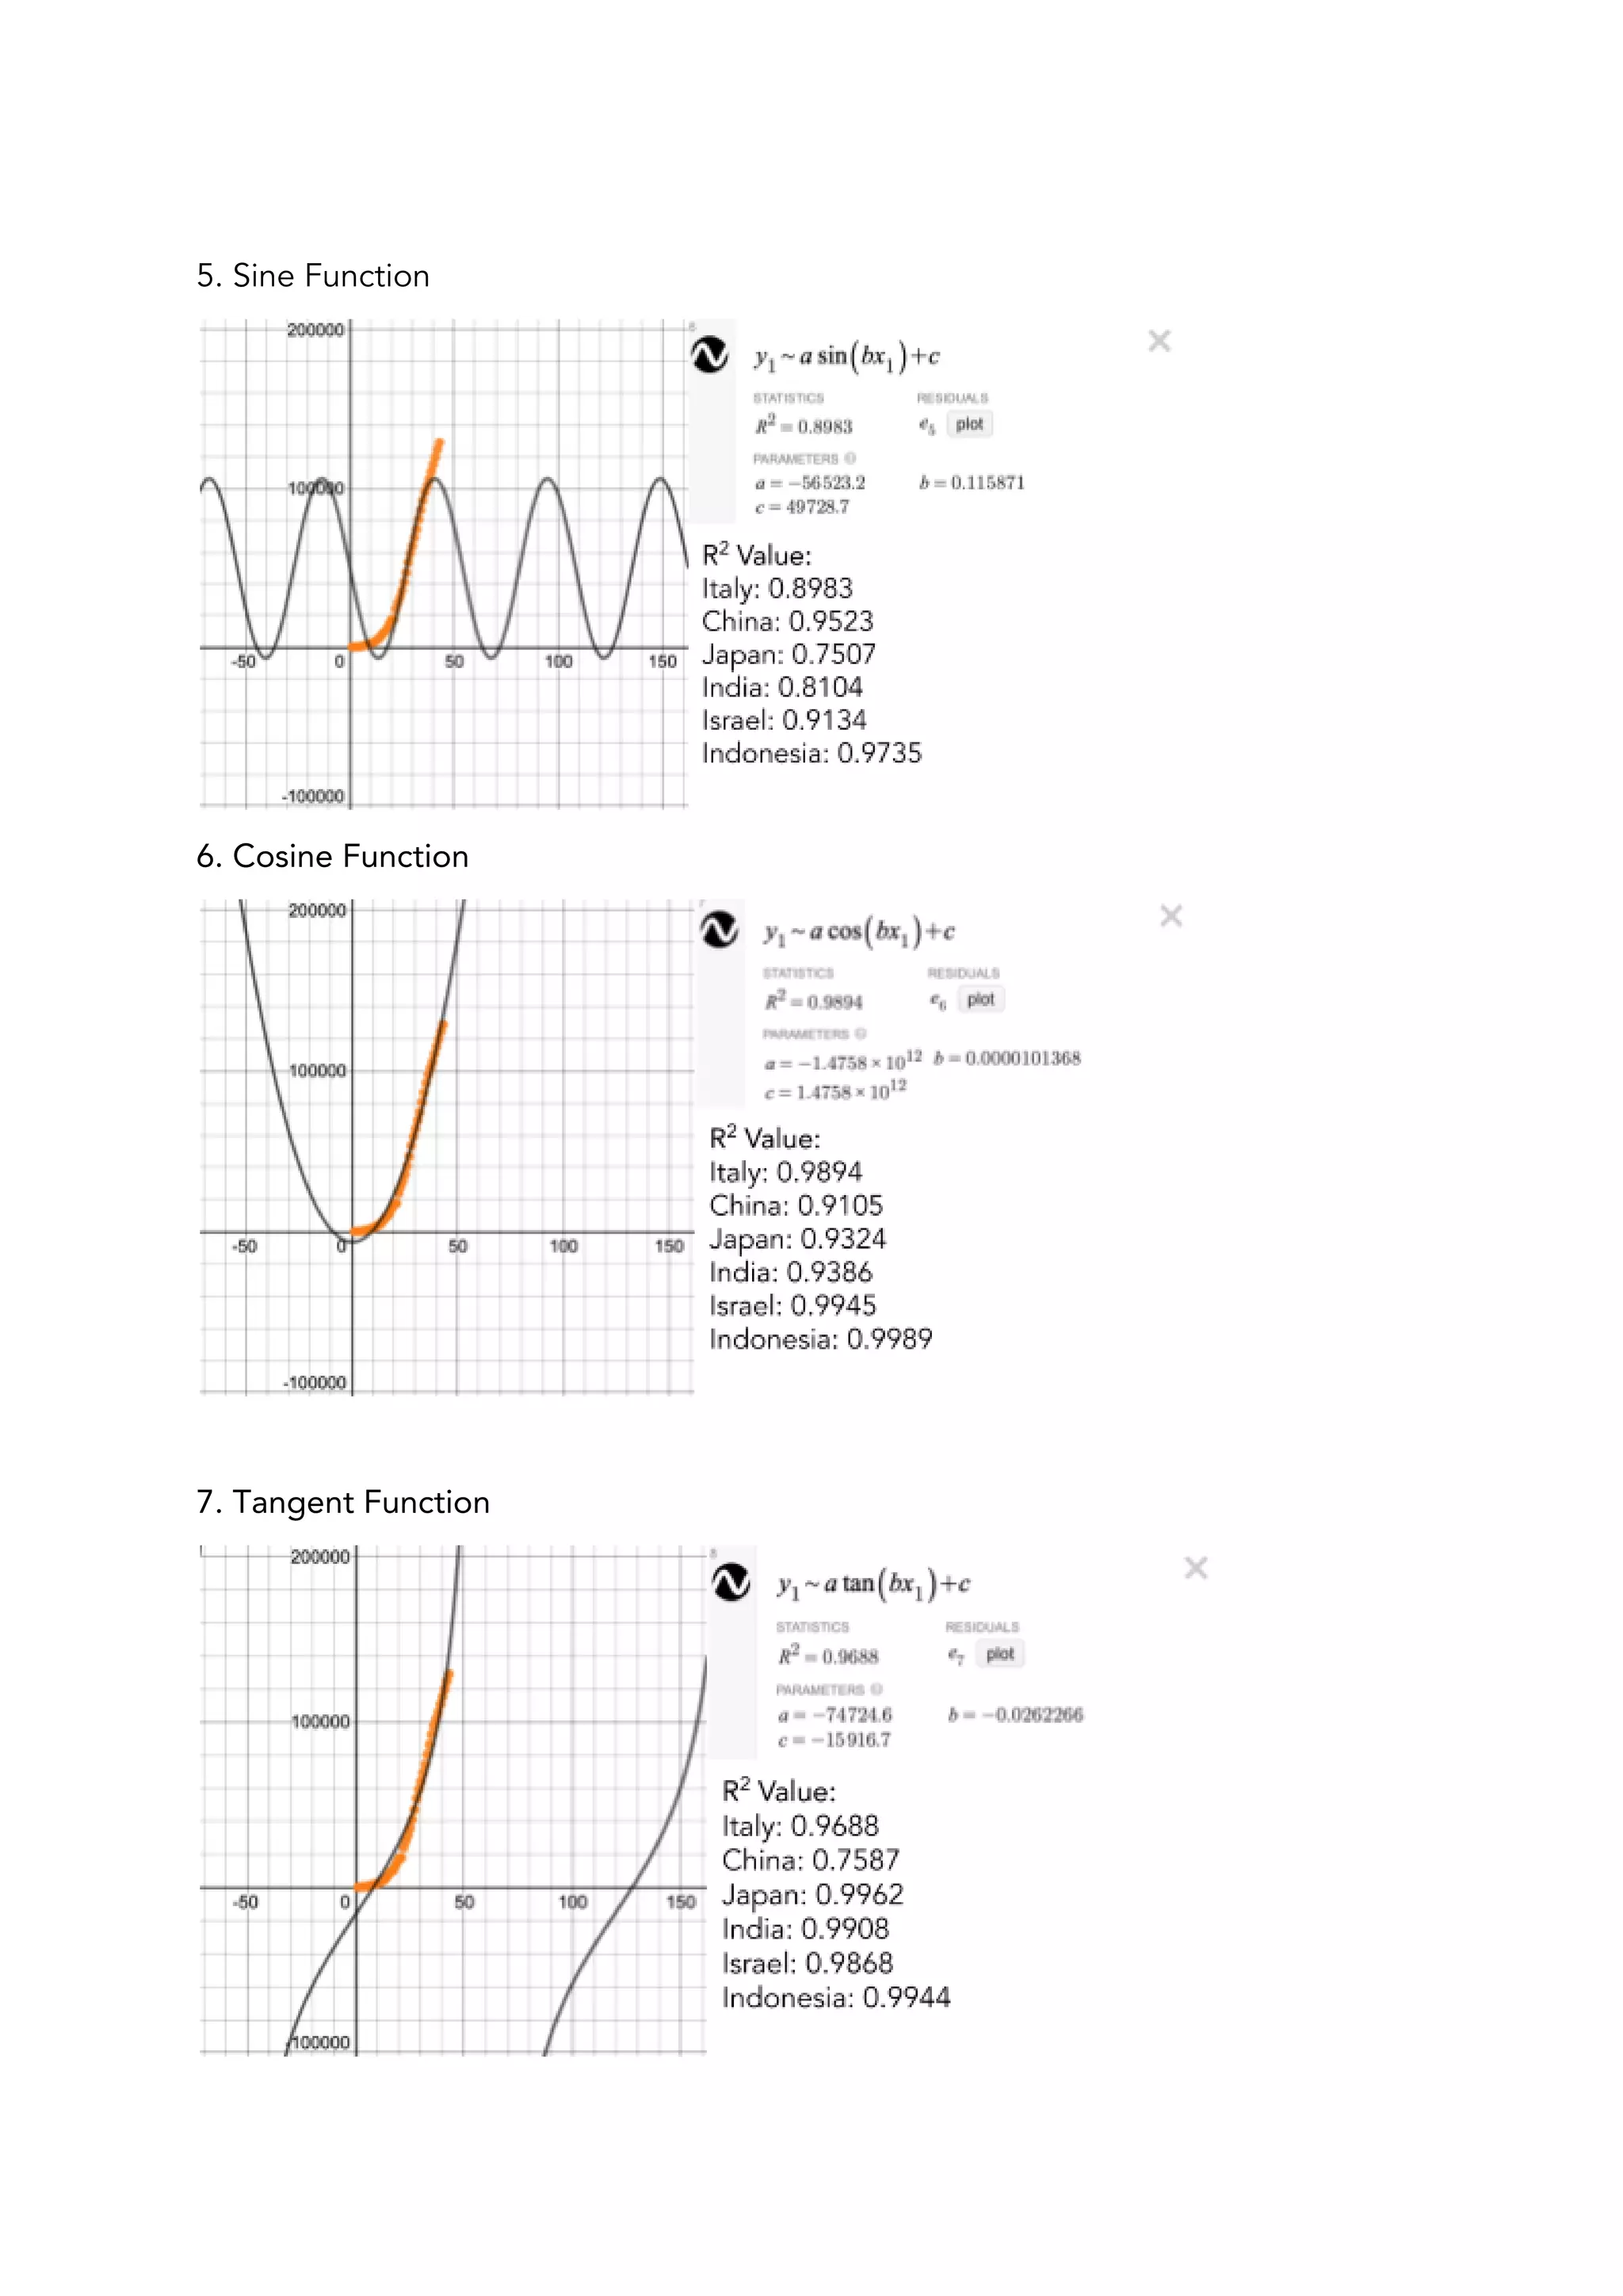
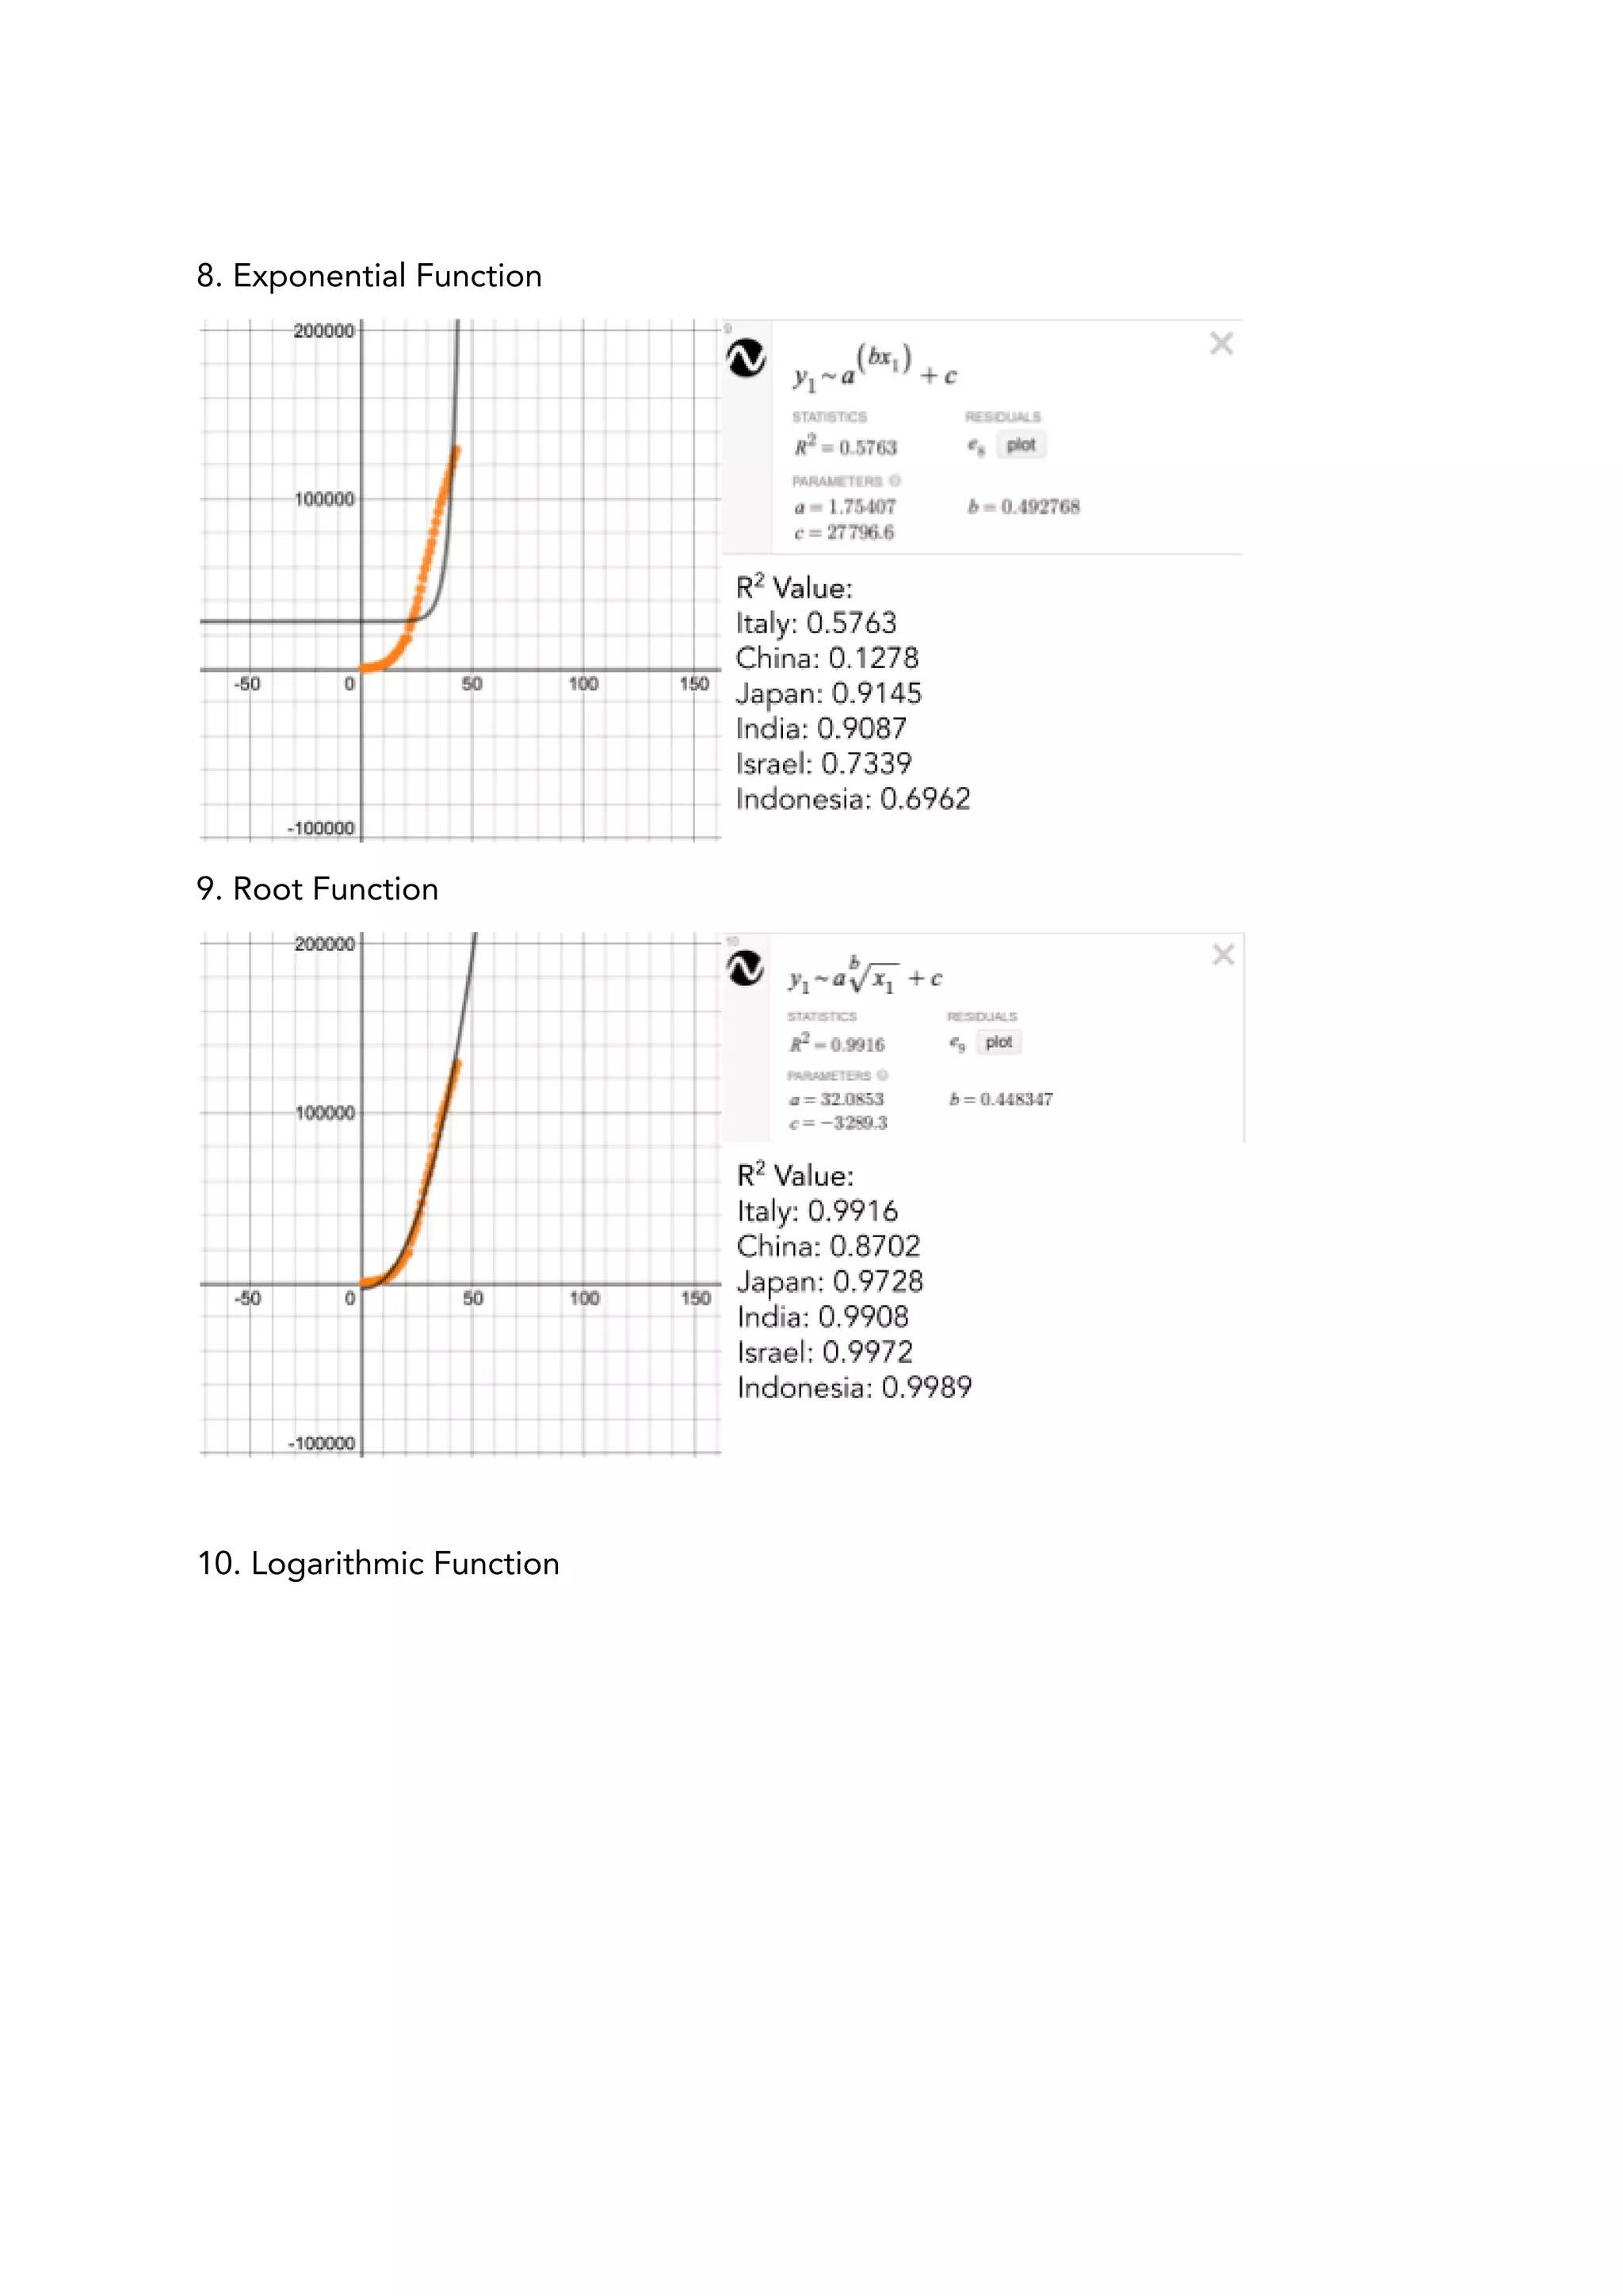
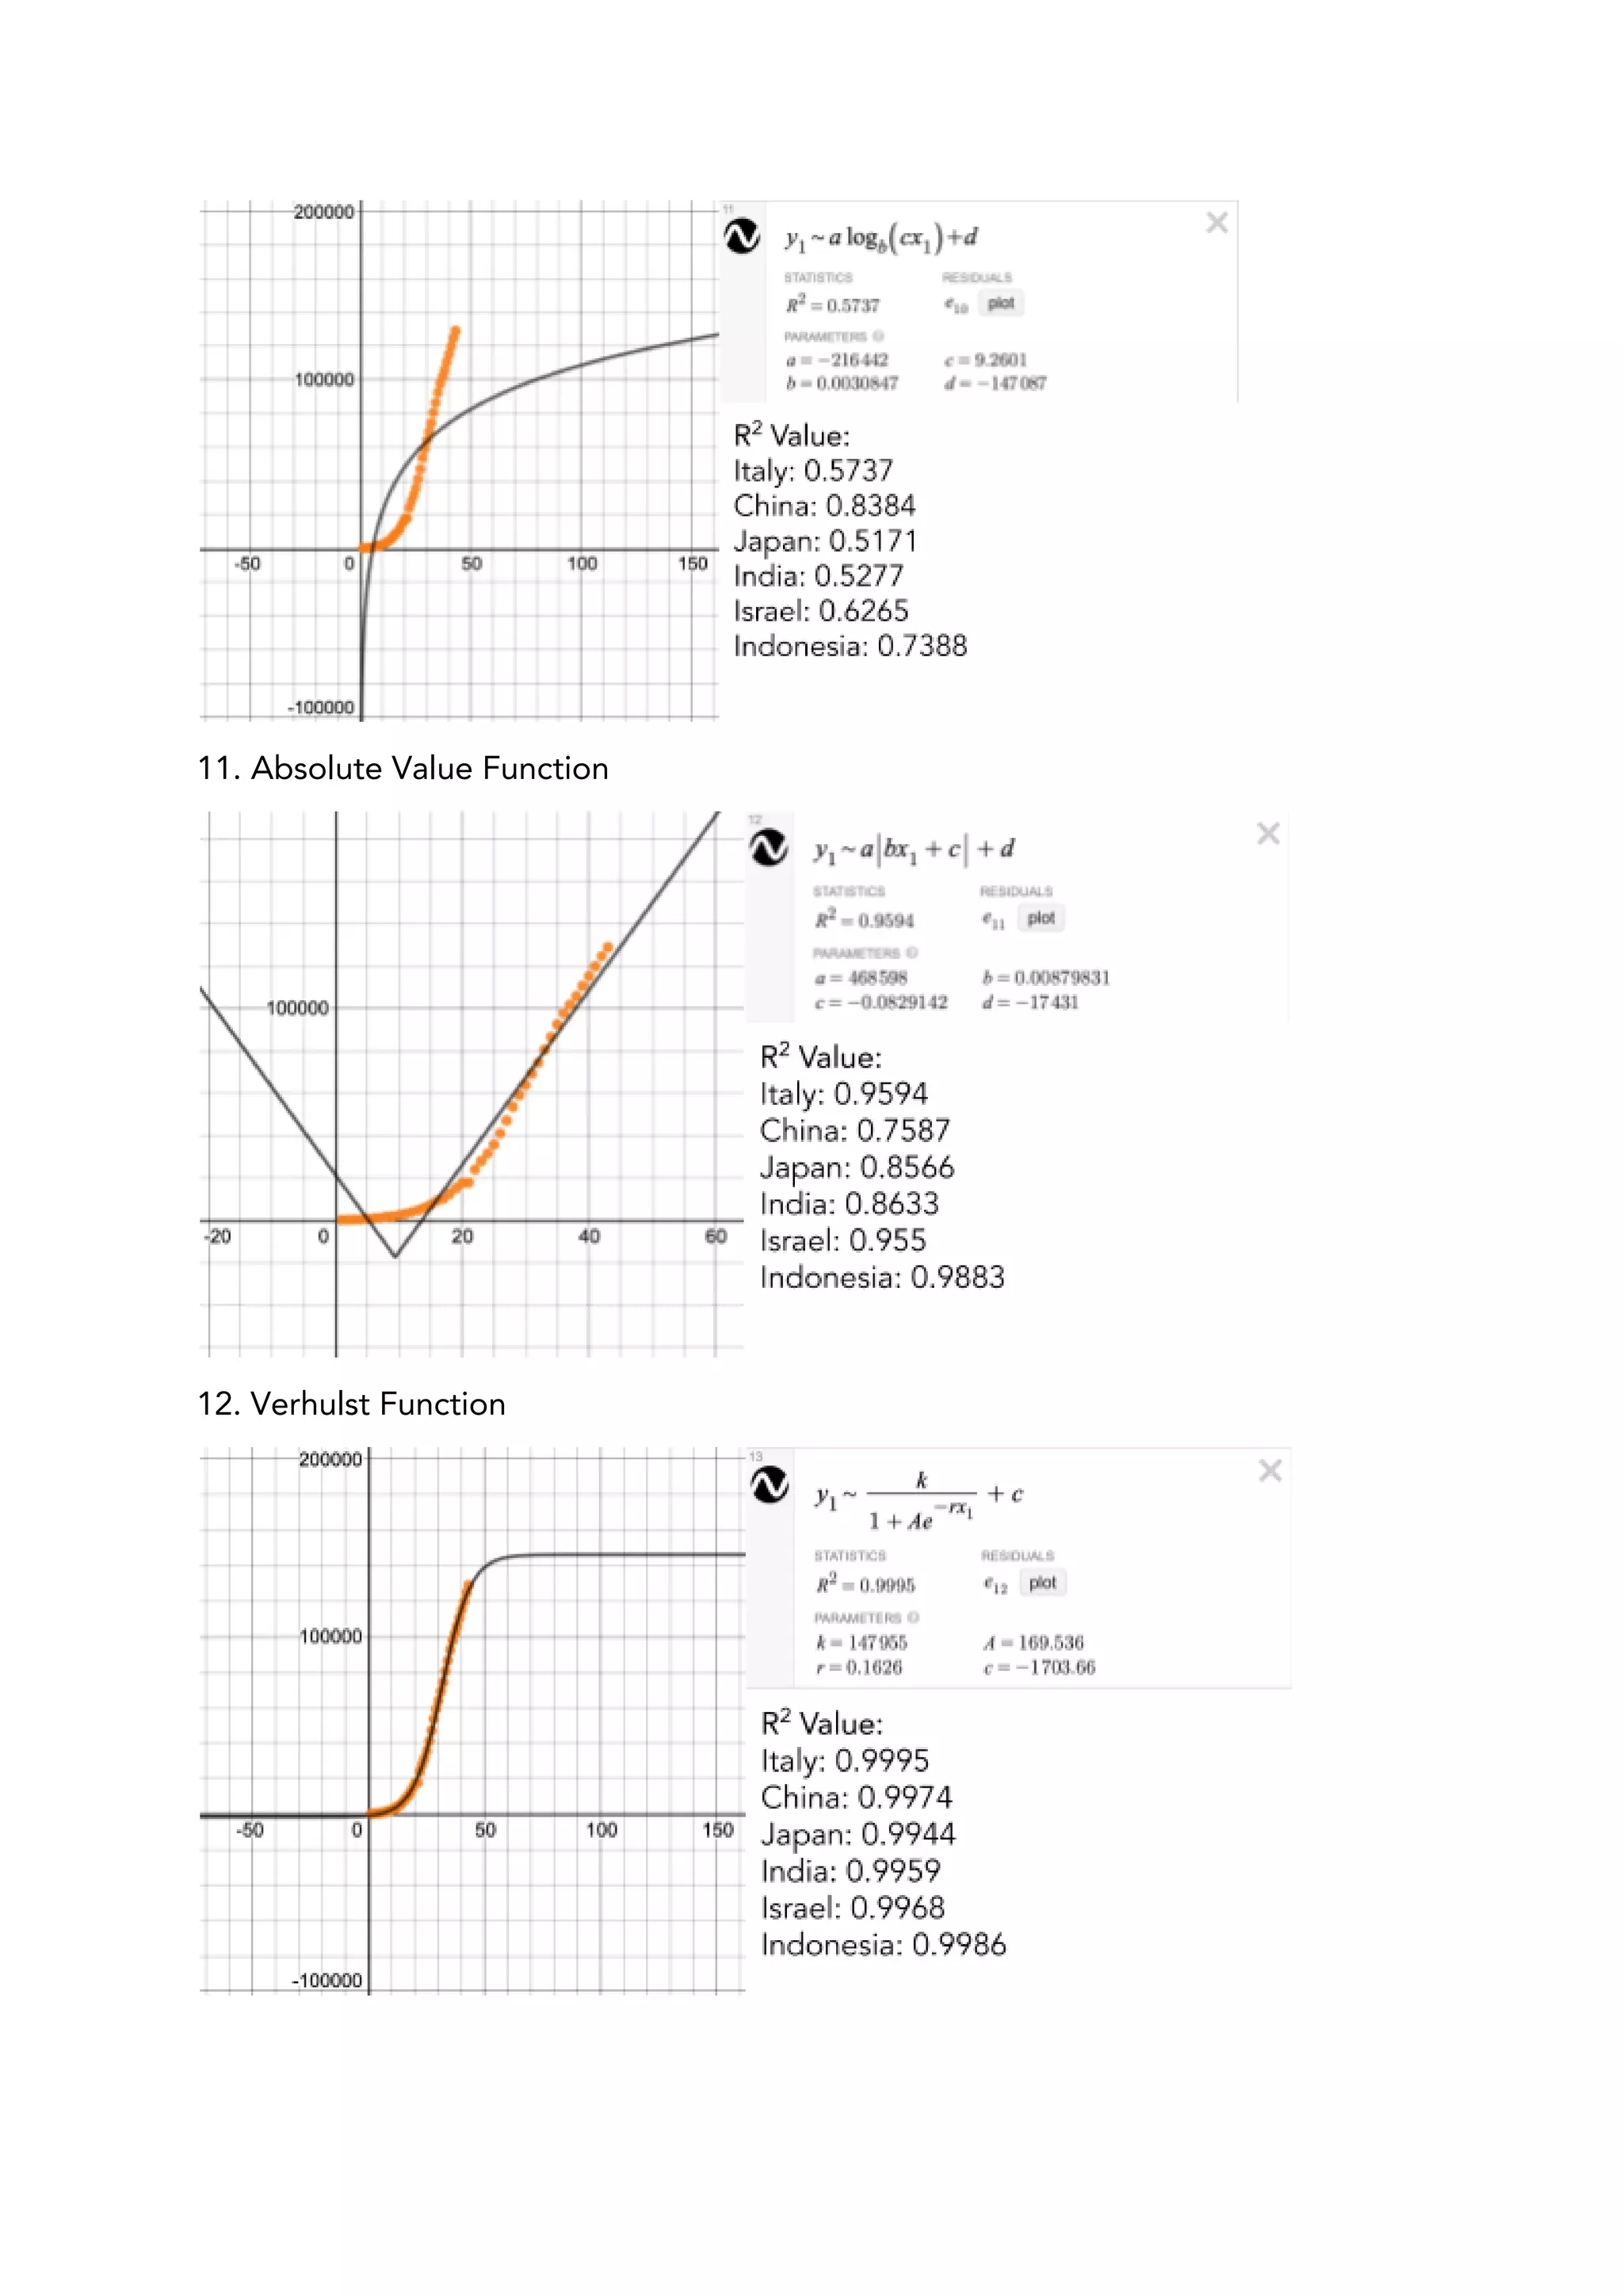
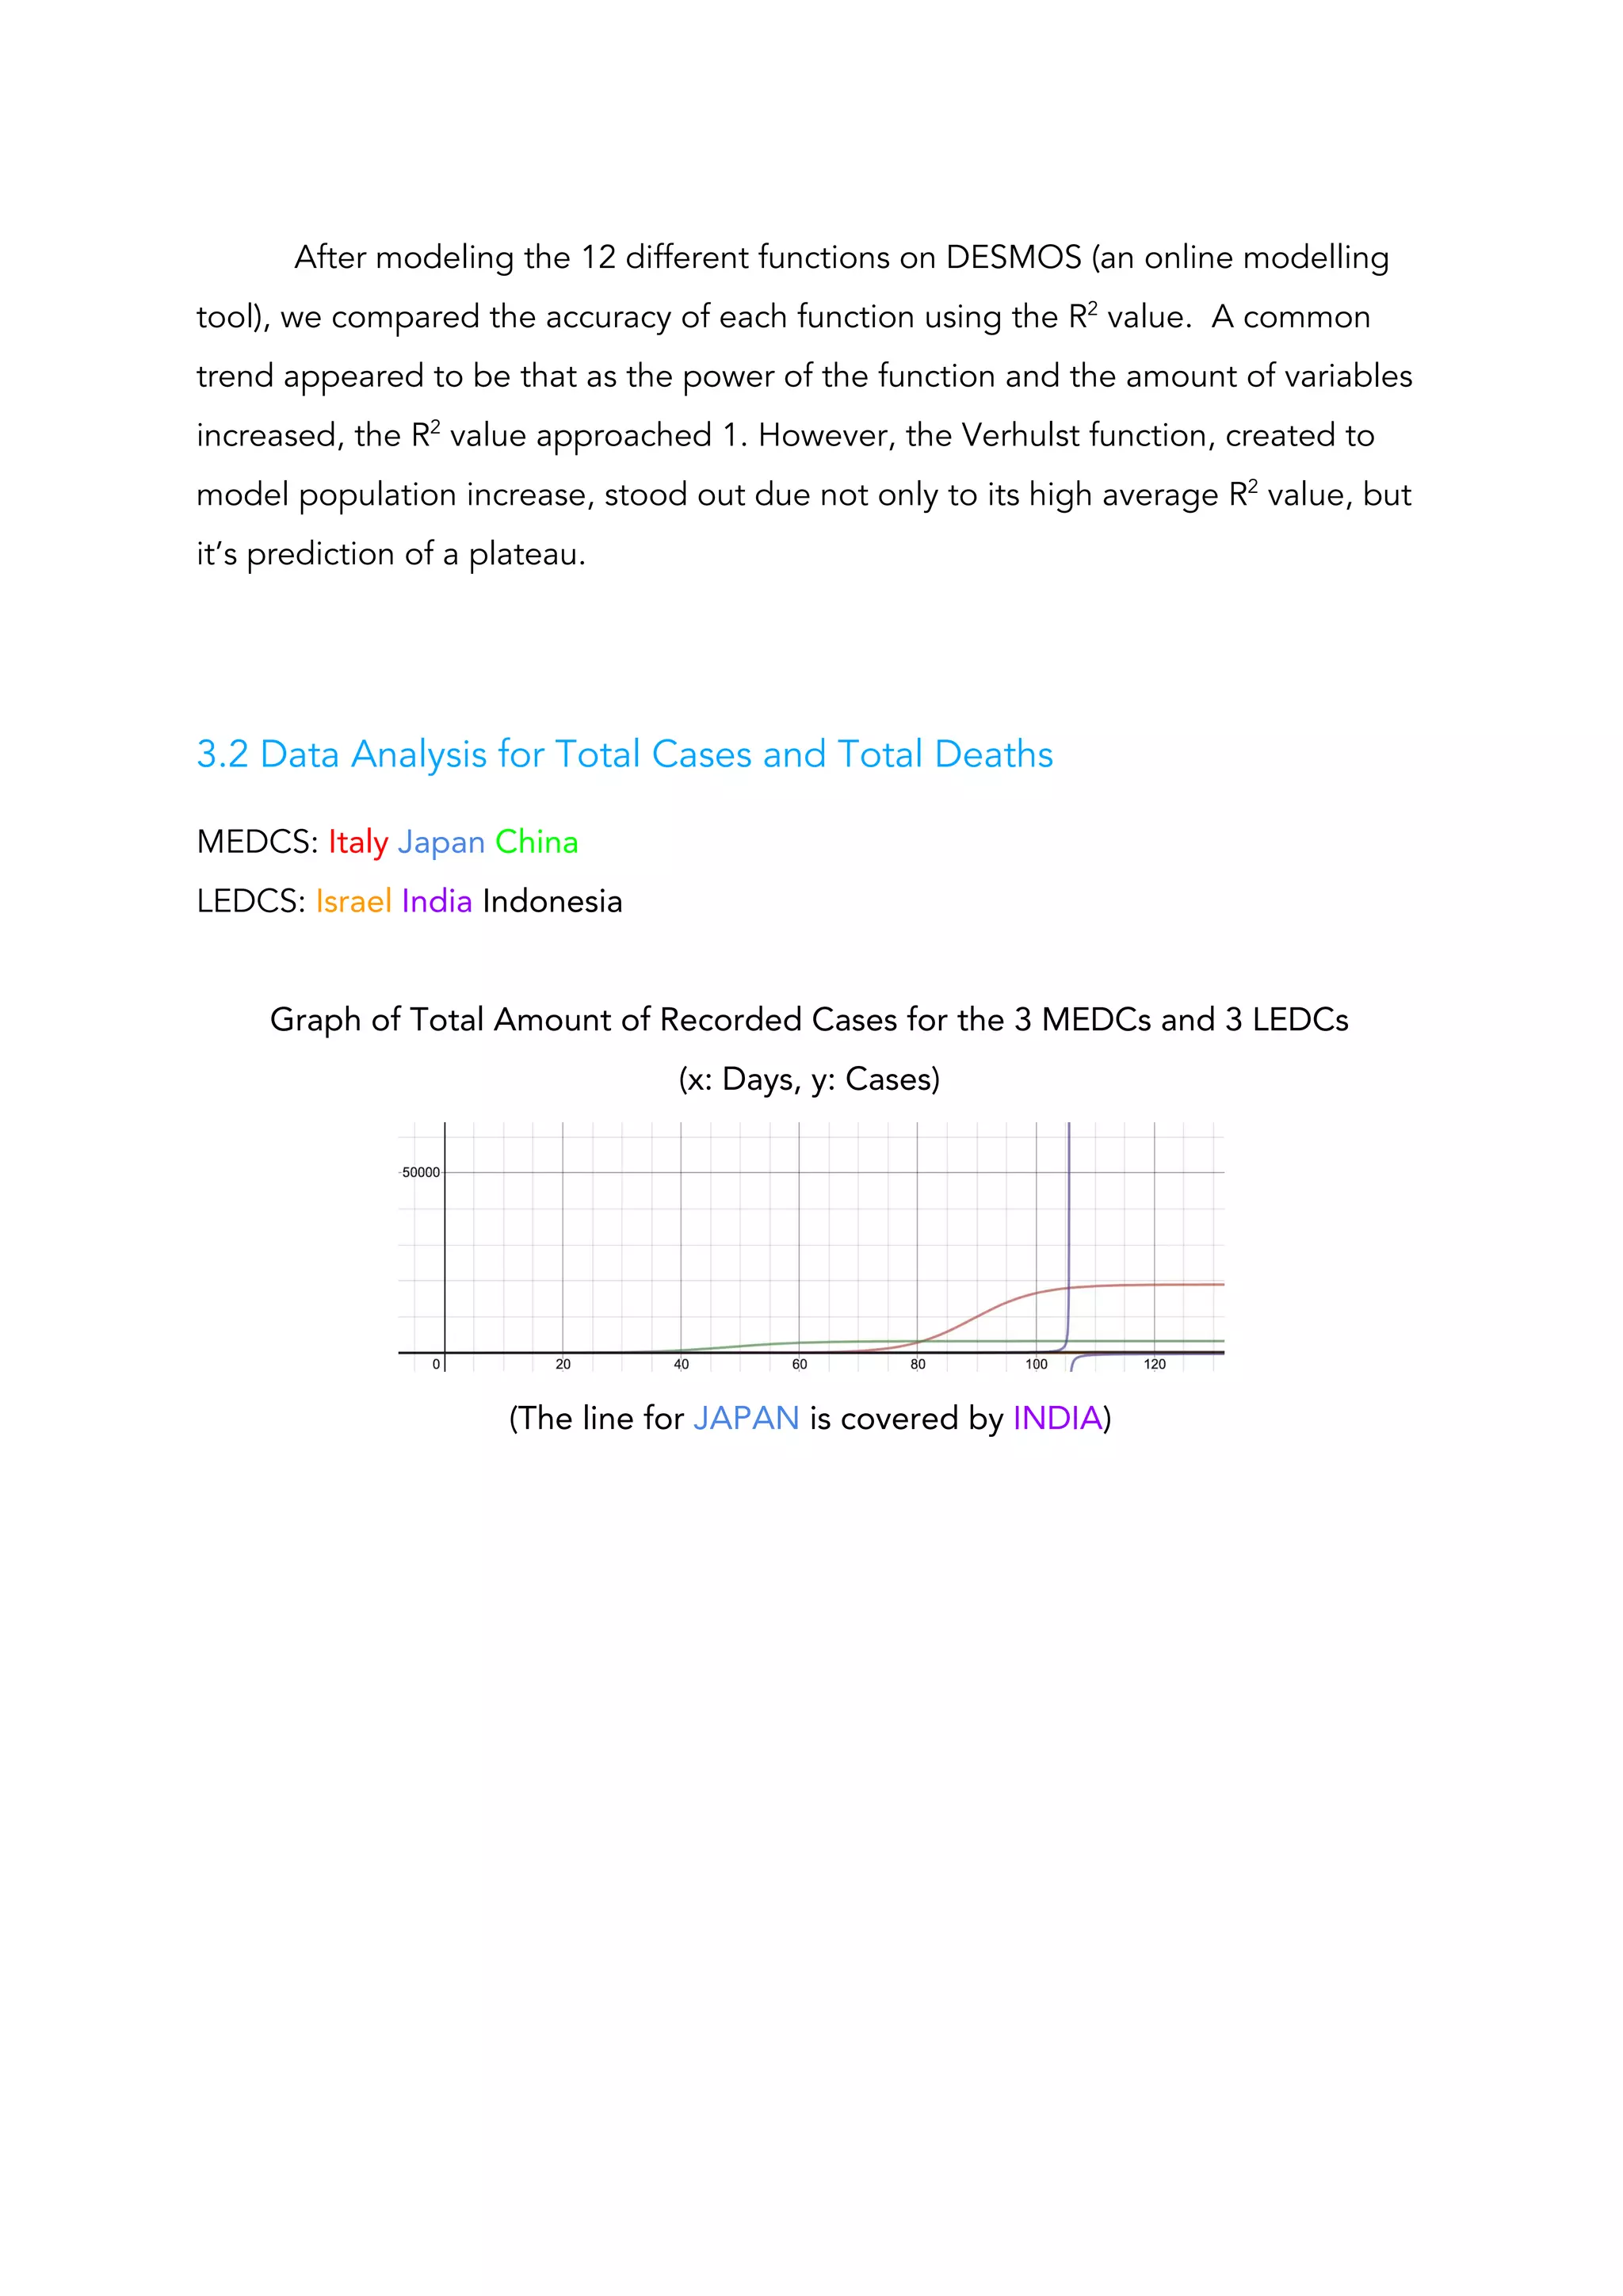
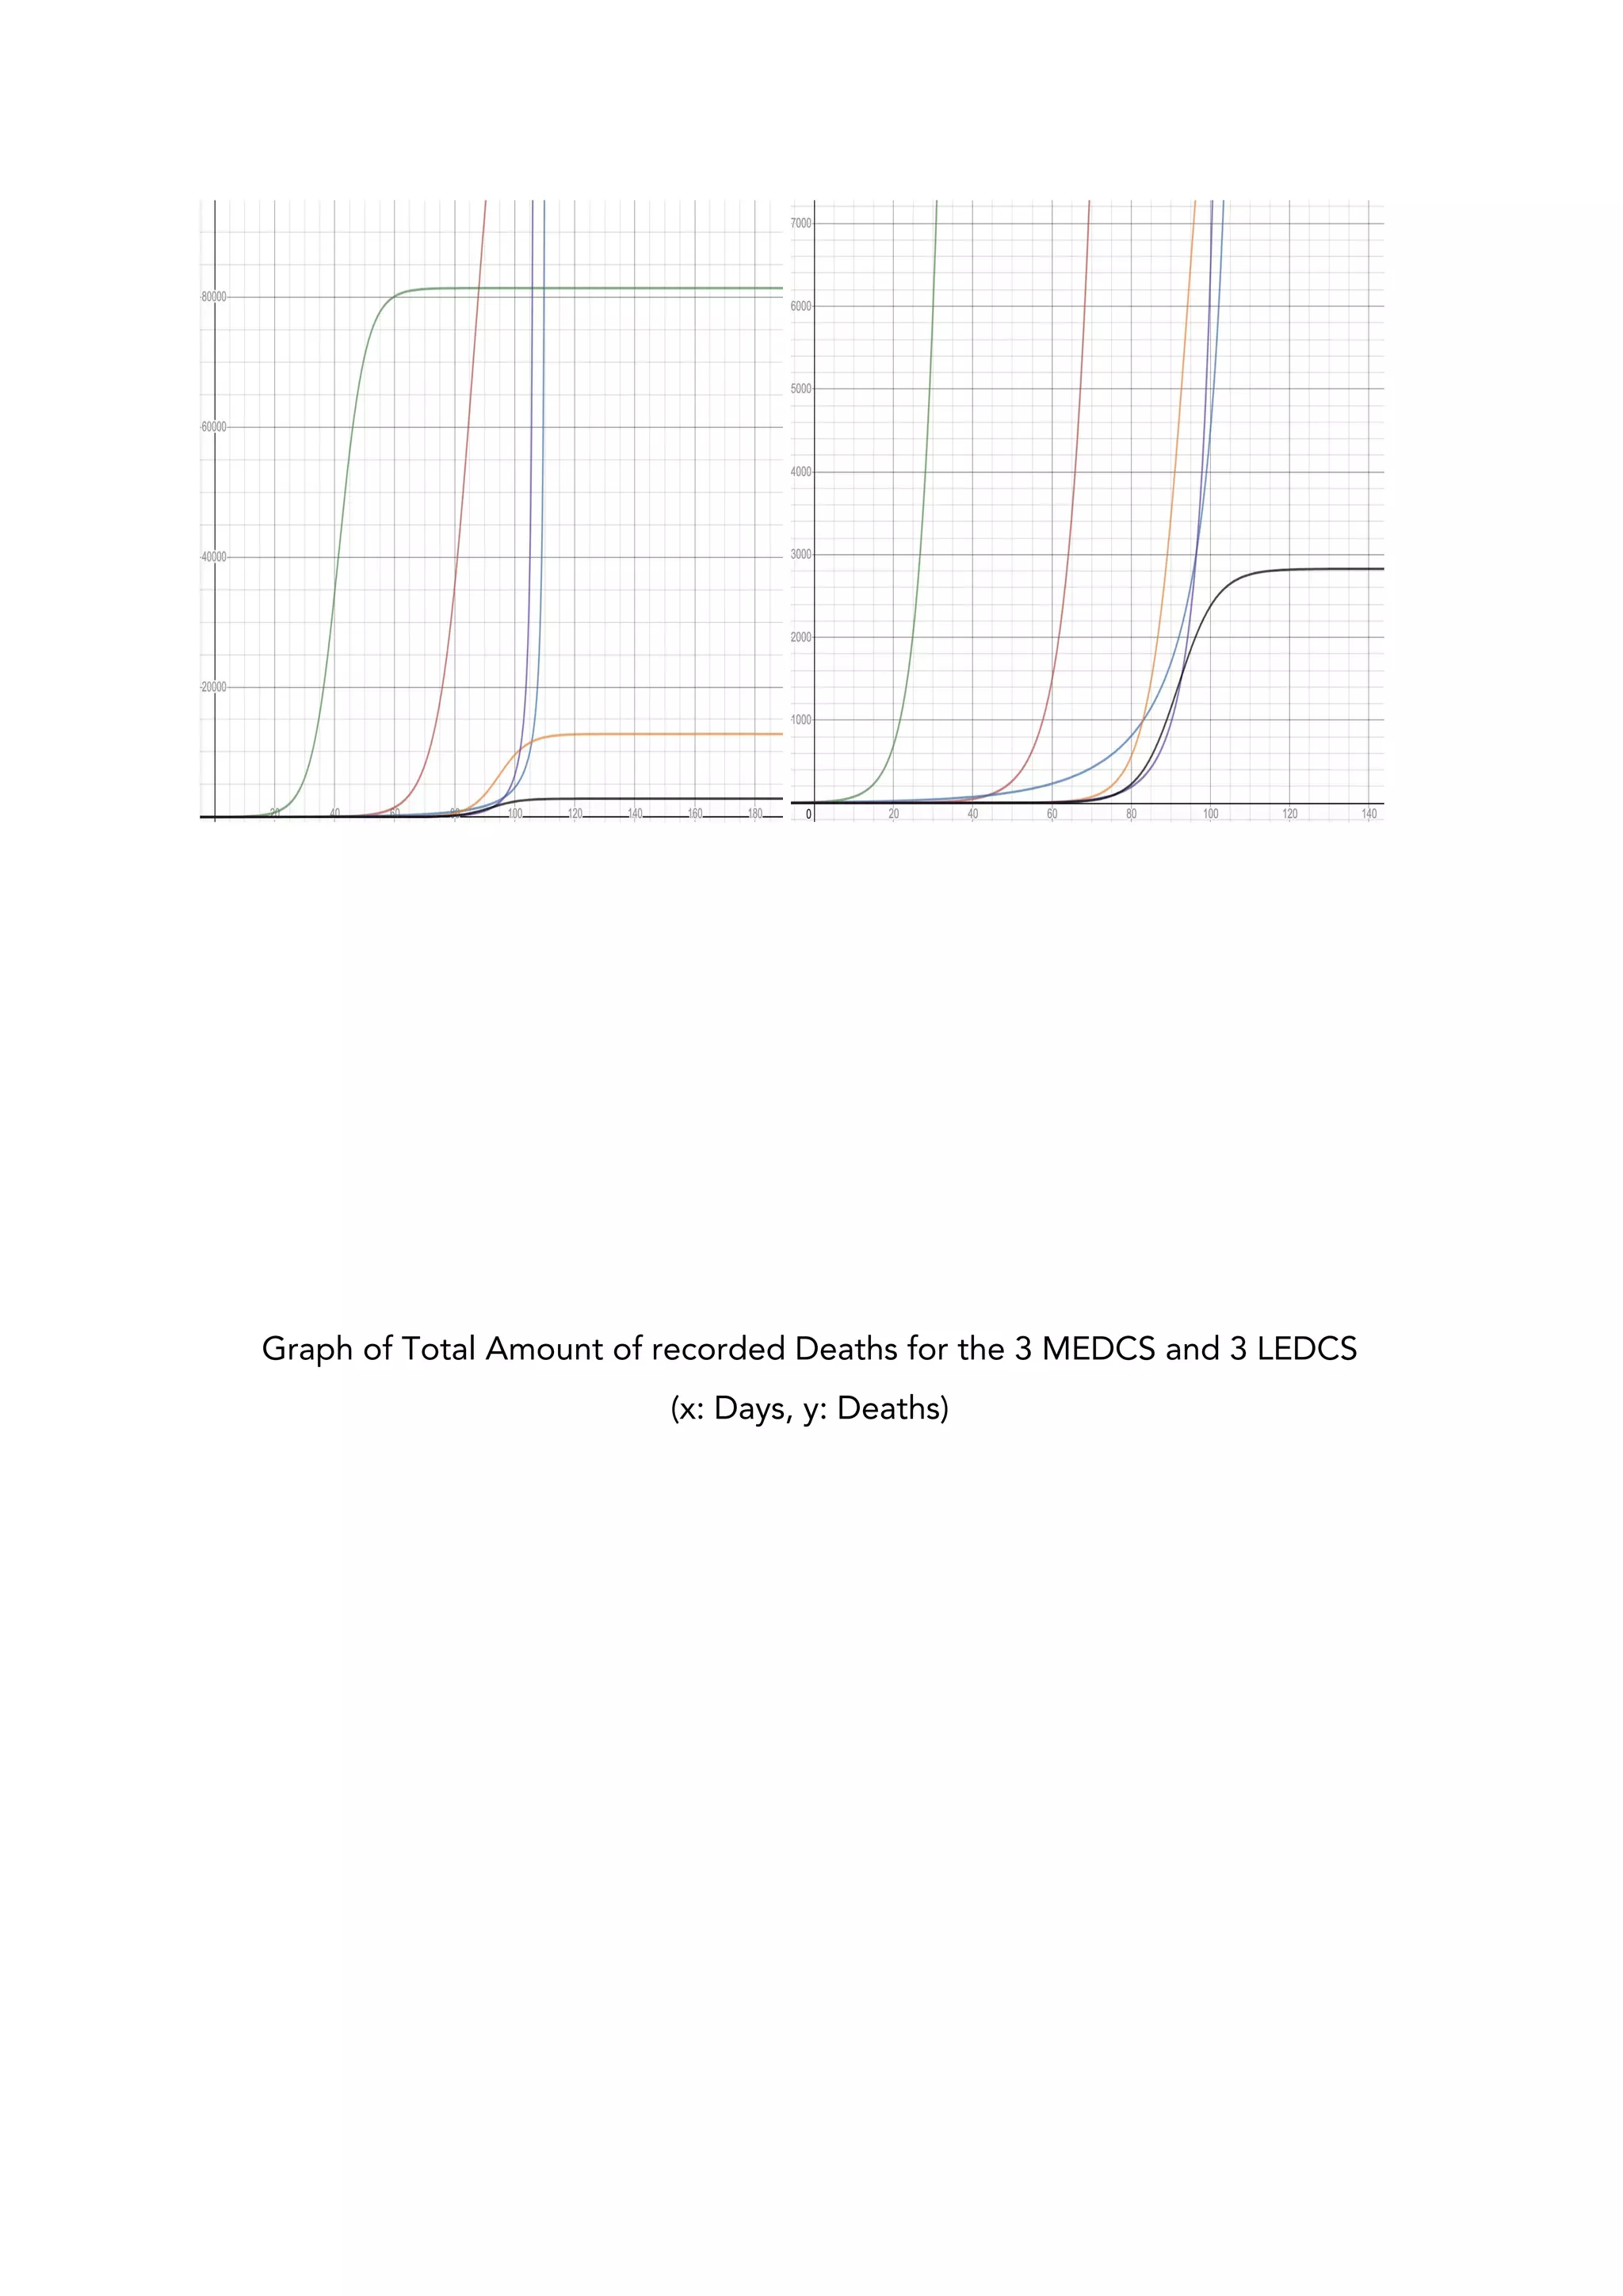
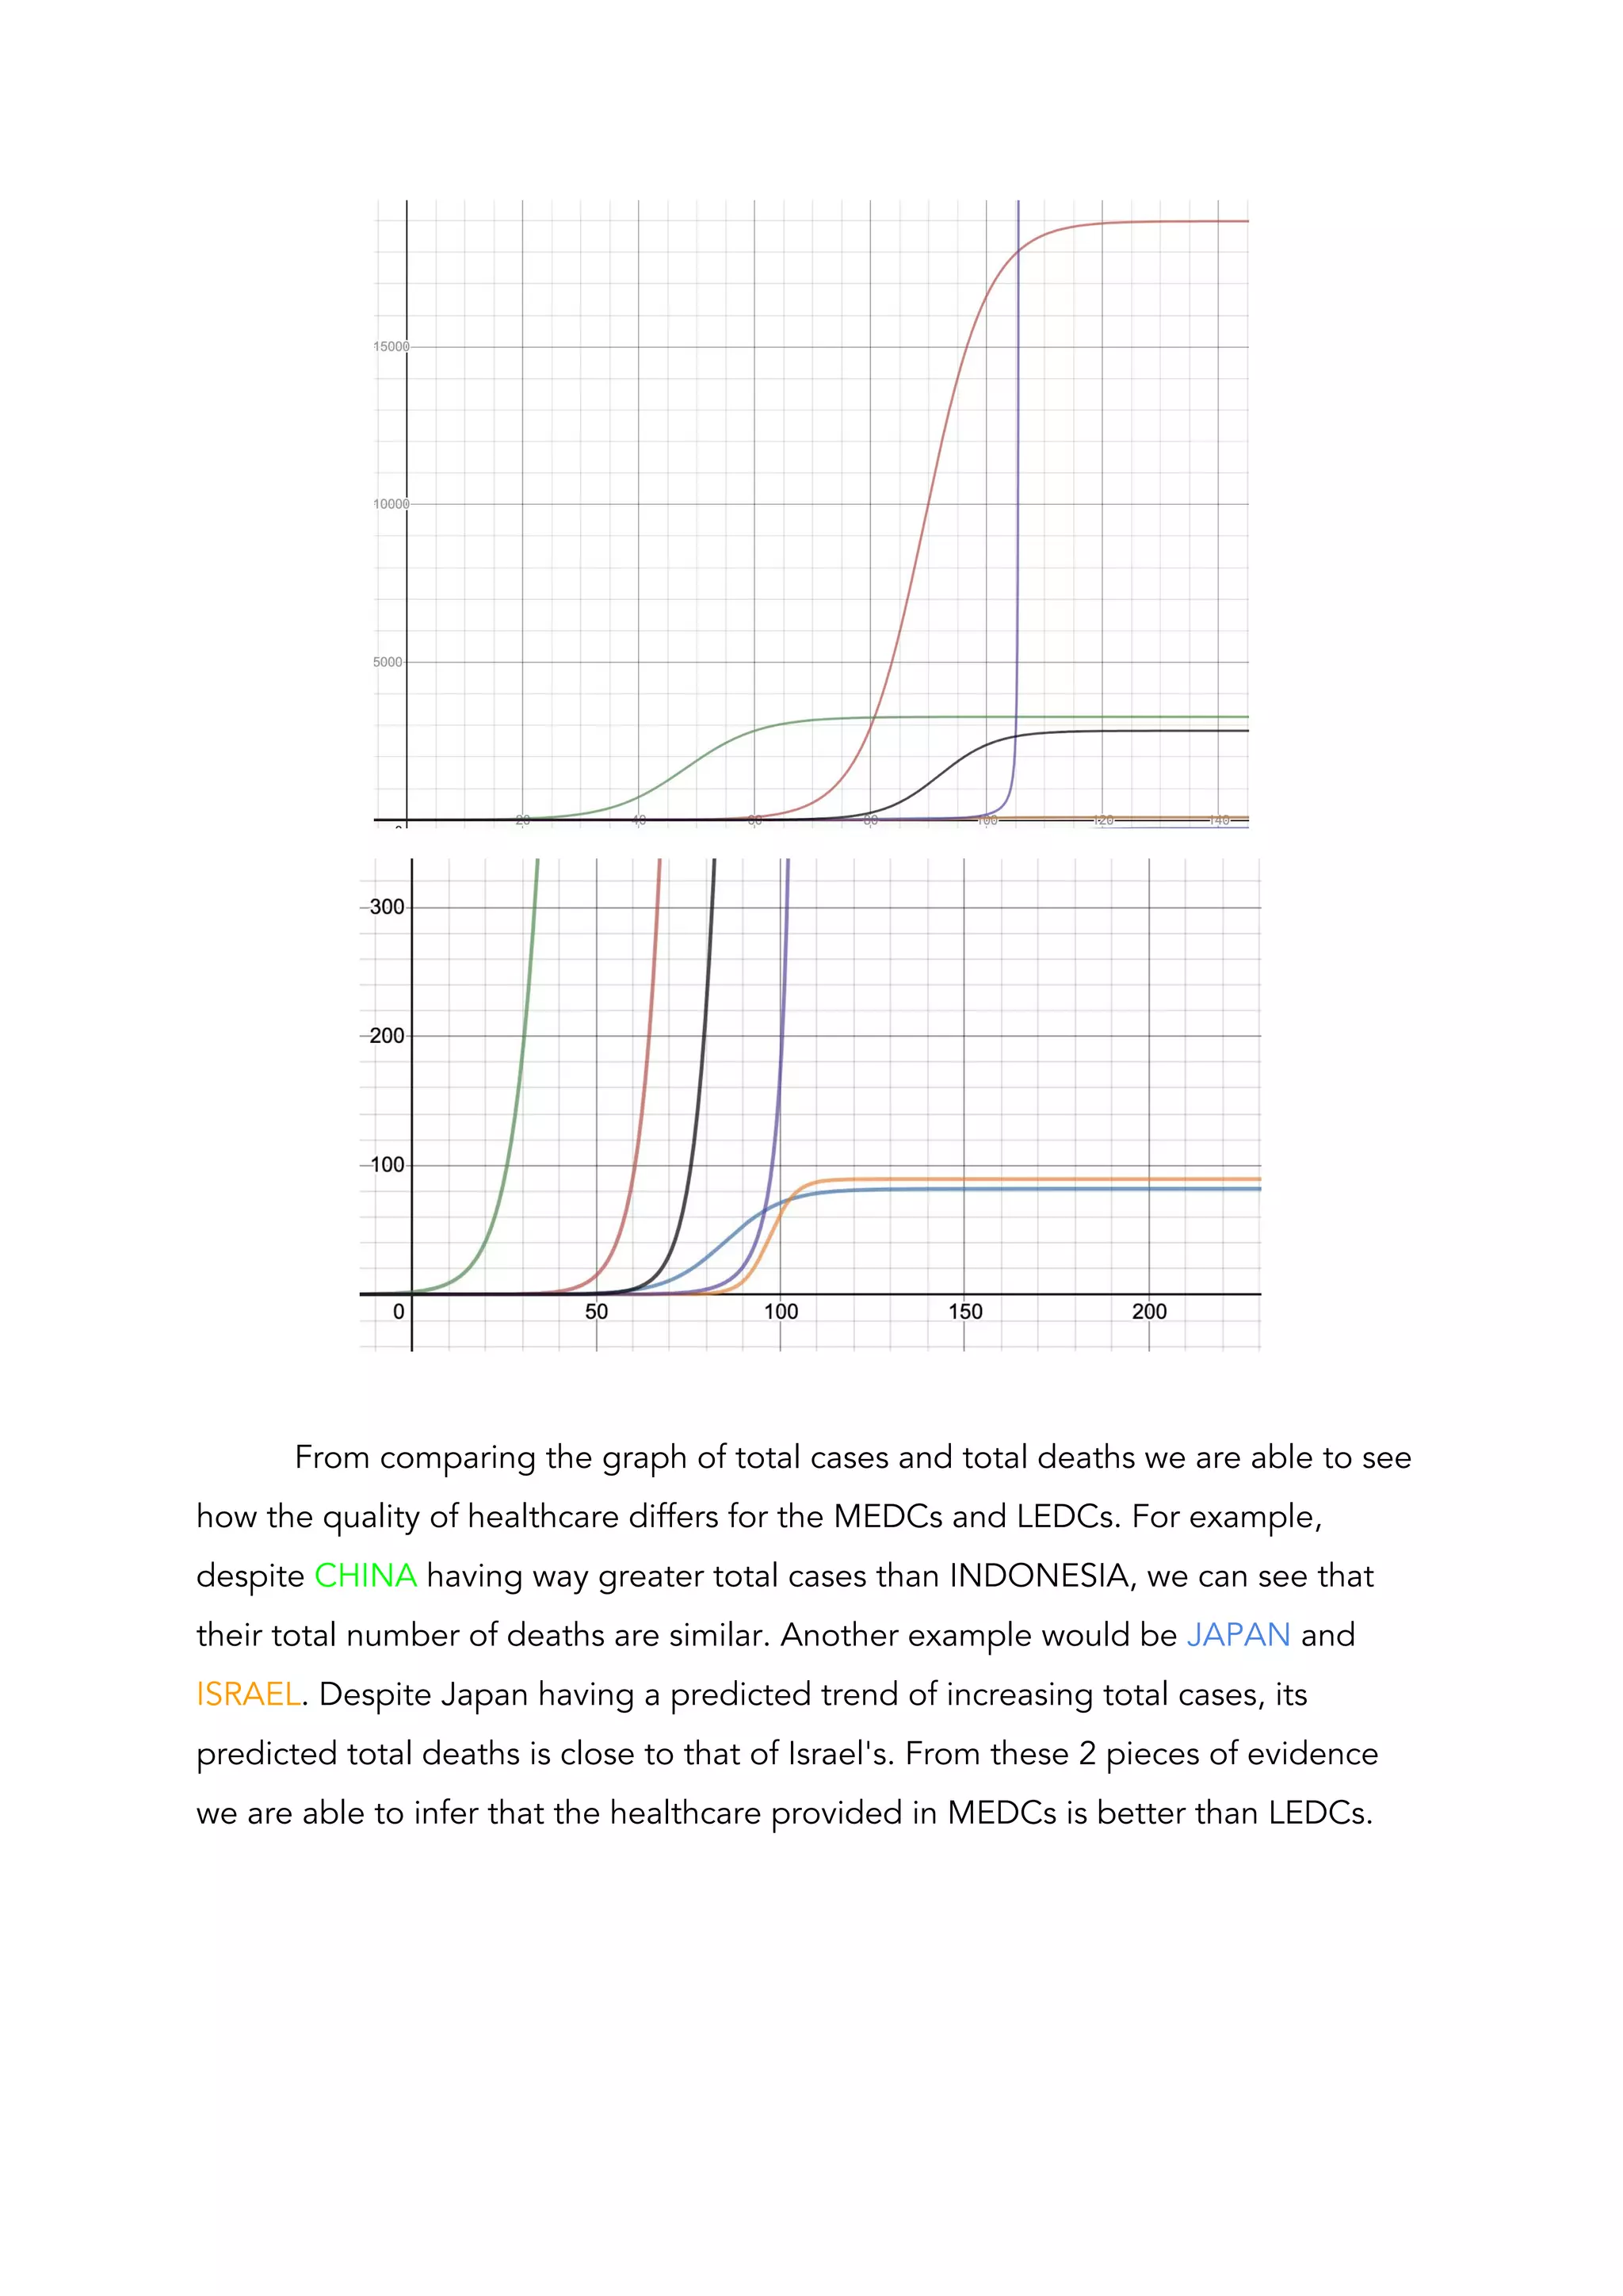
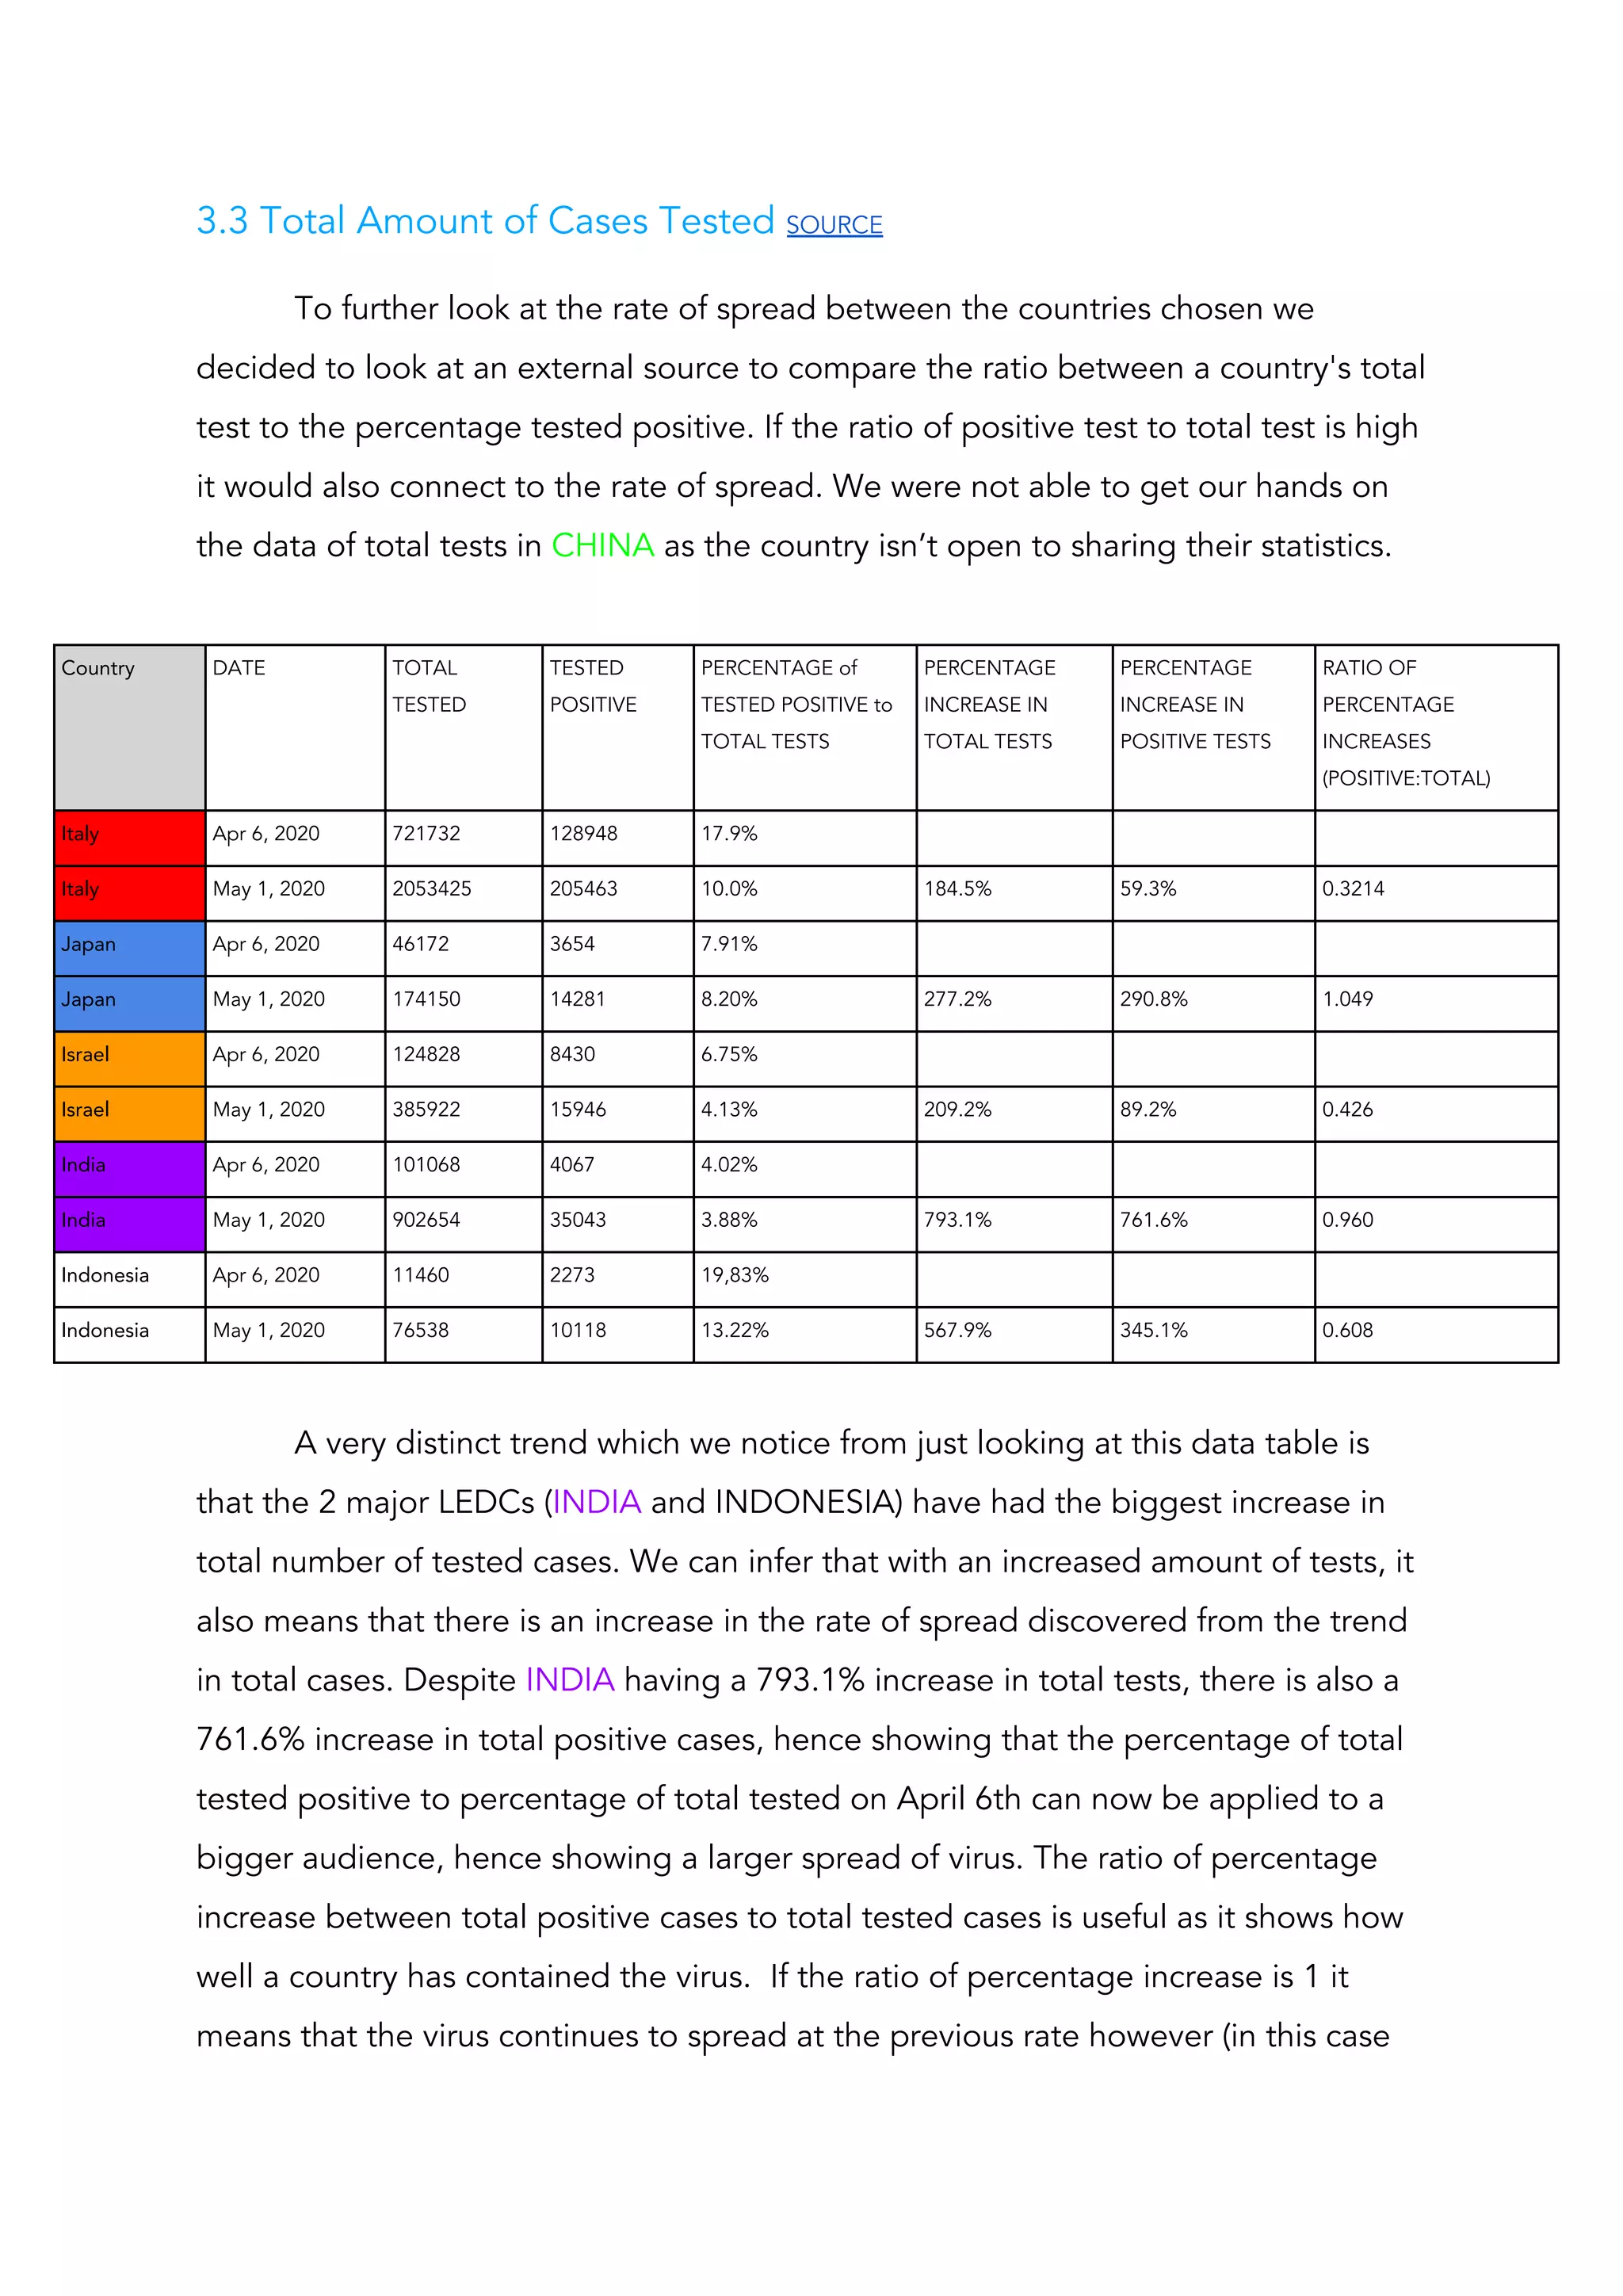
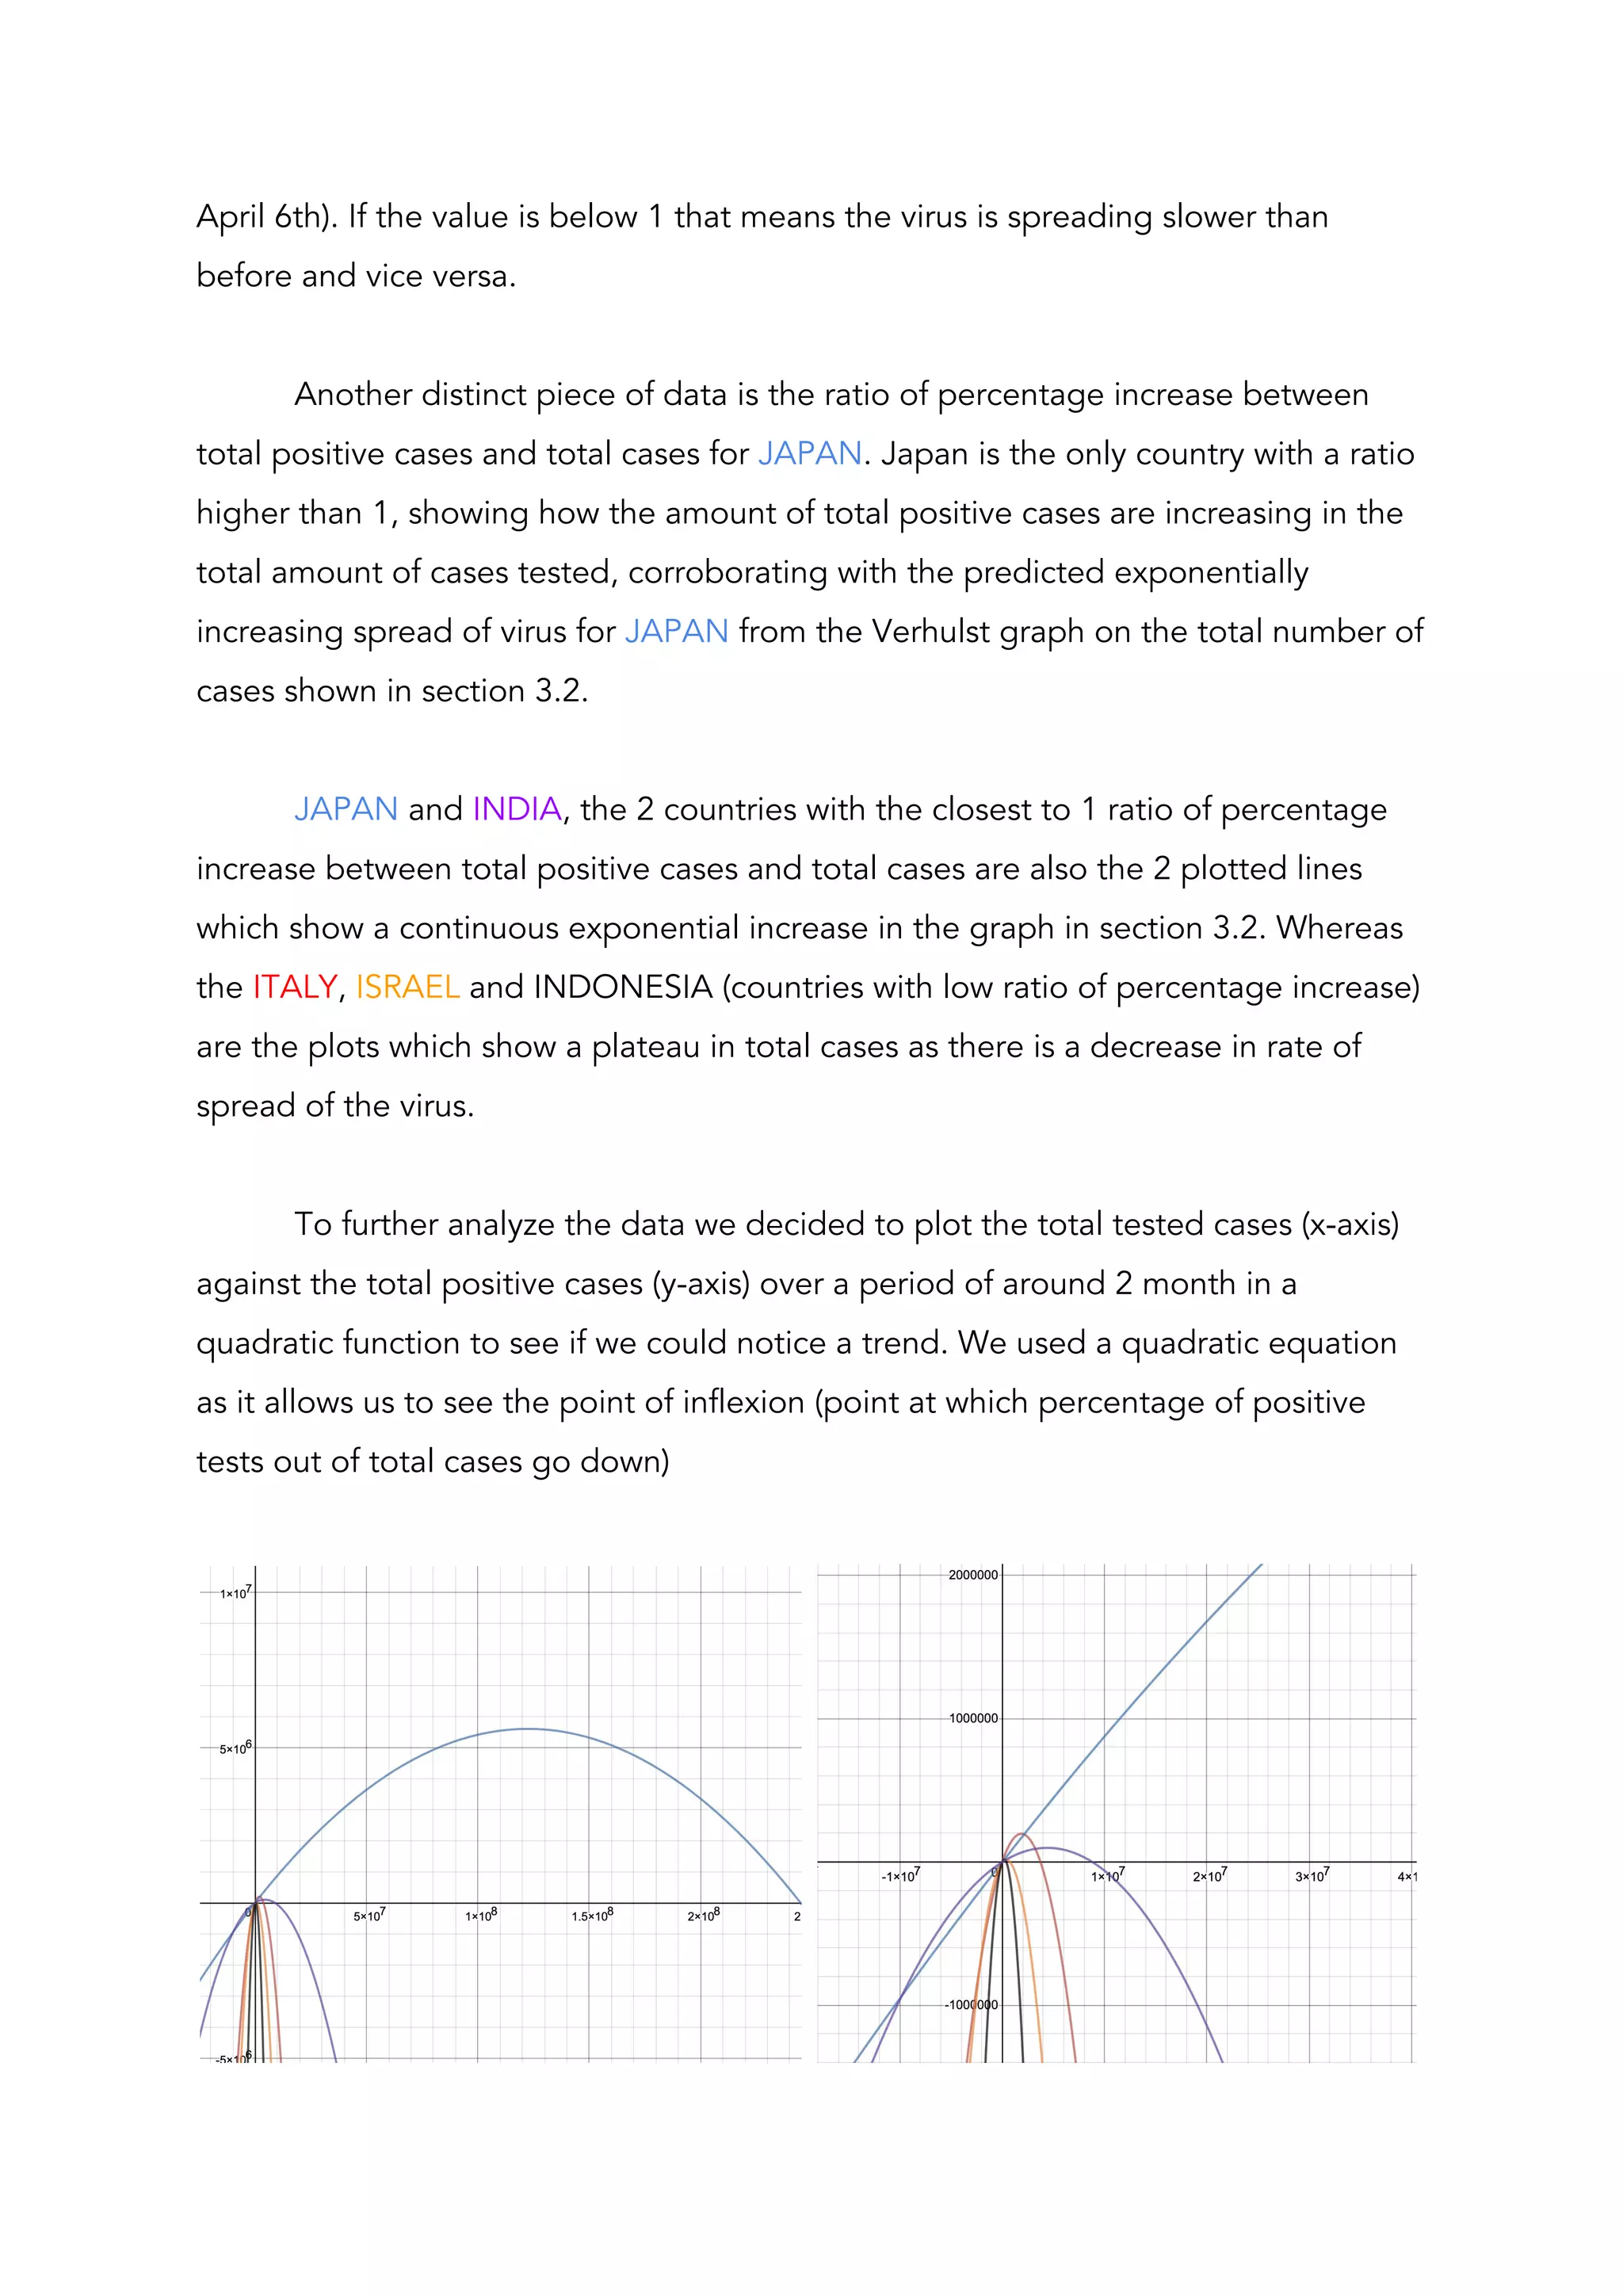
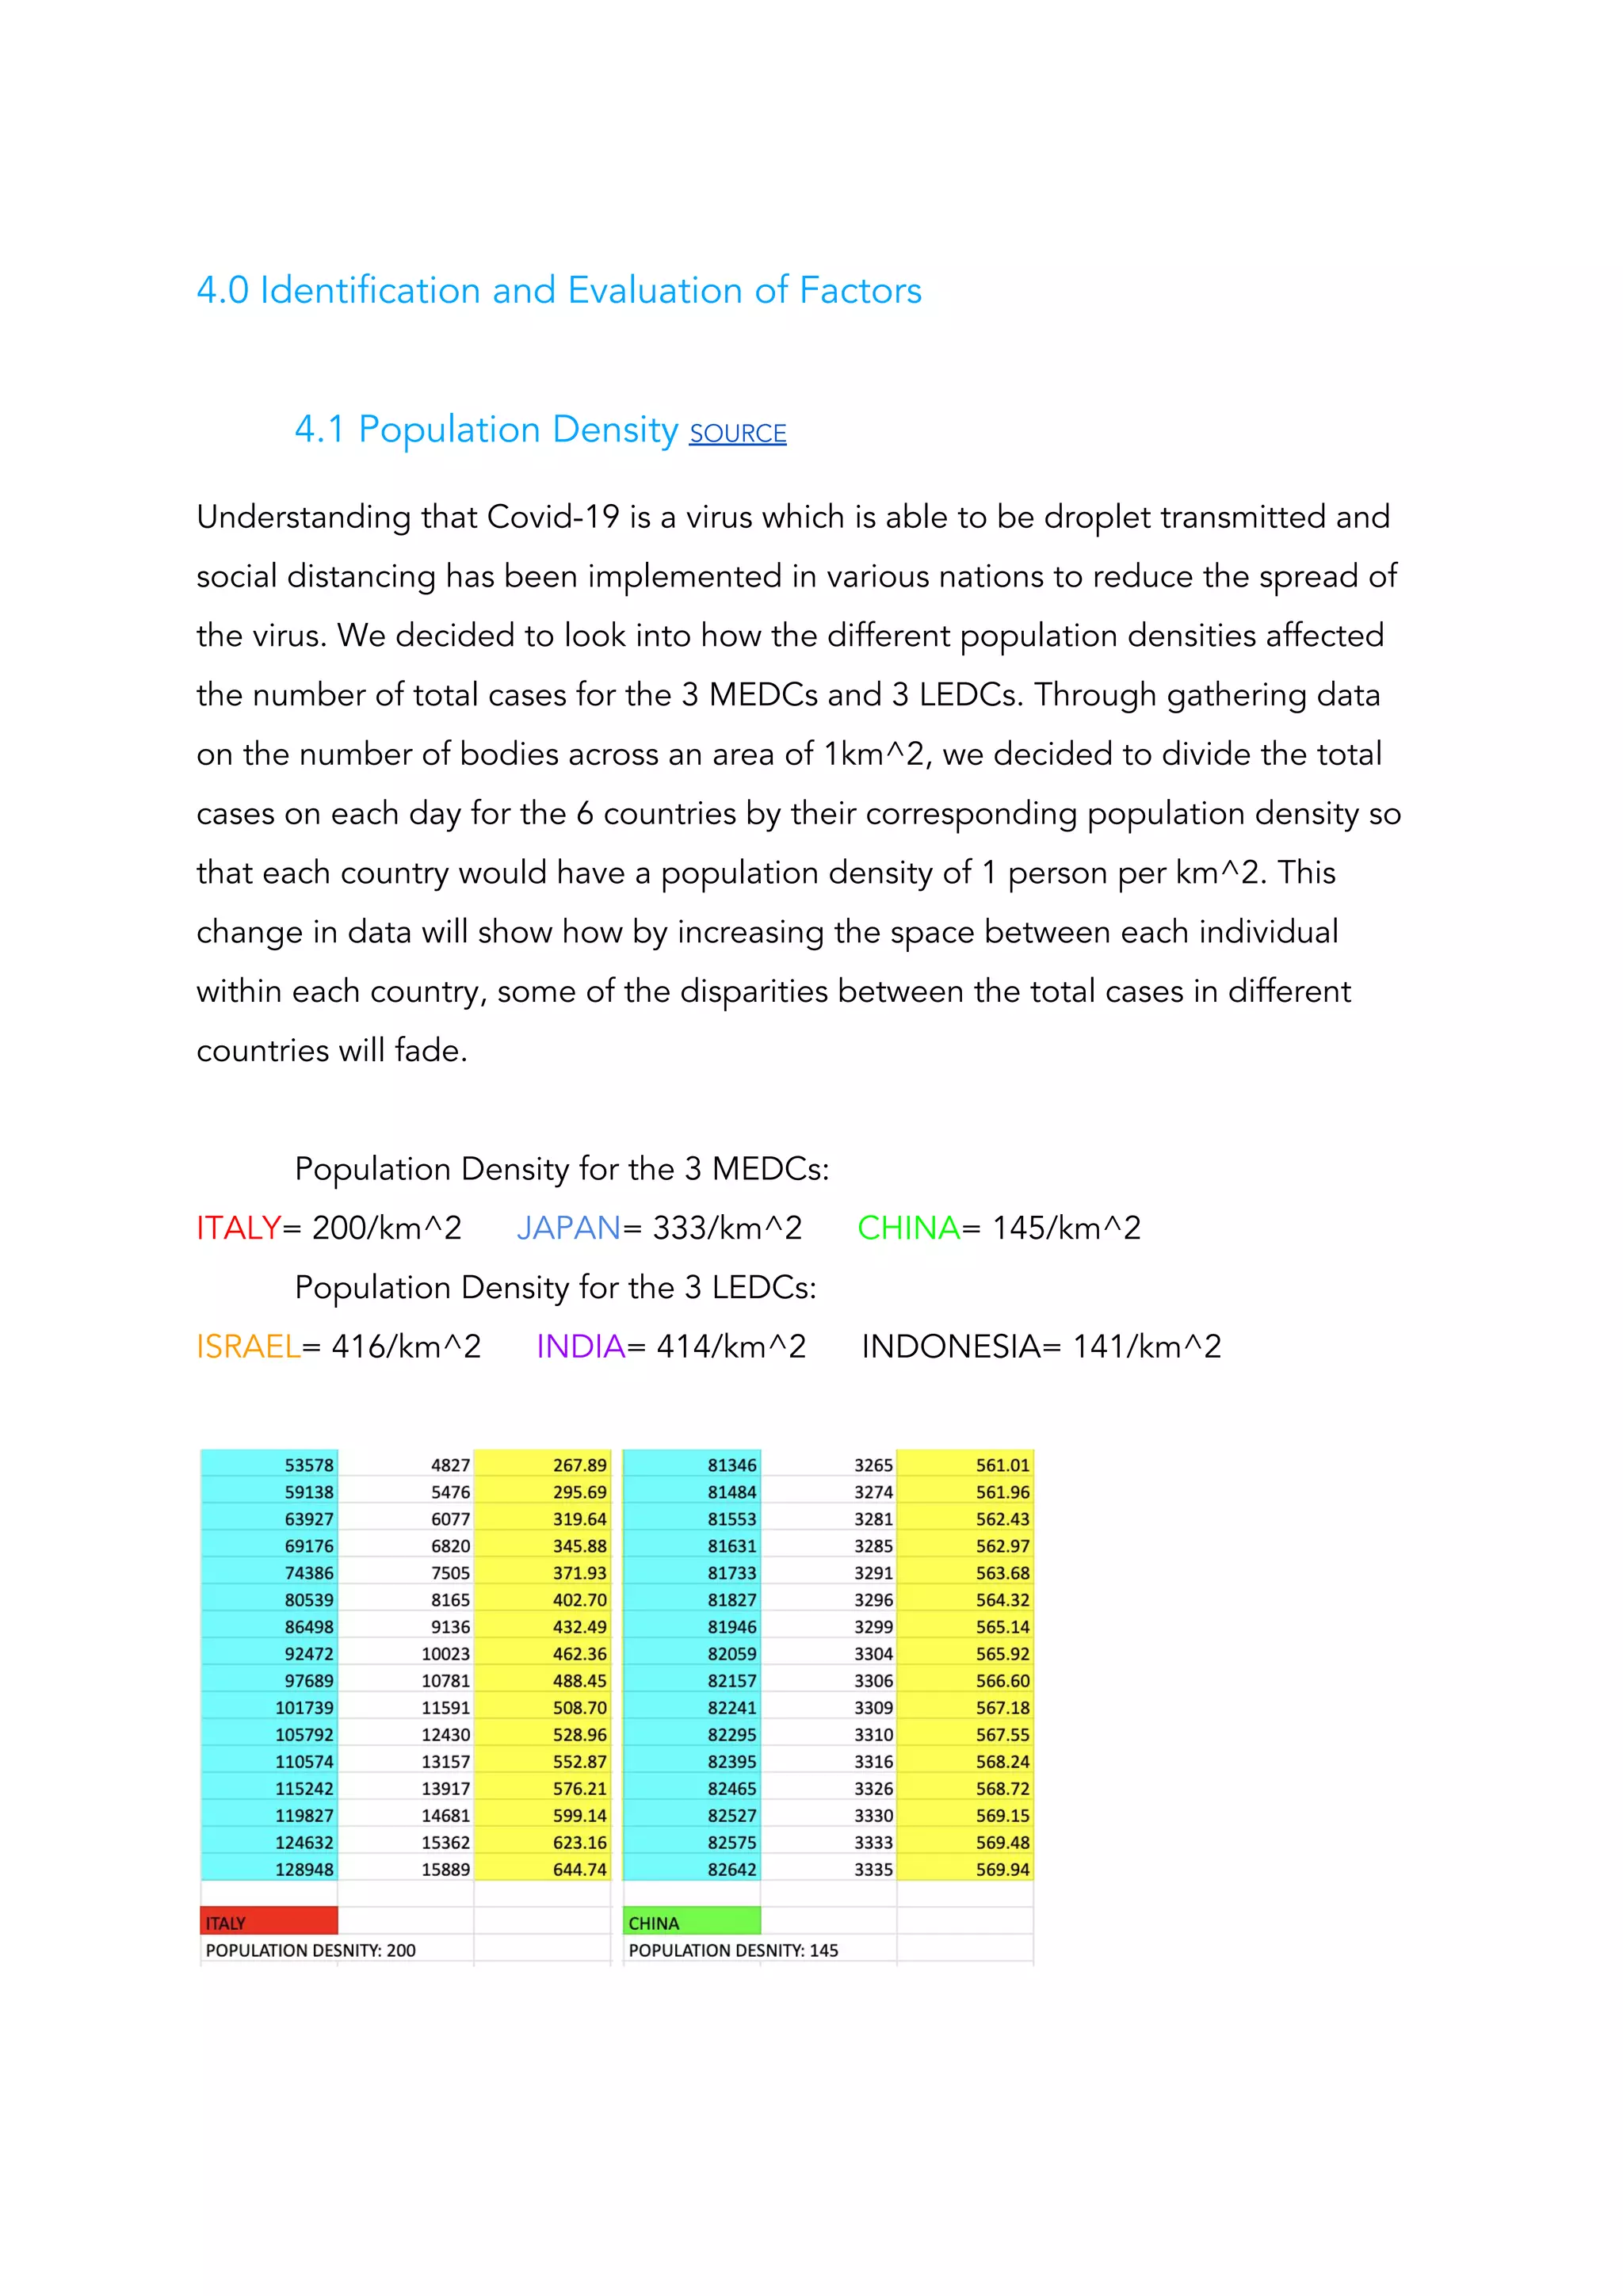
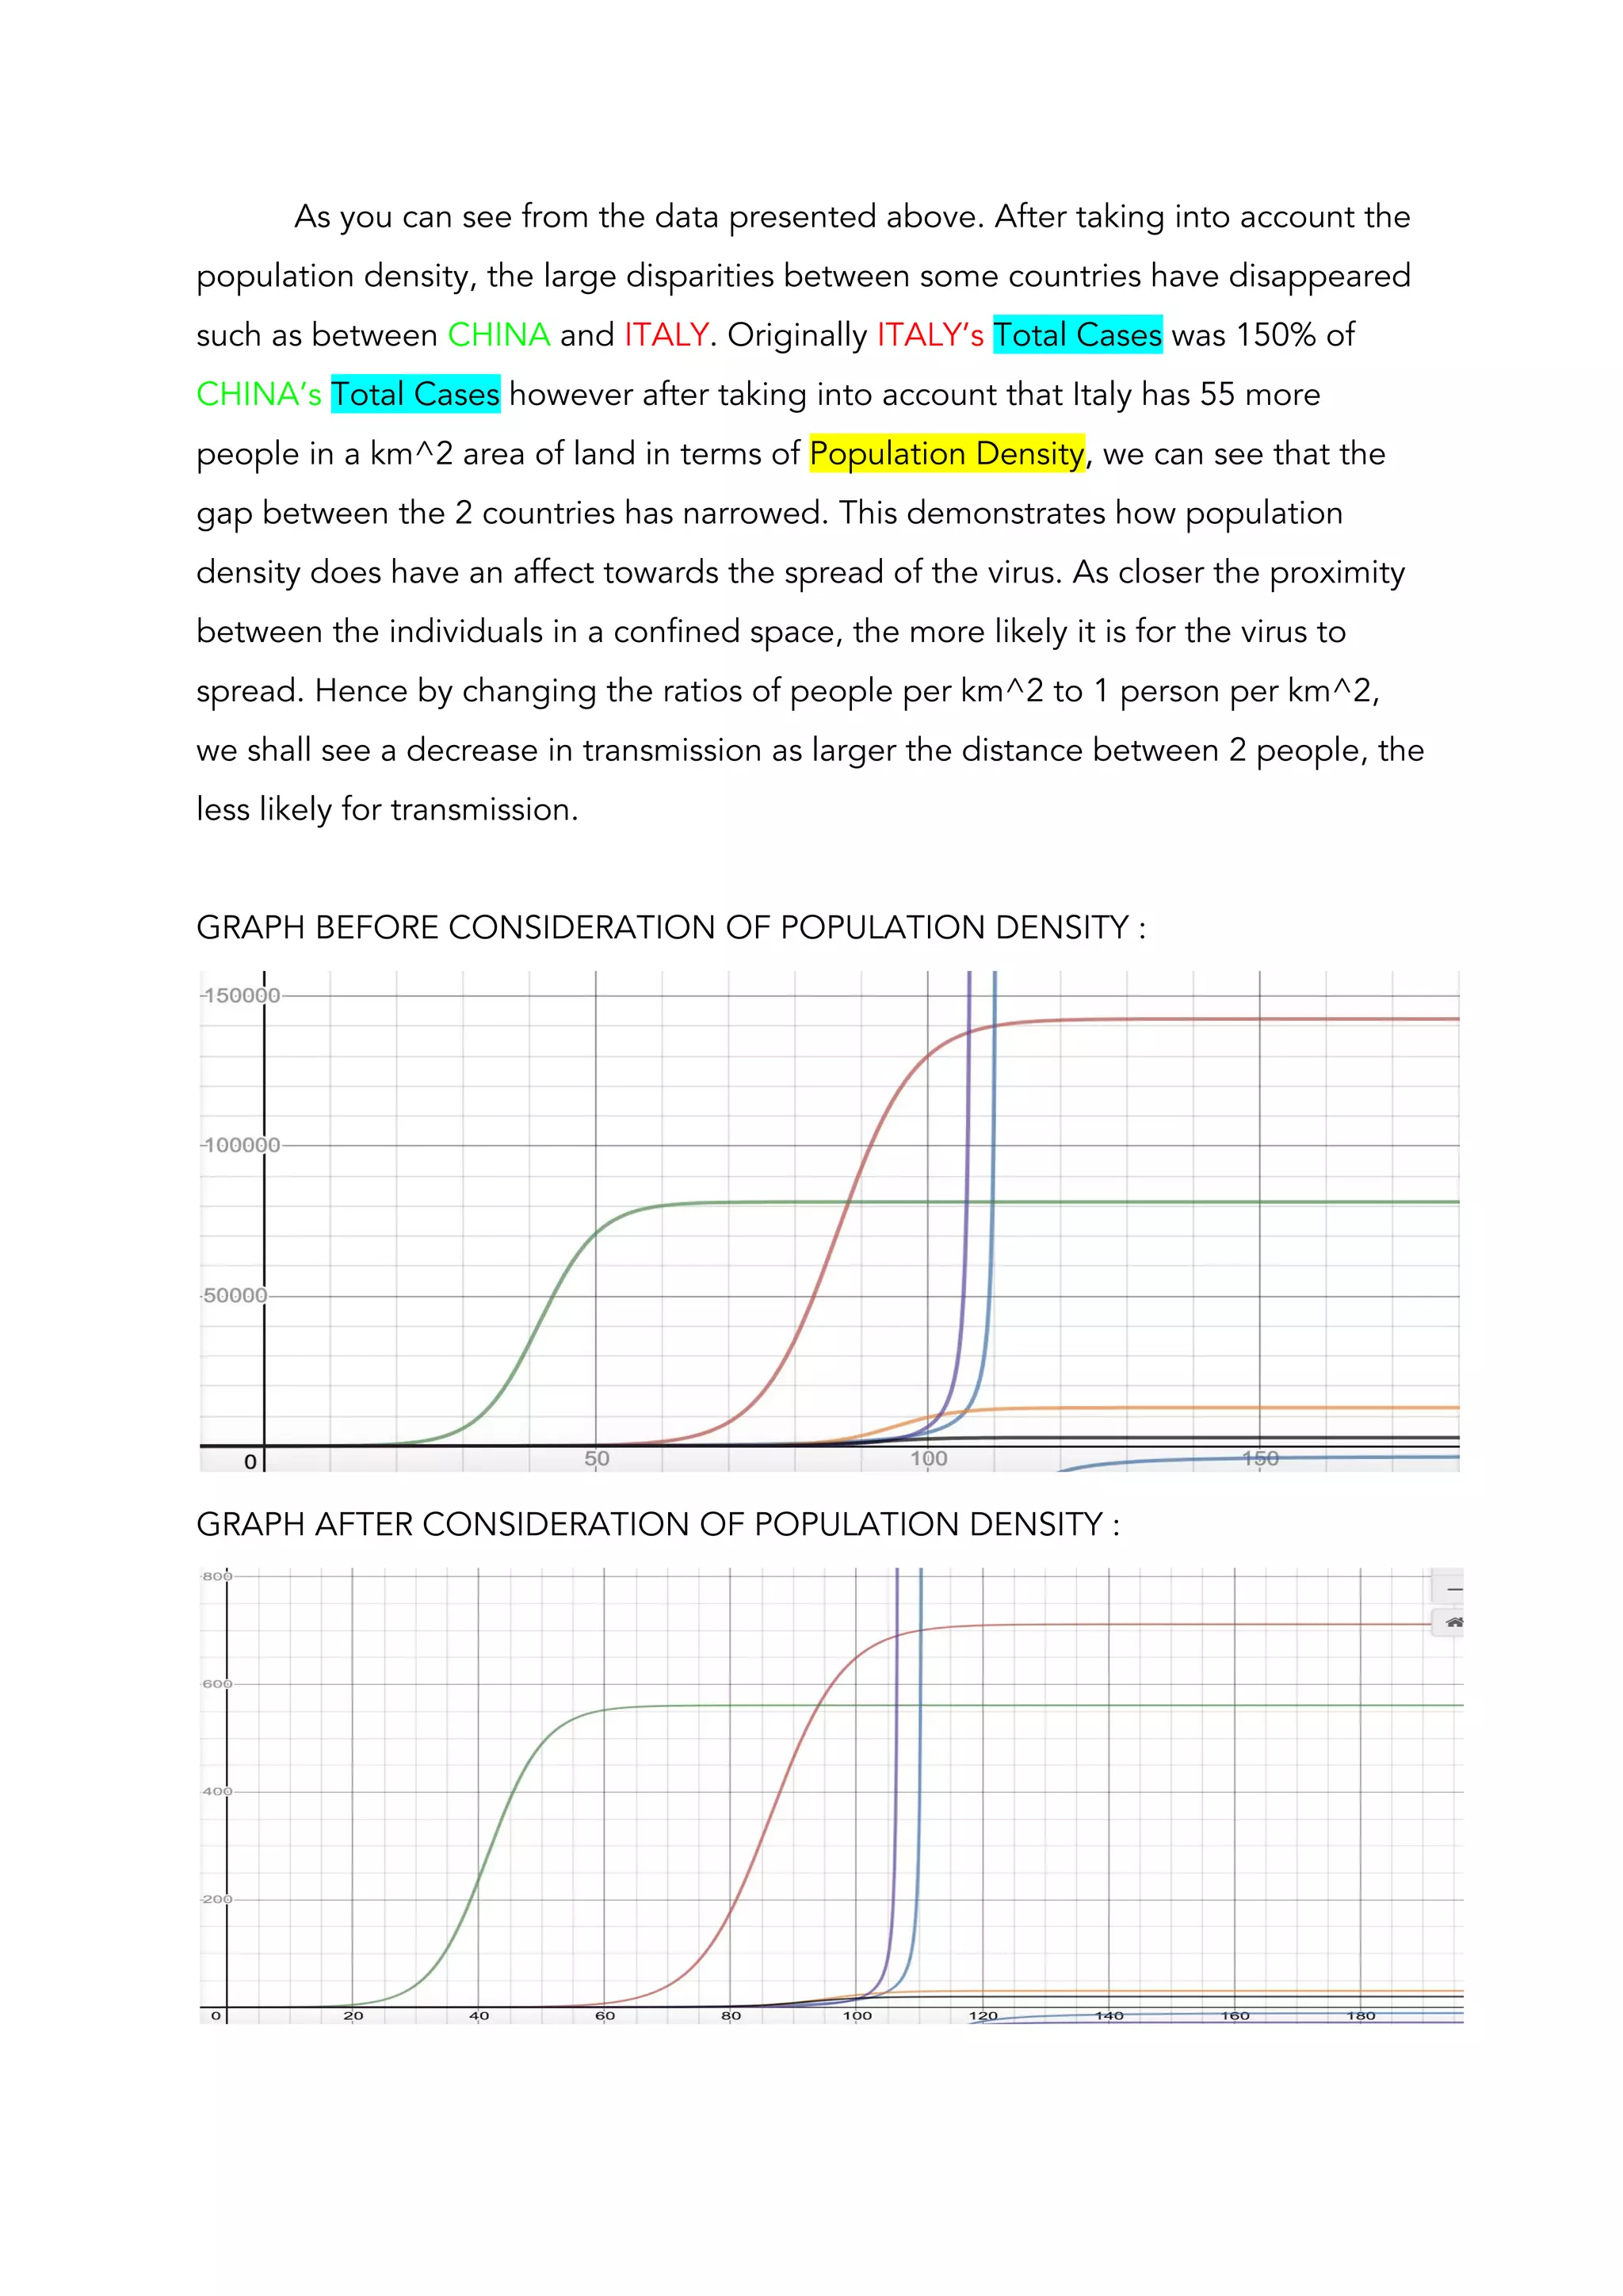
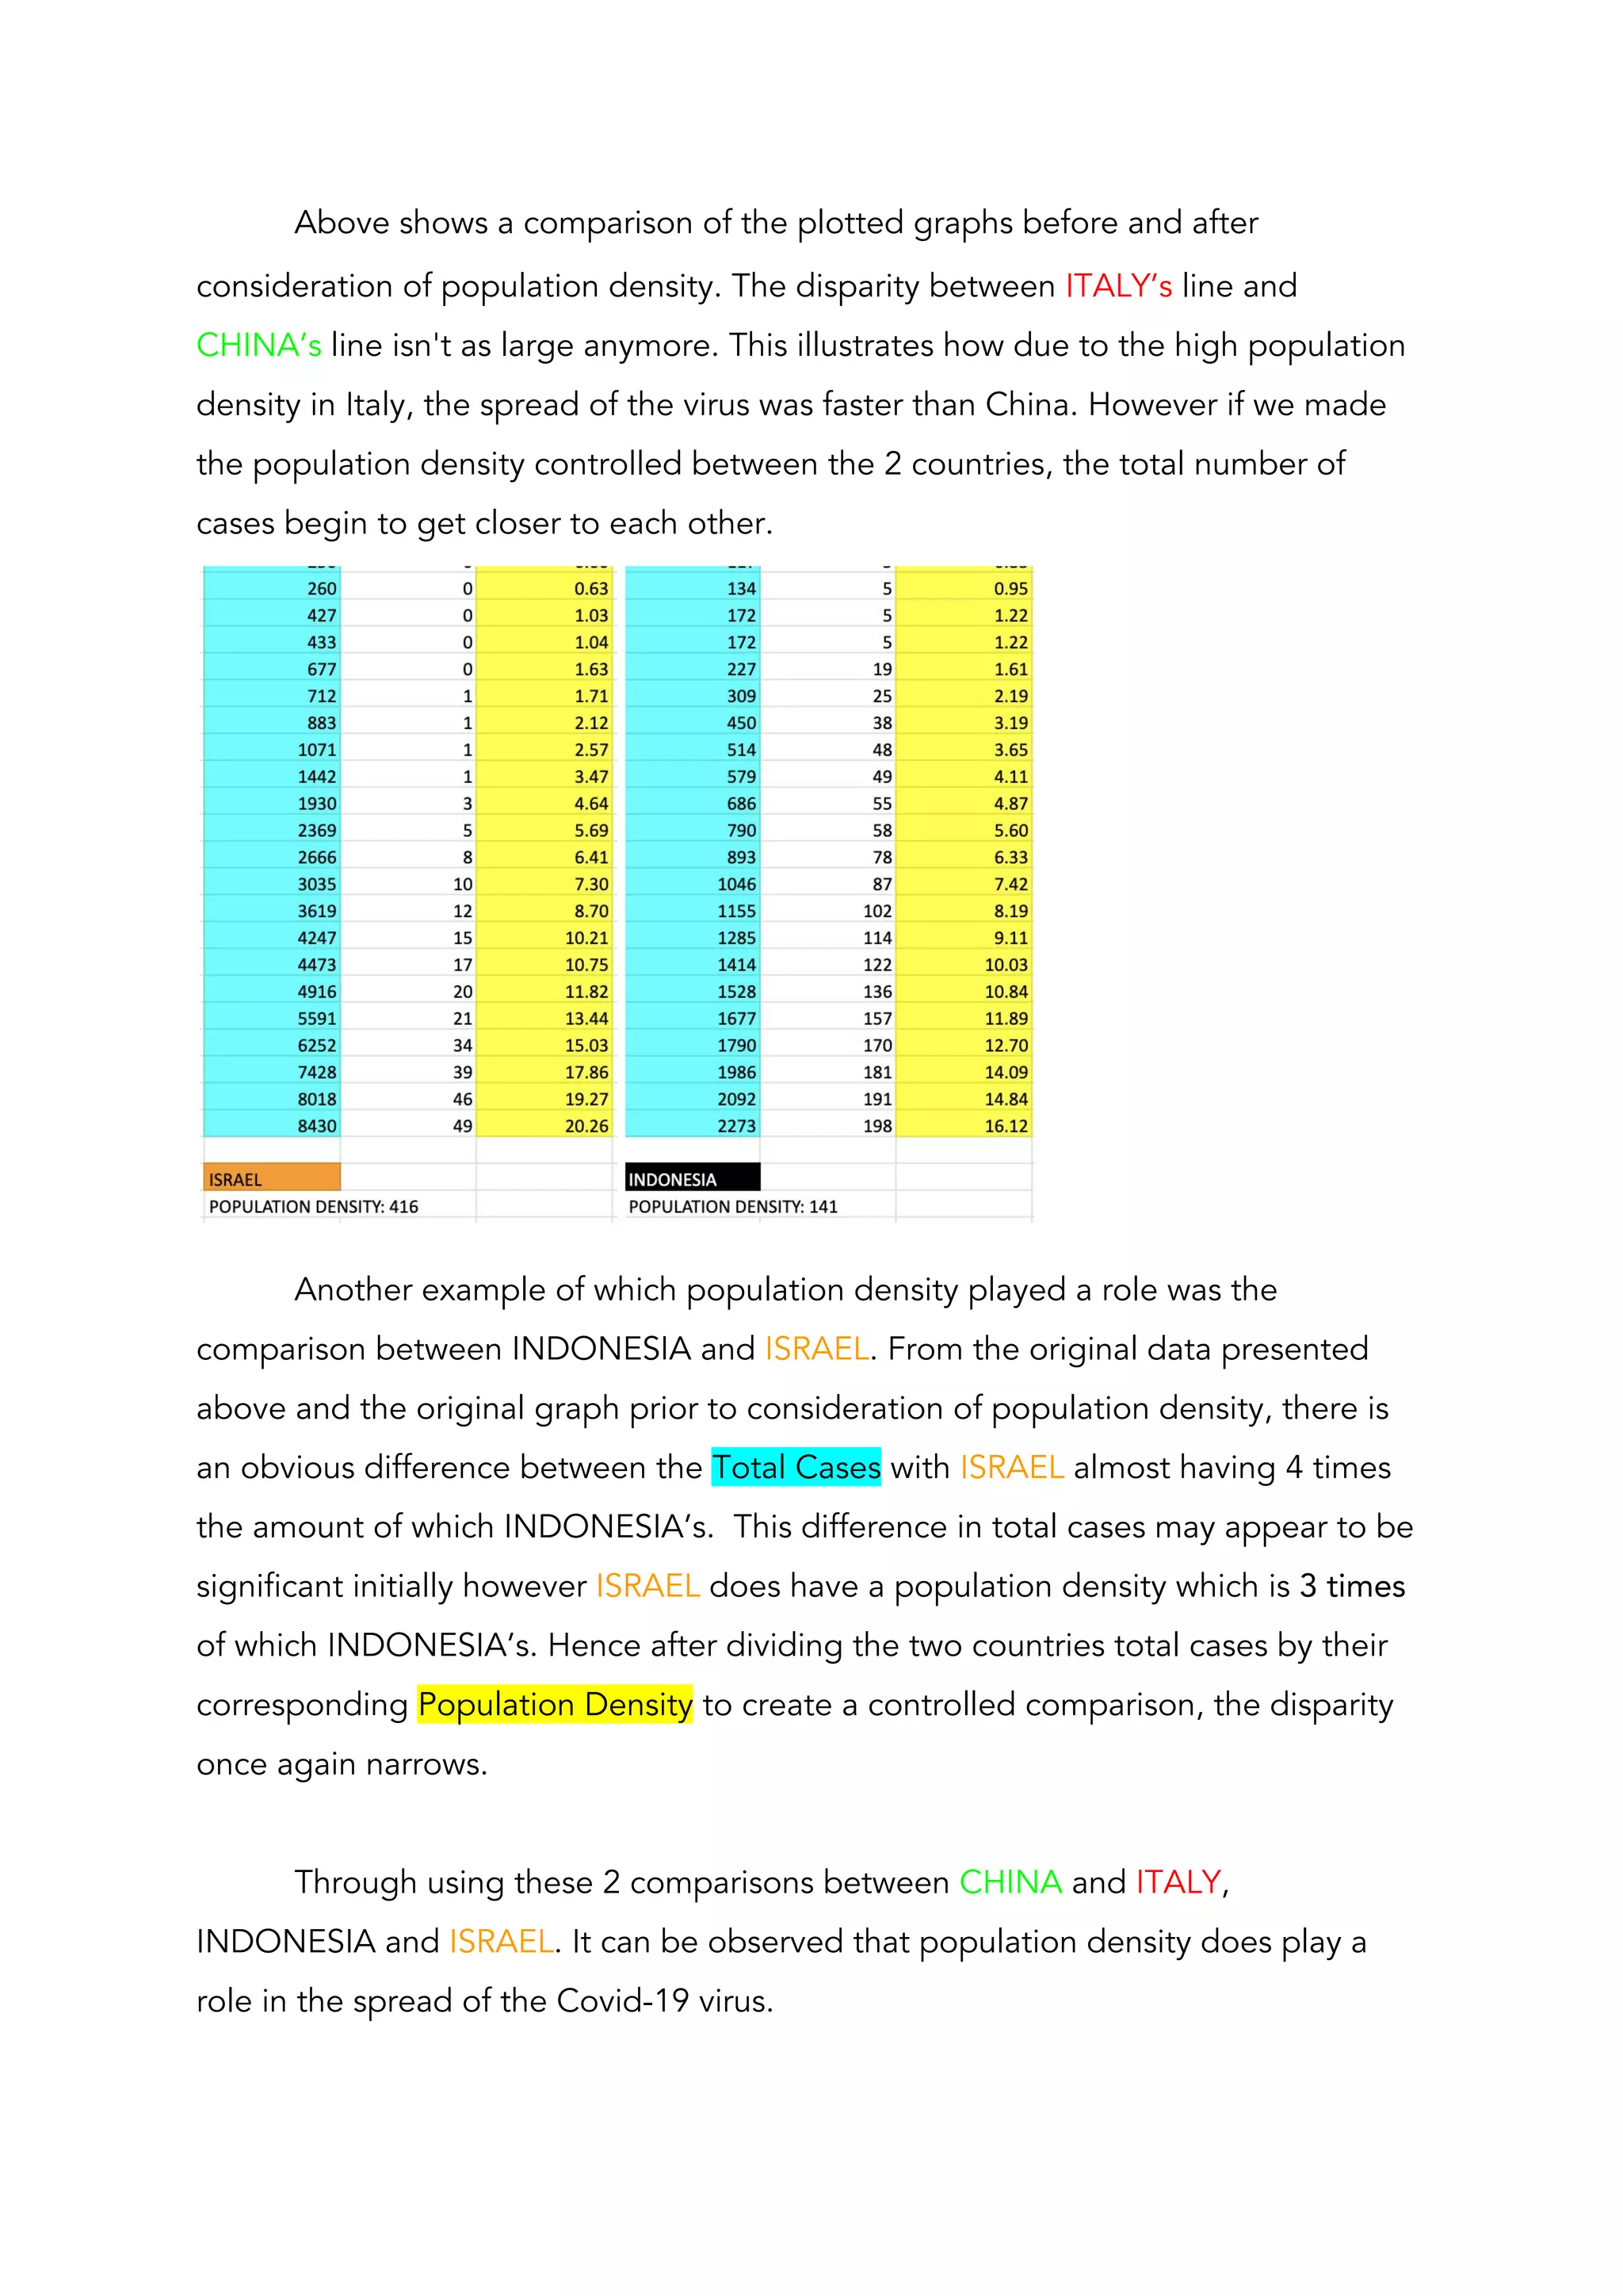
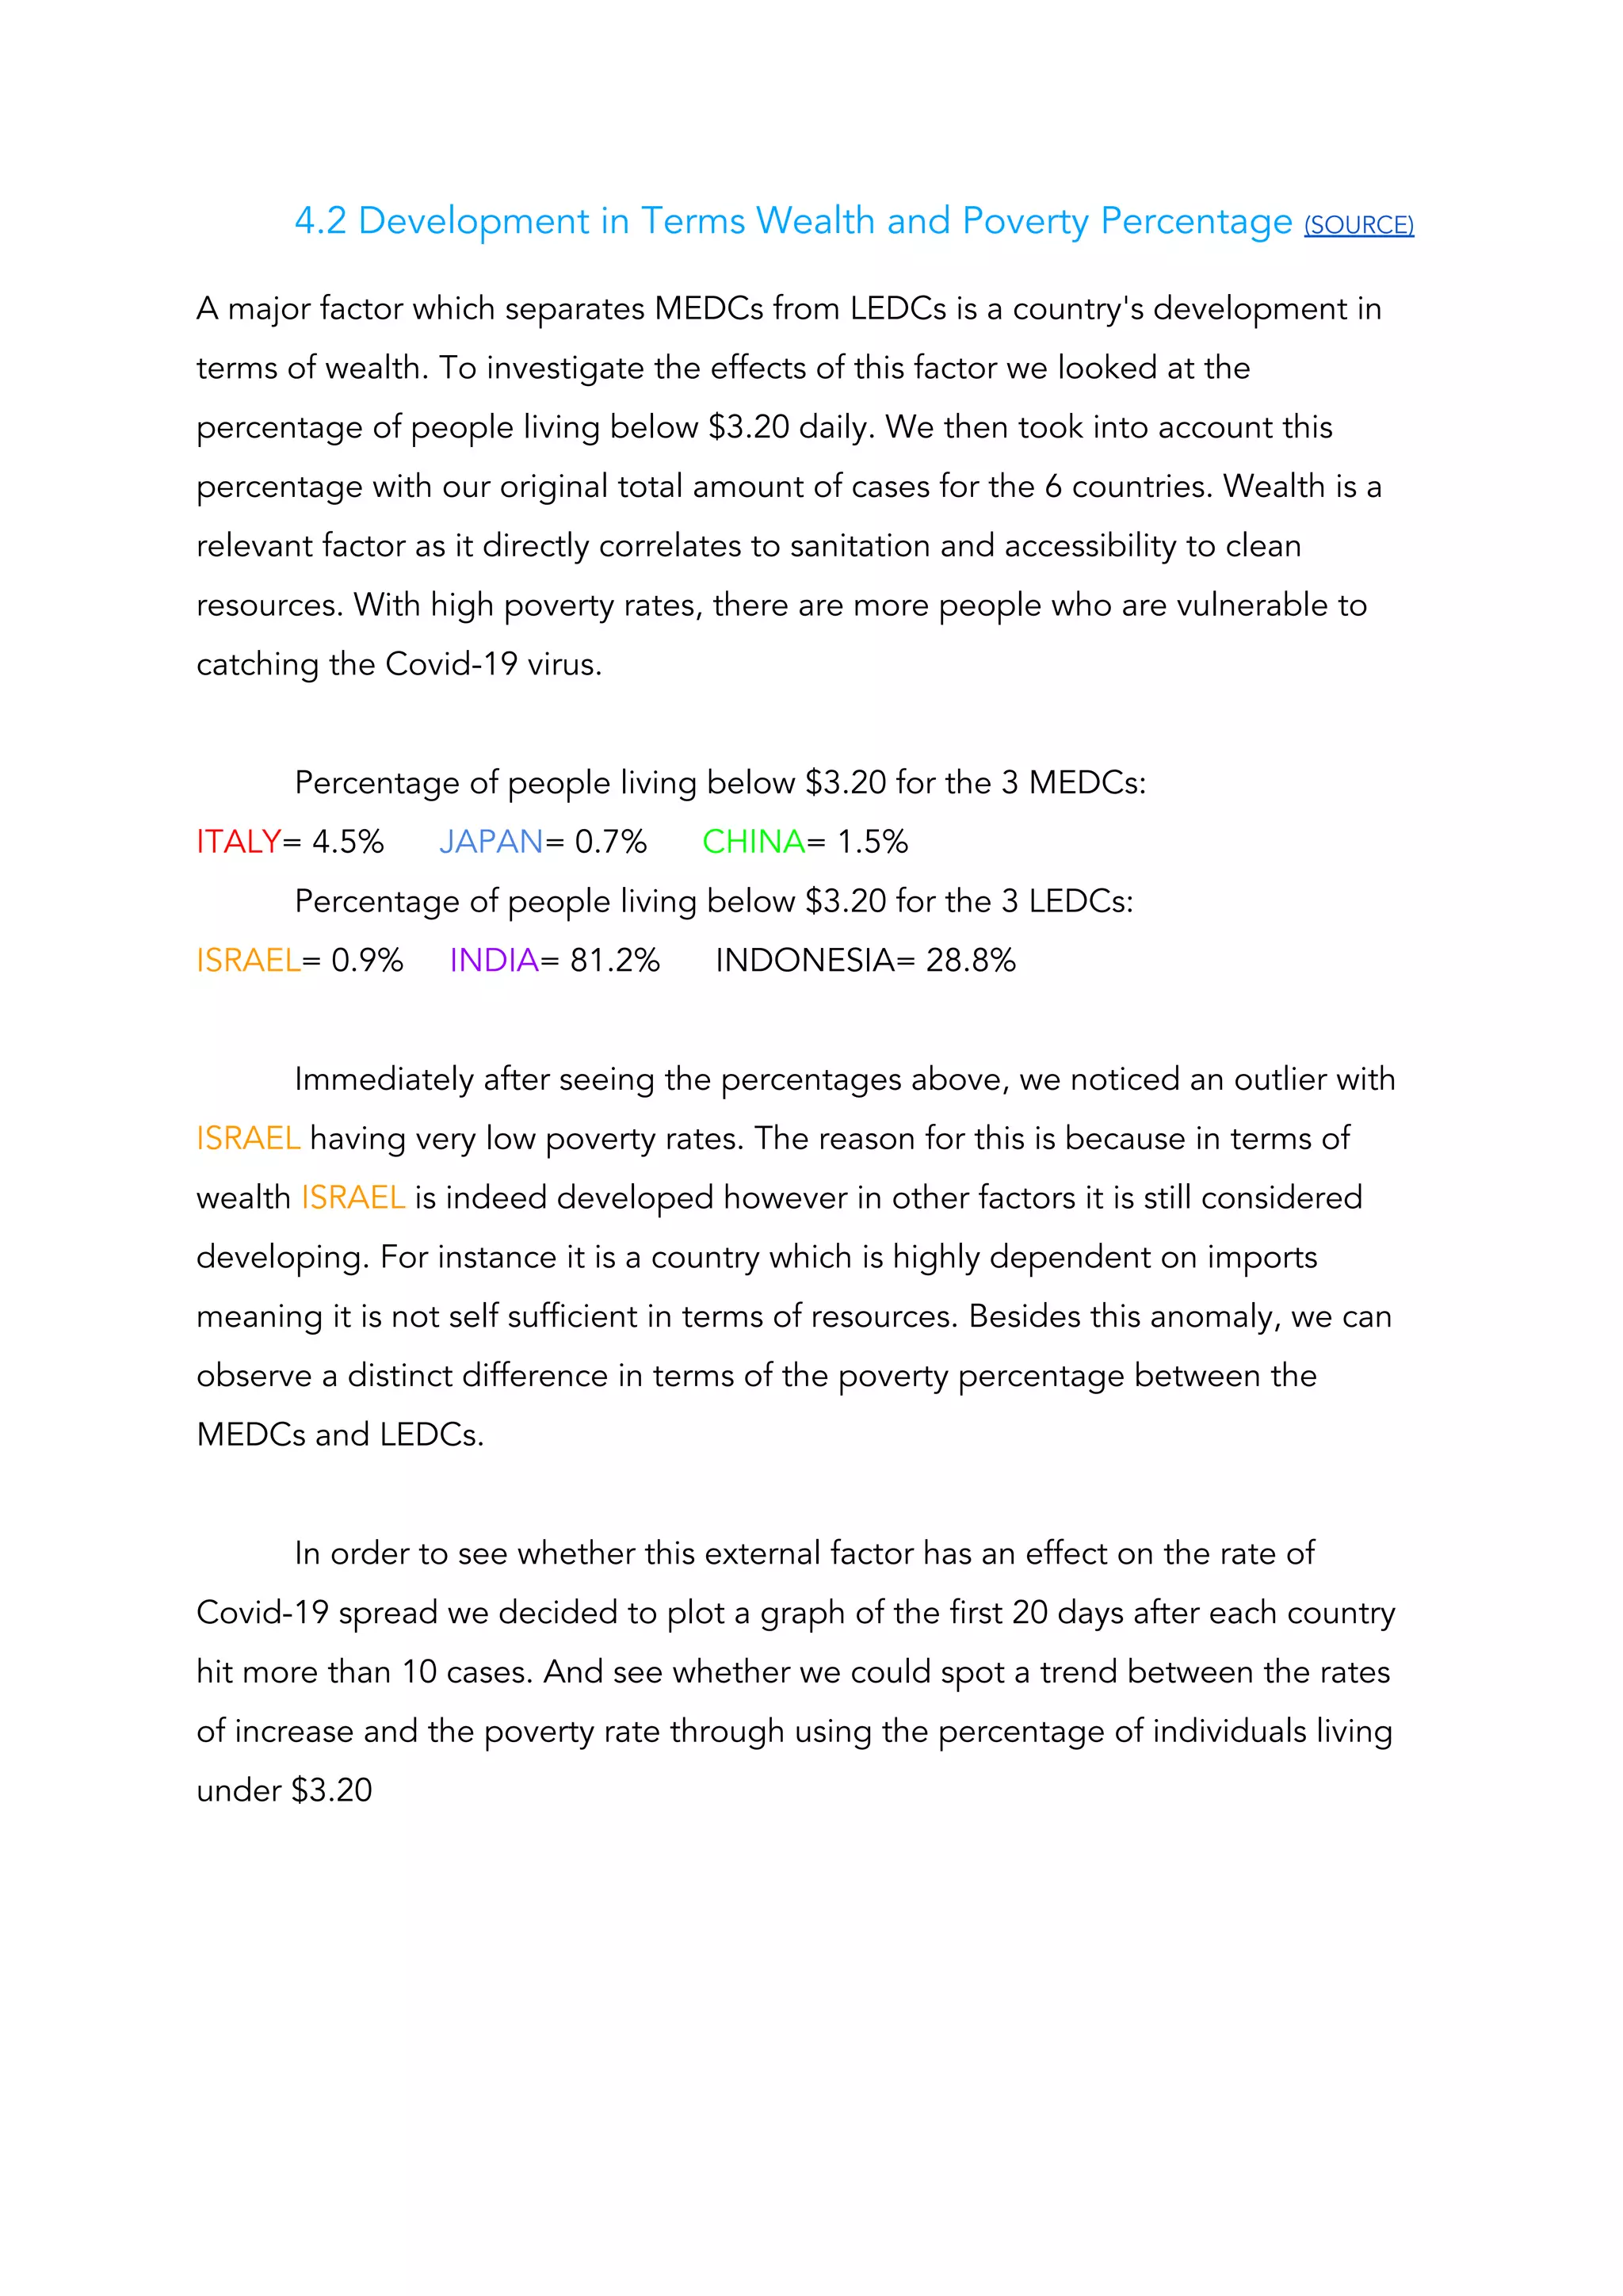
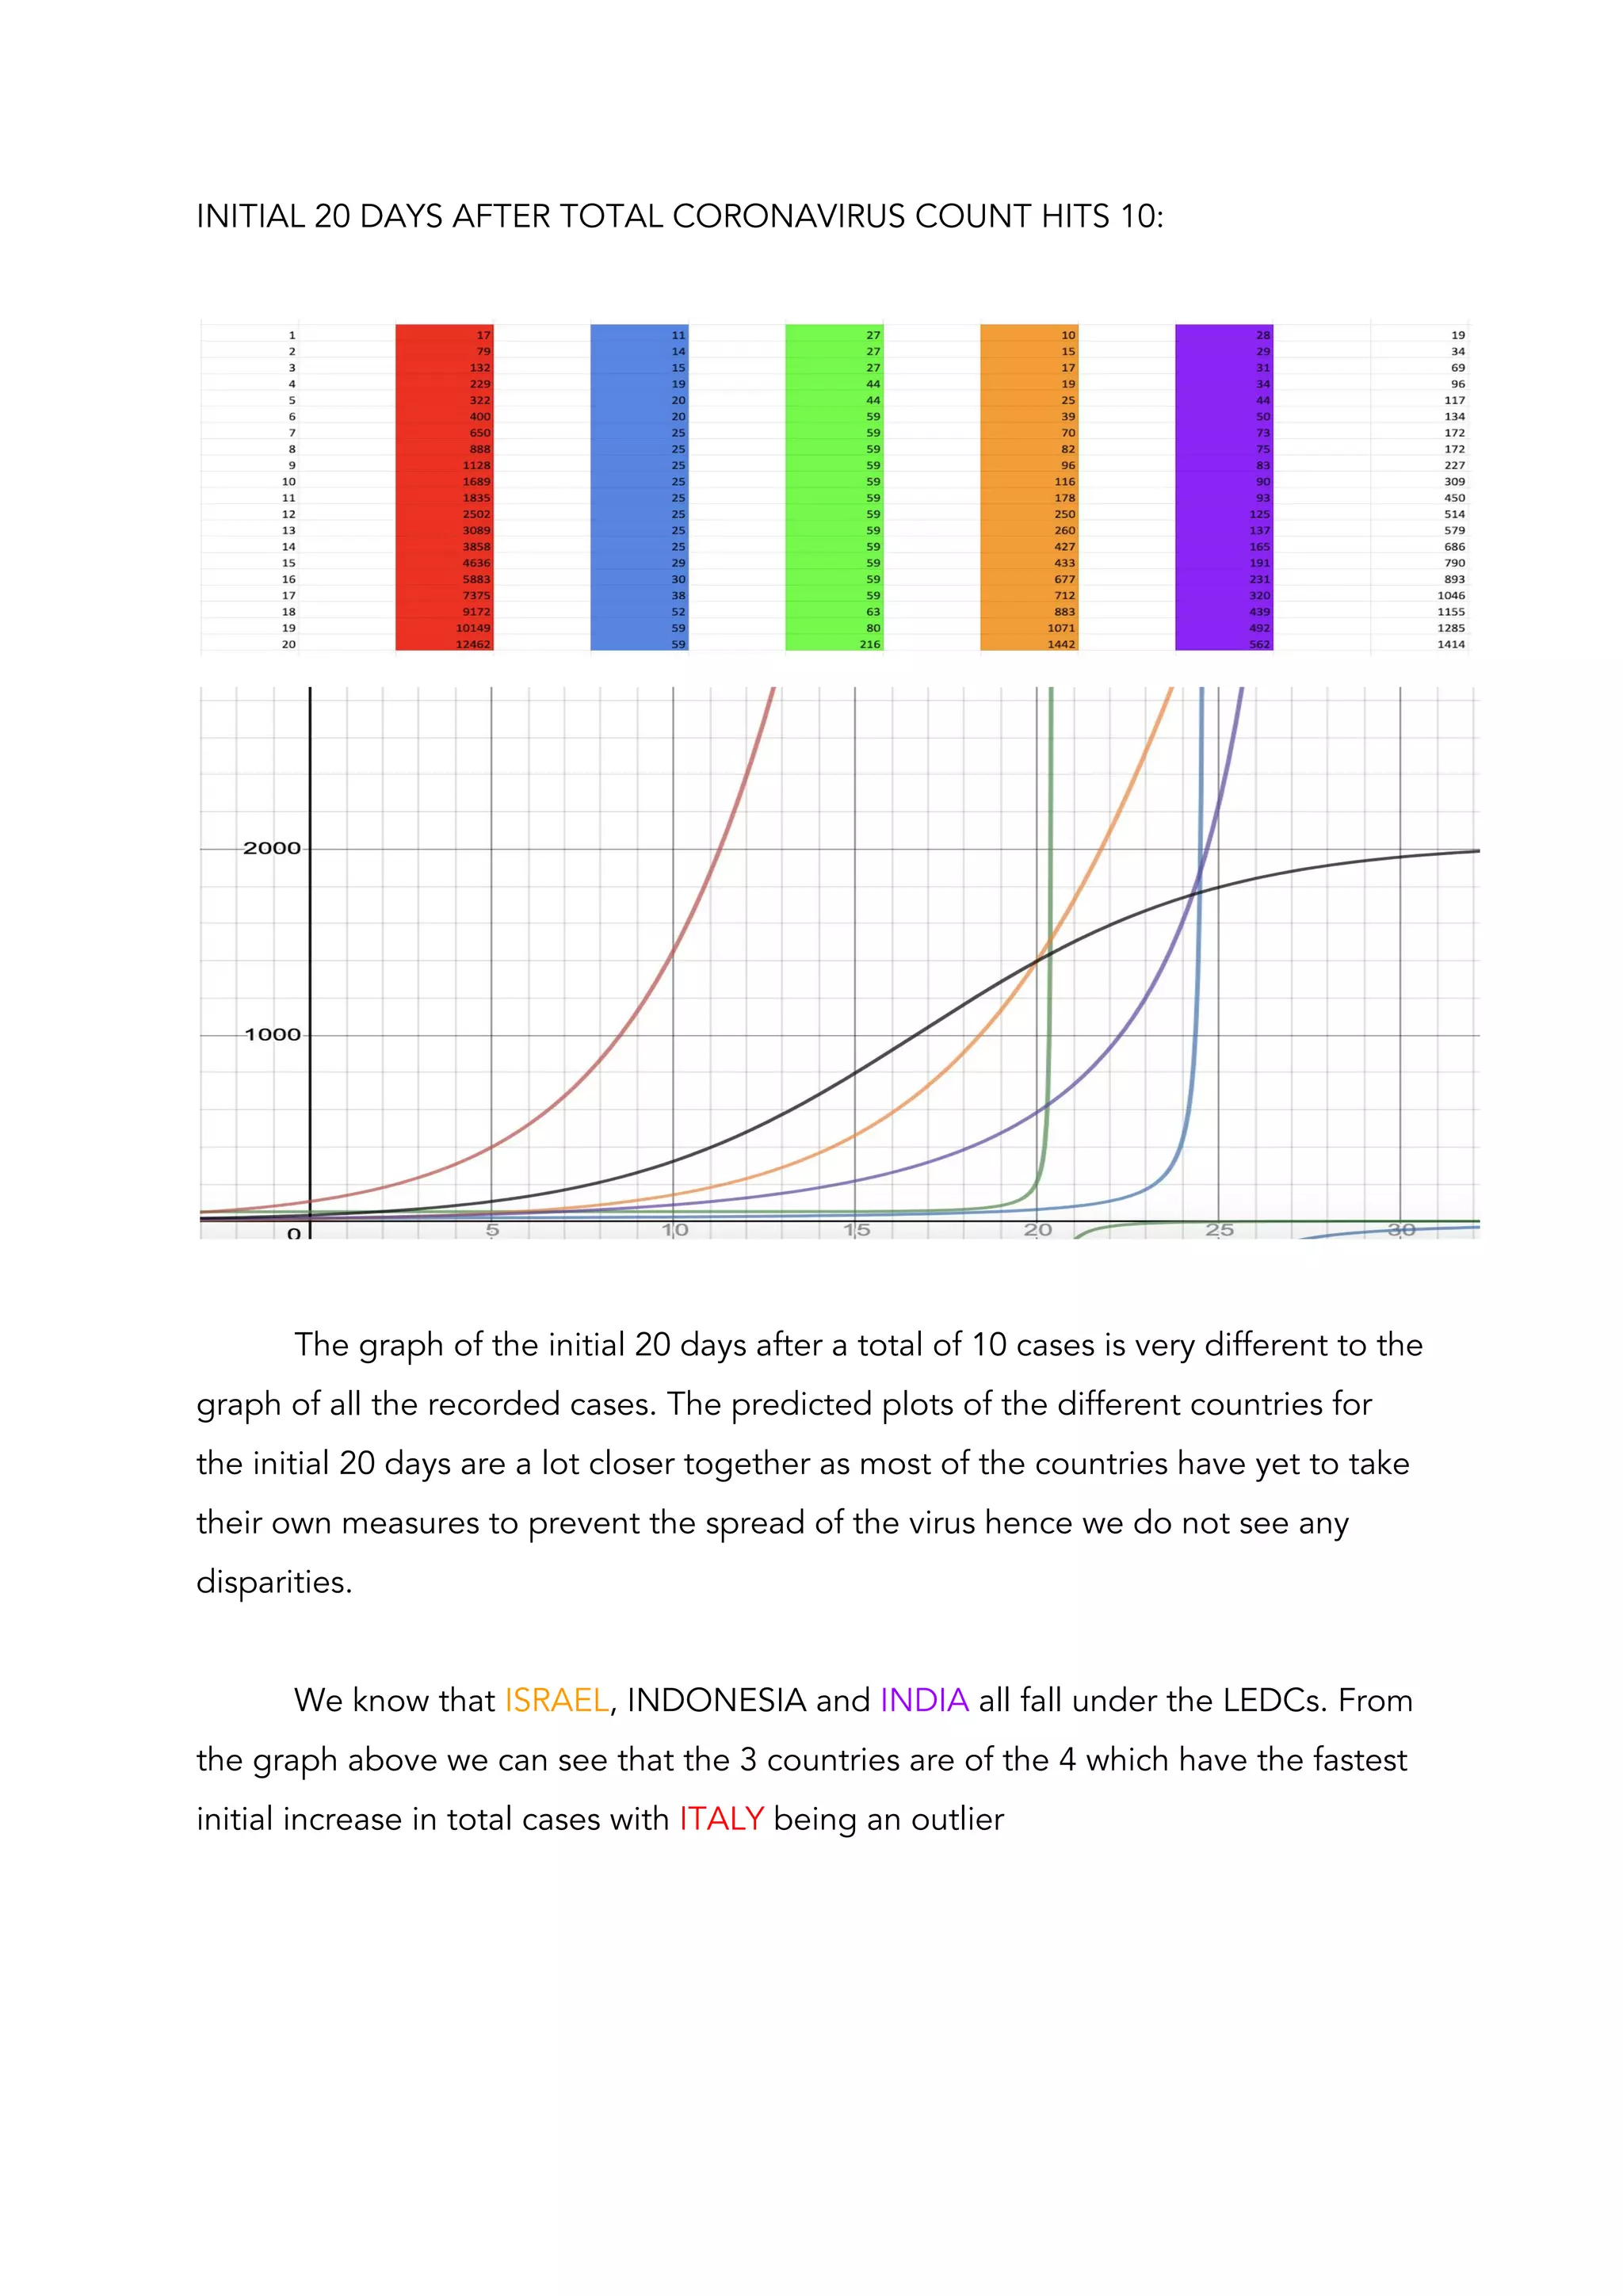
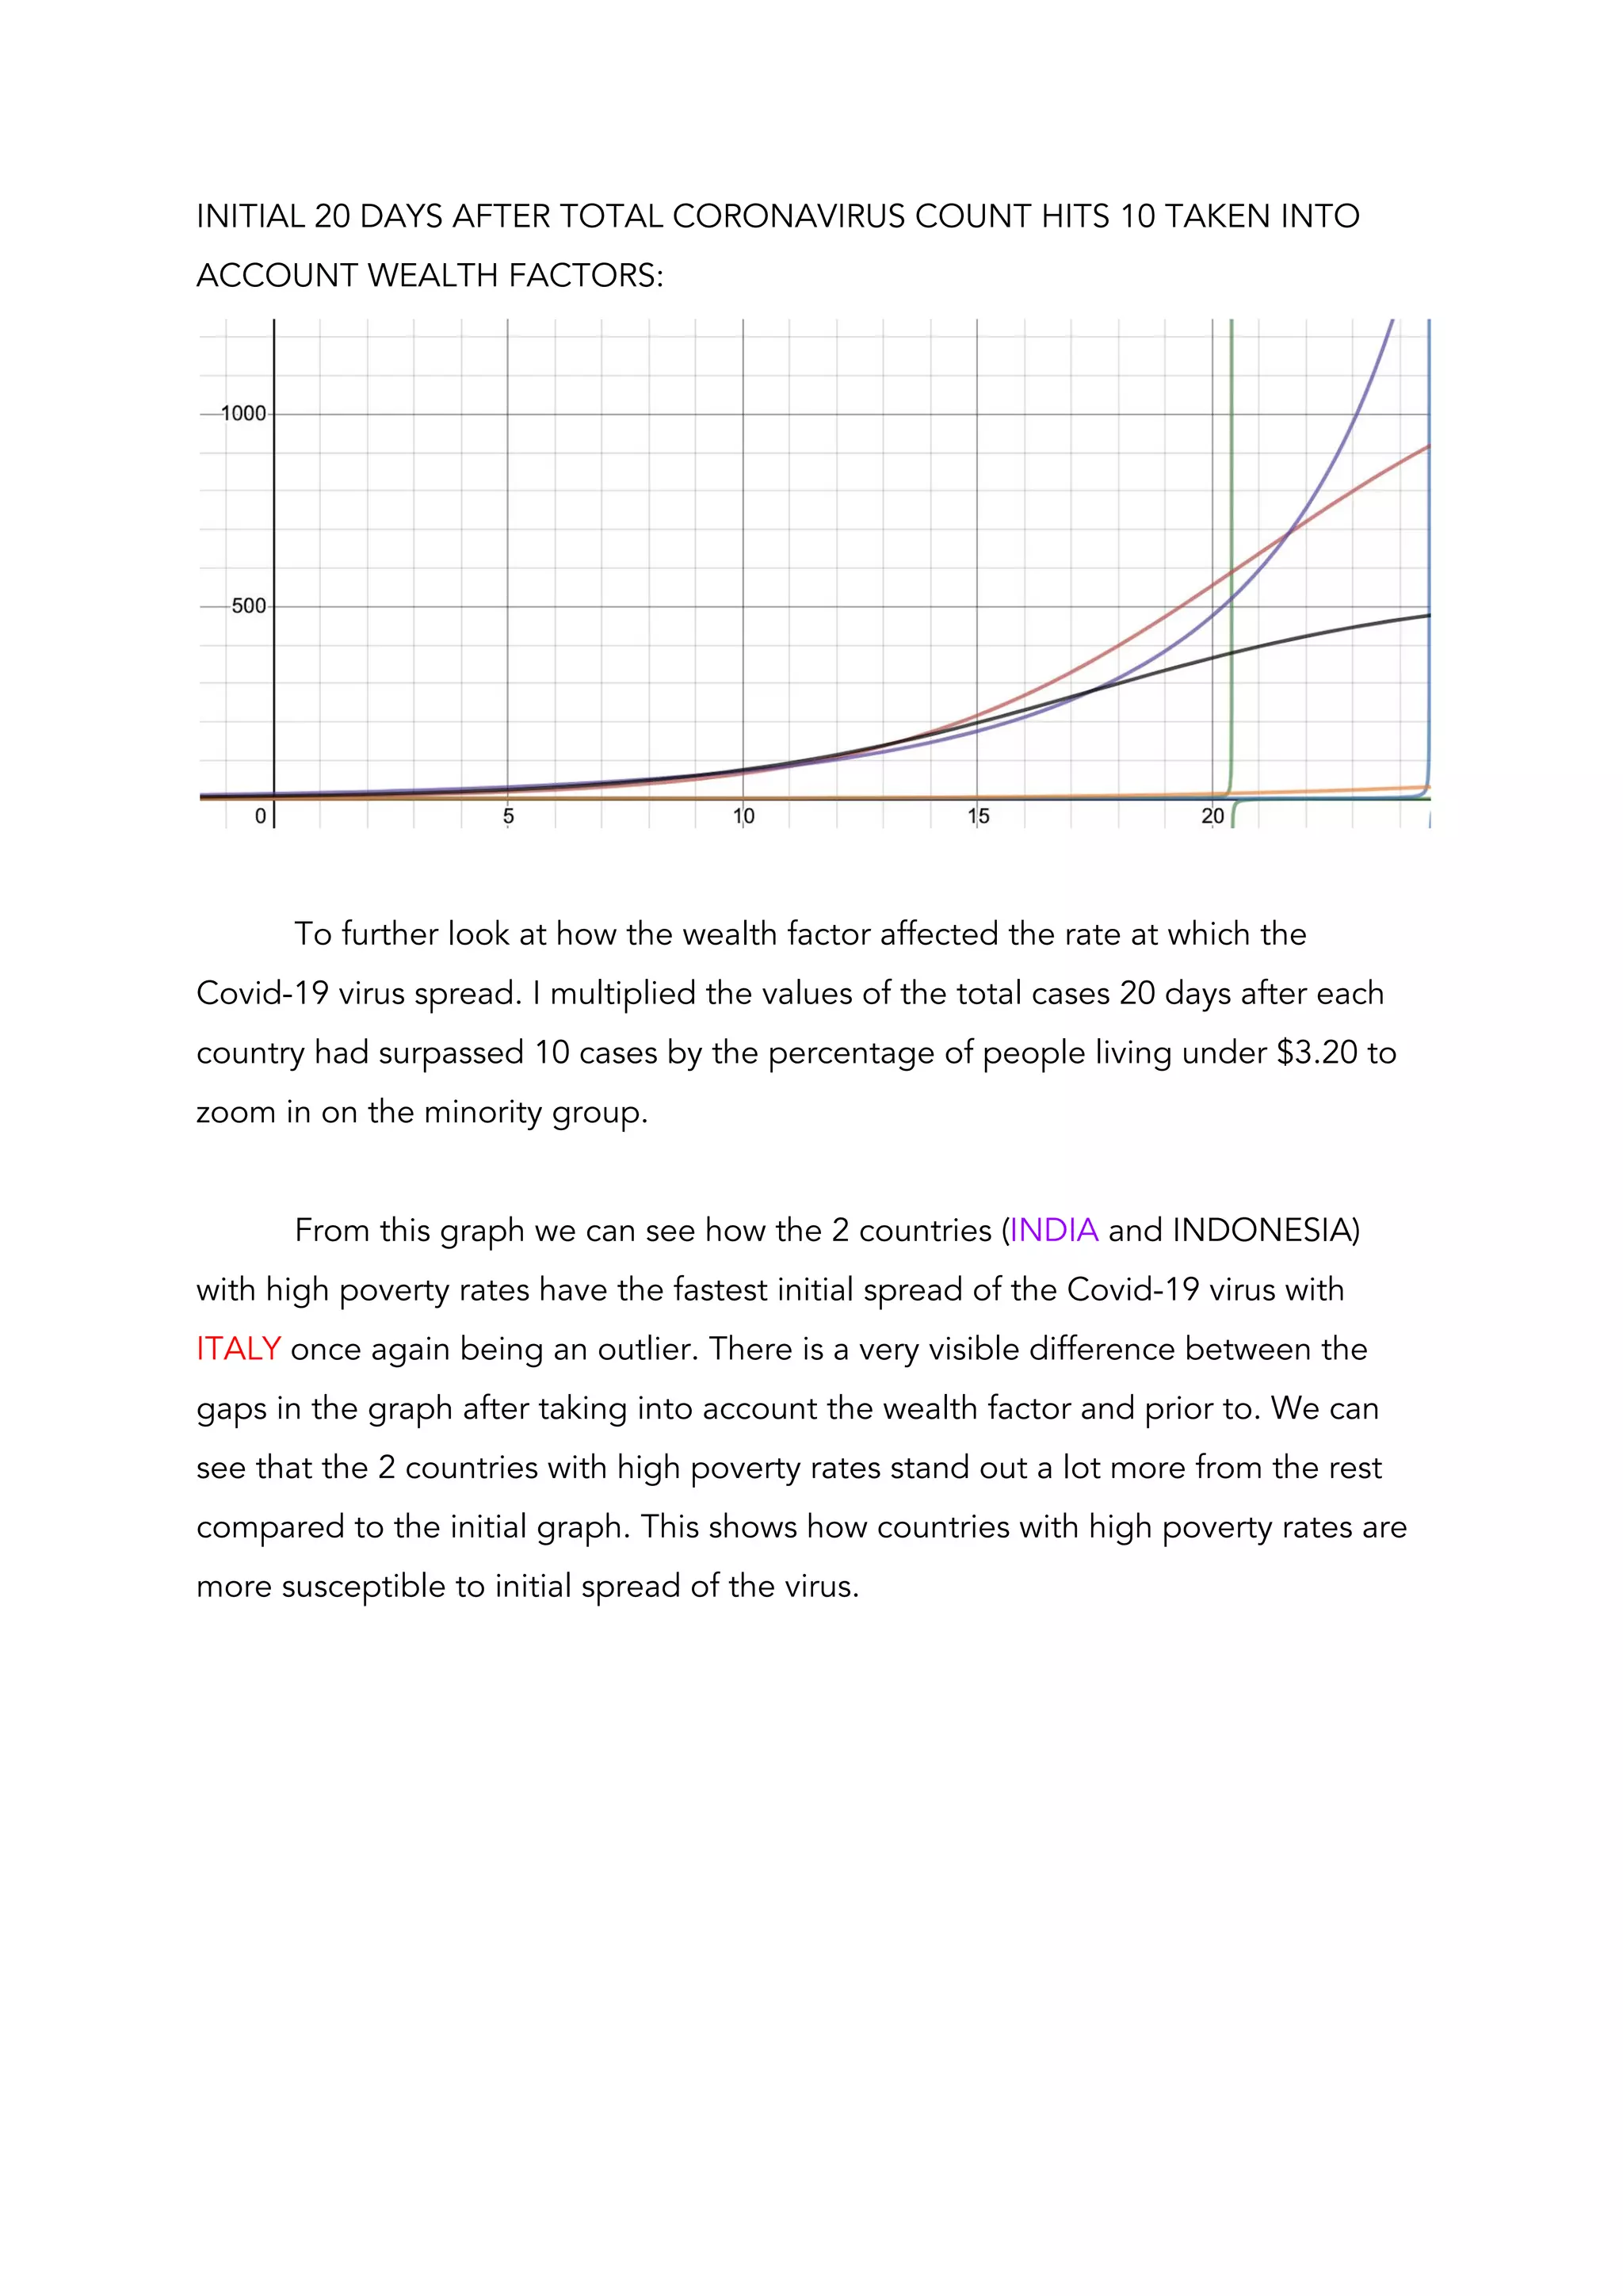
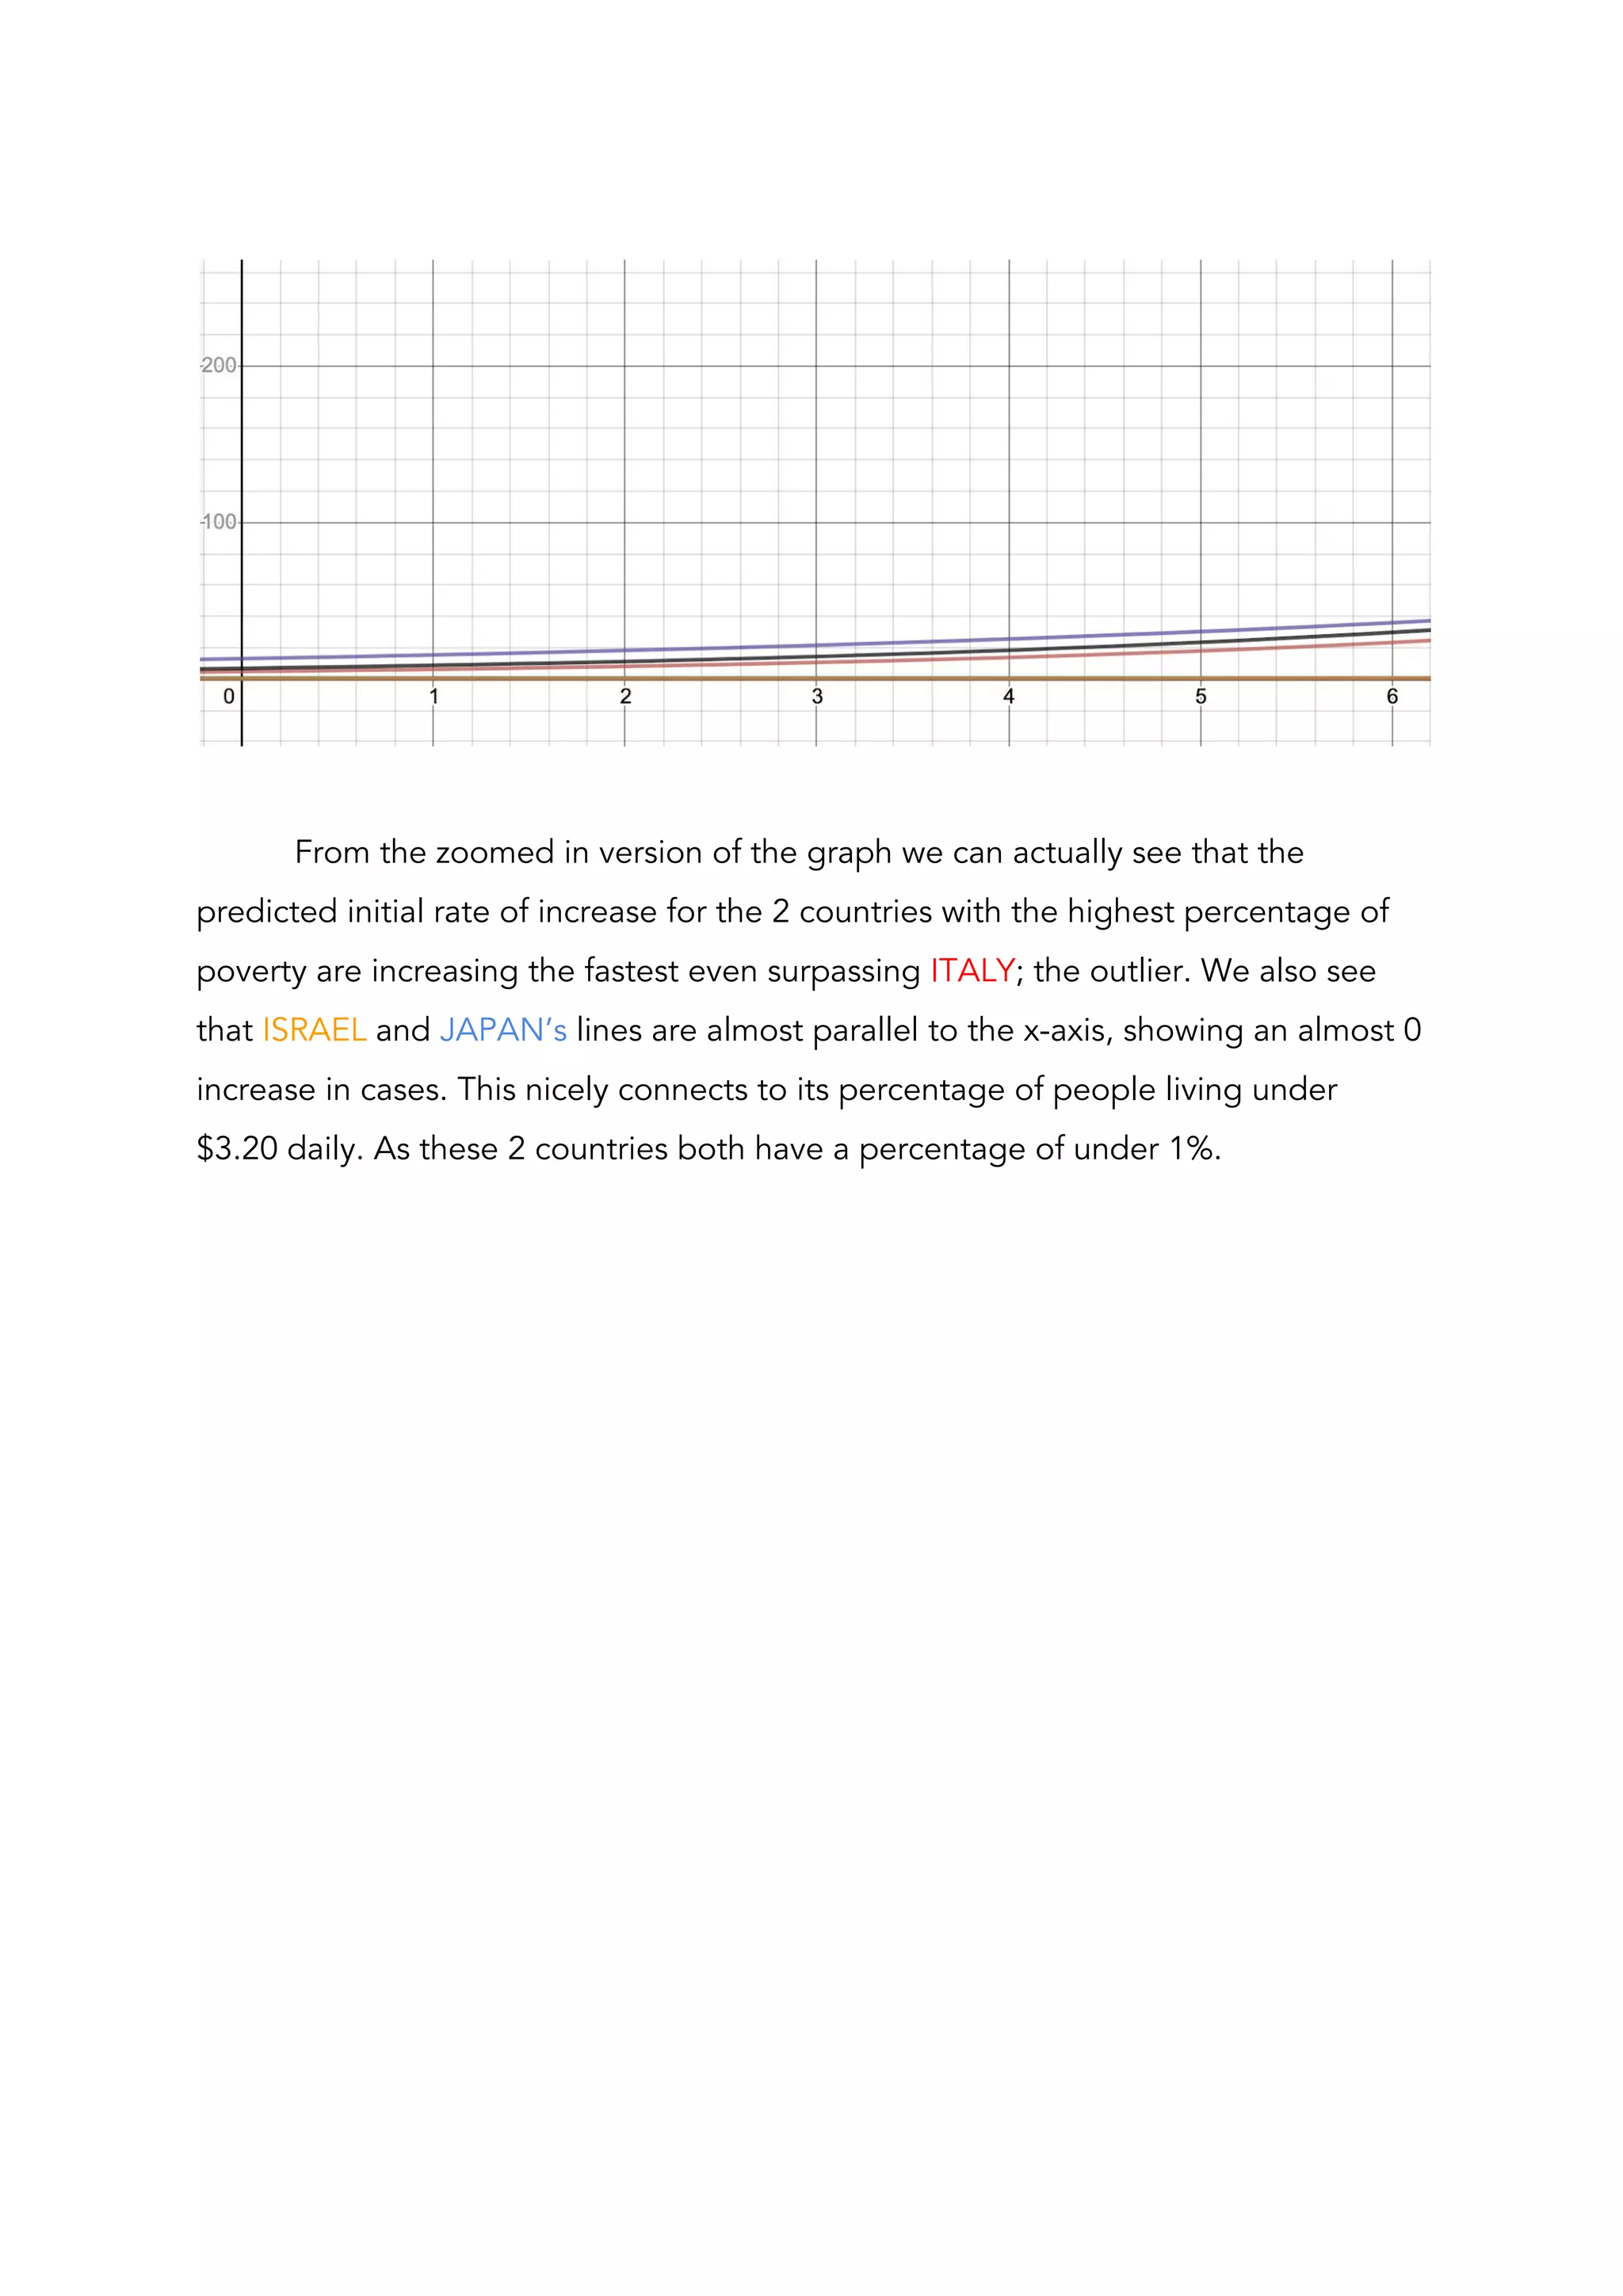
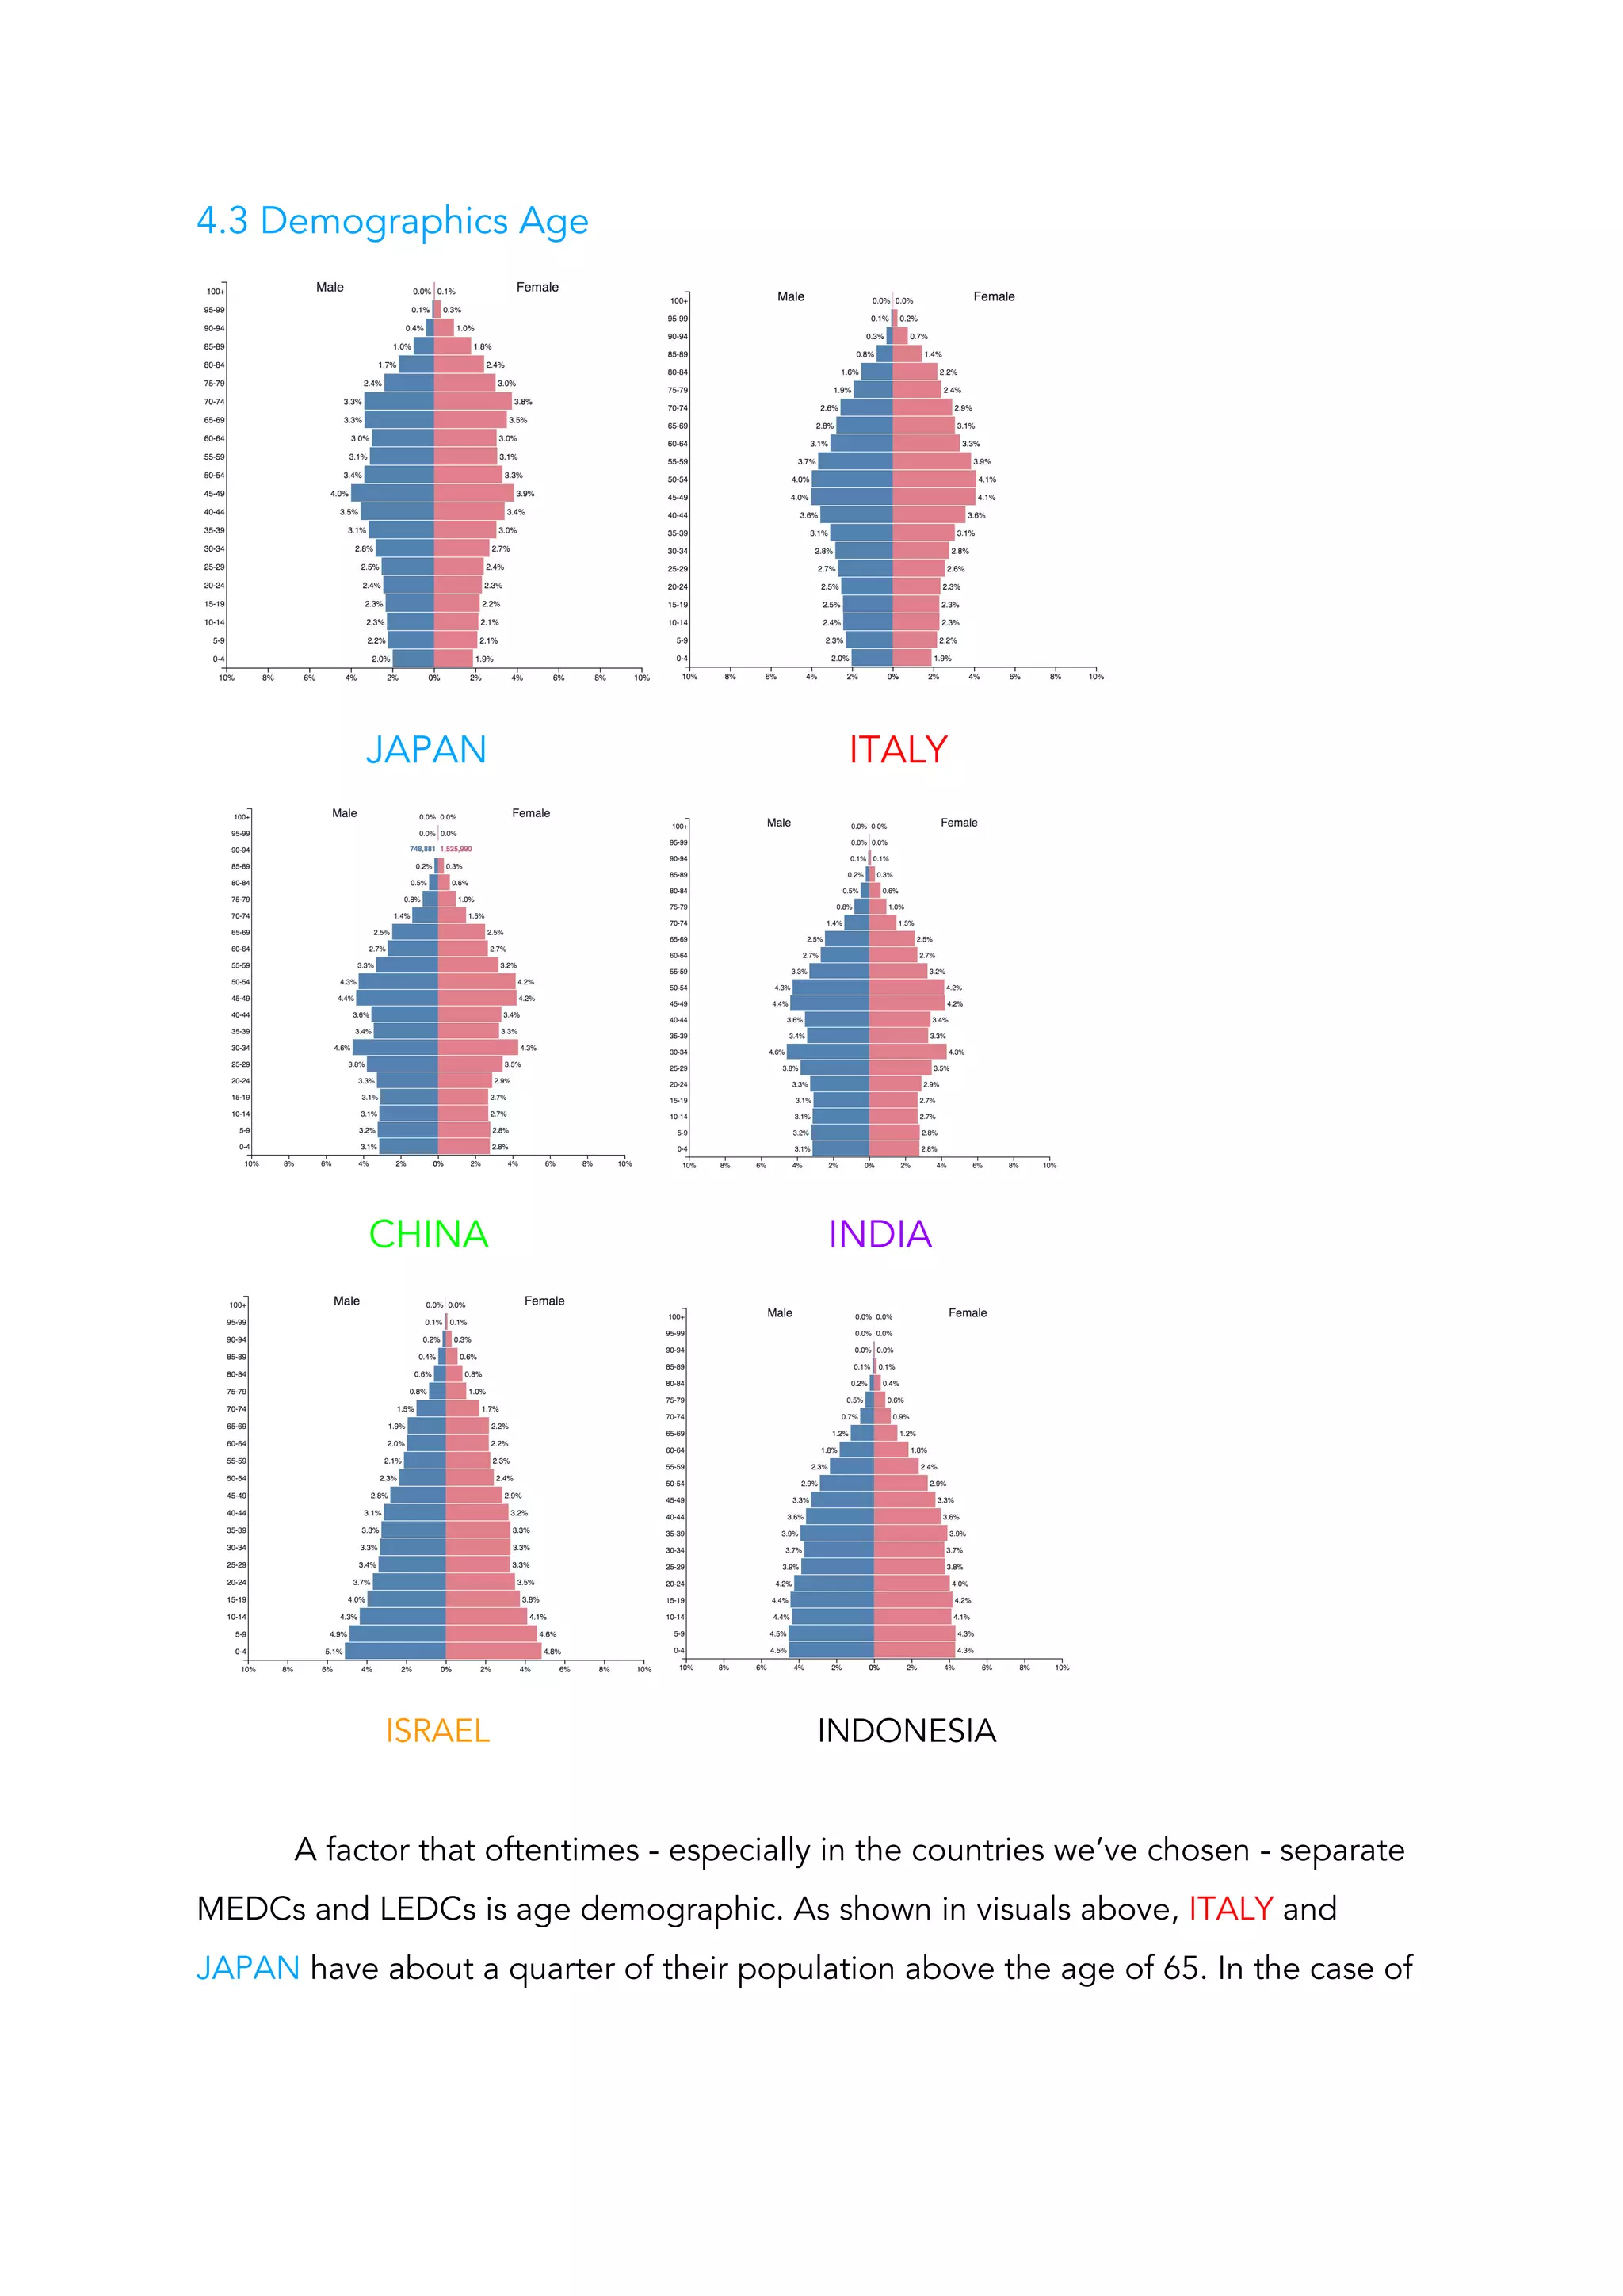
CORONAVIRUS REPORT 
Ansh Jain 


Author’s Note 
During a shutdown, the things that mark our days—going to school, engaging in sports, 
watching a movie with friends—vanish and time takes on a flat, seamless quality. Without 
some self-imposed structure, it’s easy to feel a little untethered. A friend recently posted on 
social media: “For those who have lost track, today is Blursday the Fortyteenth of Maprilay.”  
 
Giving shape to time is especially important now, when the future is so shapeless. We do 
not know whether the virus will continue to rage for weeks or months or, god help us, on 
and off for years. We do not know when we will feel safe again. And so many of us, minus 
those who are gifted at compartmentalization or denial, remain largely captive to fear. We 
may stay this way if we do not create at least the illusion of movement in our lives, our long 
days spent with ourselves or families. 
__________________________________________________________________________________ 
 
LINK TO EVERY COUNTRY TOTAL DEATH AND TOTAL CASE 


Prelude 
In December 2019, a novel coronavirus was isolated, after a cluster of patients in 
Wuhan, China were diagnosed with pneumonia of unknown cause. This new isolate 
was named ‘SARS-CoV-2’ and is the cause of the disease COVID-19. The virus has 
led to an ongoing outbreak and an unprecedented international health crisis. The 
number of infected people is rapidly increasing globally and most probably is a vast 
underestimation of the real number of patients worldwide, as infected people are 
contagious even when minimally symptomatic or asymptomatic. The spread of the 
disease has presented an extreme challenge to the international community, and 
policy-makers from different countries have each chosen different strategies, 
depending on the local spread of the virus, healthcare-system resources, economic 
and political factors, public adherence, and their perception of the situation. 


1.0 Introduction 
The following report aims to identify the primary factors influencing the spread of 
Covid-19. To do this, we analyzed the rate of spread in MEDCs and LEDCs, 
countries differing significantly in development. MEDCs, being more economically 
developed, tend to have superior healthcare, higher life expectancy, and generally 
better infrastructure, contrasting with LEDCs. This report aims to understand 
whether the characteristics of MEDCs and LEDCs can significantly impact the rate of 
spread of Covid-19, as well as more obscure factors that could have a greater 
impact than previously thought. In this report we will be examining 3 different 
MEDCs and LEDCs to develop a clear conclusion on whether we believe a country's 
development correlates to the rate of spread of Covid-19.  
 
The 3 MEDCs which will be explored: 
 
CHINA ITALY JAPAN   
 
The 3 LEDCs which will be explored: 
 
 
ISRAEL (CONTROVERSIAL) INDIA INDONESIA 
 
 
2.0 Hypothesis for Factors Impacting Spread 
Before diving into the details from different countries, we hypothesized what 
apparent factors could significantly contribute to the disparity in case and death 
rates across the world. 
Firstly, medical experts have confirmed the risk the virus poses to different 
age groups. For this coronavirus, SARS-CoV-2, the elderly are more susceptible to 
the dangers of the virus, and are more likely to become critically ill or to die when 
compared to the youth demographic. When looking at data from China and other 
MEDCs, we concluded that people between the ages of 40 and 49 have an 
estimated CFR (Case Fatality Rate) of about 0.4%; for those 80 and older, it’s 13.4%. 
This gulf of survivability is already playing out in some countries with older 
populations, such as Italy. 
Additionally, Covid-19 has been demonstrably deadlier for those with 
existing health conditions, including lung disease (often caused by smoking), 
cardiovascular disease, severe obesity, diabetes, kidney failure, and liver disease. So 
countries — or regions — with less healthy populations might also be seeing big 
differences in the rates at which people are dying from the illness. 
Beyond the varying of the impacts of the illness itself, there are lots of 
variables on how numbers are being gathered and recorded. ​Perhaps the biggest 
factor here is testing. When experts calculate a basic fatality rate, it can be as simple 
as dividing the number of deaths by the number of confirmed cases (although - and 
we’ll get to this later - it really shouldn't be). 
Since the international spread of the novel coronavirus, countries have varied 
widely in their ability and willingness to roll out testing. So that means the 
denominator (the number of cases) can be closer or further from an accurate count 
of how many people actually have the virus. The larger the percentage of a 
population that has been tested, the more complete picture we will get of the 
virus’s actual fatality rate there.   
The other issue with the poor testing rates is sampling bias. Tests that are 
available are usually saved for the sickest and riskiest cases. This pushes the fatality 
rate higher than it actually is because the testing is more likely to omit mild or 
asymptomatic cases and instead overrepresents those who are more likely to die. It 
also means that it presents the total cases as much less than it is, and gives off the 
picture that the rate of spread will be slower. So, as testing becomes more 
widespread in various countries, their fatality rates will drop. This particular issue is 
something that pervades Japan’s response to the pandemic - something you’ll read 
about in our analysis below. 
   
3.0 Data and Analysis 
The first stage of this process was to consider what data from the sheet we 
received would be relevant to our study. The purpose of this data would be to allow 
us to see any major trends to then evaluate. As our paper is focused on the rate of 
spread of the disease in MEDCs and LEDCs, the cumulative cases would be 
integral. The deaths per day, while not directly related to the spread of Covid-19, 
would provide valuable insight contributing to the importance and relevance of our 
analysis.  
To begin the evaluation process, we initially modeled the data on a graphing 
software for ease of visualization. This raised the subsequent consideration of an 
appropriate function to represent the data points. 
 
3.1 Function Selection 
To determine the ideal function to represent the data as well as fully 
understand the nature of the spread we experimented with a number of 
expressions. The previews are from the data of Italy. 
 
 
1. Linear Function 


2. Quadratic Function 
 
3. Cubic Function  
 
4. Quartic Function 
 
 
5. Sine Function 
 
6. Cosine Function 
 
 
7. Tangent Function 
 
 
8. Exponential Function 
 
9. Root Function 
 
 
10. Logarithmic Function 
 
11. Absolute Value Function 
 
12. Verhulst Function 


After modeling the 12 different functions on DESMOS (an online modelling 
tool), we compared the accuracy of each function using the R​2​
value. A common 
trend appeared to be that as the power of the function and the amount of variables 
increased, the R​2​
value approached 1. However, the Verhulst function, created to 
model population increase, stood out due not only to its high average R​2​
value, but 
it’s prediction of a plateau. 
 
 
3.2 Data Analysis for Total Cases and Total Deaths 
MEDCS: ​Italy​ ​Japan​ ​China 
LEDCS: ​Israel​ ​India​ Indonesia 
 
Graph of Total Amount of Recorded Cases for the 3 MEDCs and 3 LEDCs  
(x: Days, y: Cases) 
 
(The line for ​JAPAN​ is covered by ​INDIA​) 


Graph of Total Amount of recorded Deaths for the 3 MEDCS and 3 LEDCS 
(x: Days, y: Deaths) 


From comparing the graph of total cases and total deaths we are able to see 
how the quality of healthcare differs for the MEDCs and LEDCs. For example, 
despite ​CHINA​ having way greater total cases than INDONESIA, we can see that 
their total number of deaths are similar. Another example would be ​JAPAN​ and 
ISRAEL​. Despite Japan having a predicted trend of increasing total cases, its 
predicted total deaths is close to that of Israel's. From these 2 pieces of evidence 
we are able to infer that the healthcare provided in MEDCs is better than LEDCs. 
   
3.3 Total Amount of Cases Tested ​SOURCE 
To further look at the rate of spread between the countries chosen we 
decided to look at an external source to compare the ratio between a country's total 
test to the percentage tested positive. If the ratio of positive test to total test is high 
it would also connect to the rate of spread. We were not able to get our hands on 
the data of total tests in ​CHINA​ as the country isn’t open to sharing their statistics.  
 
Country  DATE  TOTAL 
TESTED 
TESTED 
POSITIVE 
PERCENTAGE of 
TESTED POSITIVE to 
TOTAL TESTS 
PERCENTAGE 
INCREASE IN 
TOTAL TESTS 
PERCENTAGE 
INCREASE IN 
POSITIVE TESTS 
RATIO OF 
PERCENTAGE 
INCREASES 
(POSITIVE:TOTAL) 
Italy  Apr 6, 2020  721732  128948  17.9%        
Italy  May 1, 2020  2053425  205463  10.0%  184.5%   59.3%   0.3214 
Japan  Apr 6, 2020  46172  3654  7.91%        
Japan  May 1, 2020  174150  14281  8.20%   277.2%  290.8%   1.049 
Israel  Apr 6, 2020  124828  8430  6.75%       
Israel  May 1, 2020  385922  15946  4.13%   209.2%   89.2%  0.426 
India  Apr 6, 2020  101068  4067  4.02%        
India  May 1, 2020  902654  35043  3.88%   793.1%  761.6%   0.960 
Indonesia  Apr 6, 2020  11460  2273  19,83%        
Indonesia  May 1, 2020  76538  10118  13.22%   567.9%   345.1%   0.608 
 
A very distinct trend which we notice from just looking at this data table is 
that the 2 major LEDCs (​INDIA​ and INDONESIA) have had the biggest increase in 
total number of tested cases. We can infer that with an increased amount of tests, it 
also means that there is an increase in the rate of spread discovered from the trend 
in total cases. Despite ​INDIA​ having a 793.1% increase in total tests, there is also a 
761.6% increase in total positive cases, hence showing that the percentage of total 
tested positive to percentage of total tested on April 6th can now be applied to a 
bigger audience, hence showing a larger spread of virus. The ratio of percentage 
increase between total positive cases to total tested cases is useful as it shows how 
well a country has contained the virus. If the ratio of percentage increase is 1 it 
means that the virus continues to spread at the previous rate however (in this case 
April 6th). If the value is below 1 that means the virus is spreading slower than 
before and vice versa. 
 
Another distinct piece of data is the ratio of percentage increase between 
total positive cases and total cases for ​JAPAN​. Japan is the only country with a ratio 
higher than 1, showing how the amount of total positive cases are increasing in the 
total amount of cases tested, corroborating with the predicted exponentially 
increasing spread of virus for ​JAPAN​ from the Verhulst graph on the total number of 
cases shown in section 3.2.  
 
JAPAN​ and ​INDIA​, the 2 countries with the closest to 1 ratio of percentage 
increase between total positive cases and total cases are also the 2 plotted lines 
which show a continuous exponential increase in the graph in section 3.2. Whereas 
the ​ITALY​, ​ISRAEL​ and INDONESIA (countries with low ratio of percentage increase) 
are the plots which show a plateau in total cases as there is a decrease in rate of 
spread of the virus.  
 
To further analyze the data we decided to plot the total tested cases (x-axis) 
against the total positive cases (y-axis) over a period of around 2 month in a 
quadratic function to see if we could notice a trend. We used a quadratic equation 
as it allows us to see the point of inflexion (point at which percentage of positive 
tests out of total cases go down) 


From this graph we can see the correlation to the ratio of percentage 
increase between the total positive cases and total tested cases as the only plot 
which is drastically bigger than the rest is ​JAPAN​; the country's ratio of percentage 
increases higher than 1. This tells us that according to the statistics given, Japan's 
cases will continue to surge whereas the spread of virus will begin to slow down for 
the other countries.  
 
We also notice how the plot for ​INDIA​ is considerably more stretched out 
than most of the other countries. And the x-value for the point of inflexion is 
considerably higher than the rest. This piece of data once again reflects back to its 
high ratio of percentage between total positive cases and total cases. This means 
that the amount of positive cases are able to keep up with the increases in total 
tested cases showing the continuation of the spread of the virus. This may also 
mean that the countries’ social distancing measures and other regulations are not 
working as well as the other countries.  


4.0 Identification and Evaluation of Factors 
 
4.1 Population Density ​SOURCE 
Understanding that Covid-19 is a virus which is able to be droplet transmitted and 
social distancing has been implemented in various nations to reduce the spread of 
the virus. We decided to look into how the different population densities affected 
the number of total cases for the 3 MEDCs and 3 LEDCs. Through gathering data 
on the number of bodies across an area of 1km^2, we decided to divide the total 
cases on each day for the 6 countries by their corresponding population density so 
that each country would have a population density of 1 person per km^2. This 
change in data will show how by increasing the space between each individual 
within each country, some of the disparities between the total cases in different 
countries will fade. 
 
Population Density for the 3 MEDCs:   
ITALY​= 200/km^2 ​ JAPAN​= 333/km^2 ​ CHINA​= 145/km^2 
Population Density for the 3 LEDCs: 
ISRAEL​= 416/km^2 ​ INDIA​= 414/km^2 INDONESIA= 141/km^2 


As you can see from the data presented above. After taking into account the 
population density, the large disparities between some countries have disappeared 
such as between ​CHINA​ and ​ITALY​. Originally​ ITALY’s​ ​Total Cases​ was 150% of 
CHINA’s​ ​Total Cases​ however after taking into account that Italy has 55 more 
people in a km^2 area of land in terms of ​Population Density​,​ we can see that the 
gap between the 2 countries has narrowed. This demonstrates how population 
density does have an affect towards the spread of the virus. As closer the proximity 
between the individuals in a confined space, the more likely it is for the virus to 
spread. Hence by changing the ratios of people per km^2 to 1 person per km^2, 
we shall see a decrease in transmission as larger the distance between 2 people, the 
less likely for transmission.  
 
GRAPH BEFORE CONSIDERATION OF POPULATION DENSITY : 
 
GRAPH AFTER CONSIDERATION OF POPULATION DENSITY :  
 
Above shows a comparison of the plotted graphs before and after 
consideration of population density. The disparity between ​ITALY’s​ line and 
CHINA’s​ line isn't as large anymore. This illustrates how due to the high population 
density in Italy, the spread of the virus was faster than China. However if we made 
the population density controlled between the 2 countries, the total number of 
cases begin to get closer to each other.  
 
Another example of which population density played a role was the 
comparison between INDONESIA and ​ISRAEL​. From the original data presented 
above and the original graph prior to consideration of population density, there is 
an obvious difference between the ​Total Cases​ with ​ISRAEL​ almost having 4 times 
the amount of which INDONESIA’s. This difference in total cases may appear to be 
significant initially however ​ISRAEL​ does have a population density which is ​3 times 
of which INDONESIA’s. Hence after dividing the two countries total cases by their 
corresponding ​Population Density​ to create a controlled comparison, the disparity 
once again narrows. 
 
Through using these 2 comparisons between ​CHINA​ and ​ITALY​, 
INDONESIA and ​ISRAEL​. It can be observed that population density does play a 
role in the spread of the Covid-19 virus. 
4.2 Development in Terms Wealth and Poverty Percentage ​(SOURCE)  
A major factor which separates MEDCs from LEDCs is a country's development in 
terms of wealth. To investigate the effects of this factor we looked at the 
percentage of people living below $3.20 daily. We then took into account this 
percentage with our original total amount of cases for the 6 countries. Wealth is a 
relevant factor as it directly correlates to sanitation and accessibility to clean 
resources. With high poverty rates, there are more people who are vulnerable to 
catching the Covid-19 virus.  
 
Percentage of people living below $3.20 for the 3 MEDCs:  
ITALY​= 4.5% ​ JAPAN​= 0.7% ​ CHINA​= 1.5% 
Percentage of people living below $3.20 for the 3 LEDCs: 
ISRAEL​= 0.9% ​ INDIA​= 81.2% INDONESIA= 28.8% 
 
Immediately after seeing the percentages above, we noticed an outlier with 
ISRAEL​ having very low poverty rates. The reason for this is because in terms of 
wealth ​ISRAEL​ is indeed developed however in other factors it is still considered 
developing. For instance it is a country which is highly dependent on imports 
meaning it is not self sufficient in terms of resources. Besides this anomaly, we can 
observe a distinct difference in terms of the poverty percentage between the 
MEDCs and LEDCs.  
 
In order to see whether this external factor has an effect on the rate of 
Covid-19 spread we decided to plot a graph of the first 20 days after each country 
hit more than 10 cases. And see whether we could spot a trend between the rates 
of increase and the poverty rate through using the percentage of individuals living 
under $3.20 


INITIAL 20 DAYS AFTER TOTAL CORONAVIRUS COUNT HITS 10: 


The graph of the initial 20 days after a total of 10 cases is very different to the 
graph of all the recorded cases. The predicted plots of the different countries for 
the initial 20 days are a lot closer together as most of the countries have yet to take 
their own measures to prevent the spread of the virus hence we do not see any 
disparities.  
 
We know that​ ISRAEL​, INDONESIA and ​INDIA ​all fall under the LEDCs. From 
the graph above we can see that the 3 countries are of the 4 which have the fastest 
initial increase in total cases with ​ITALY ​being an outlier  


INITIAL 20 DAYS AFTER TOTAL CORONAVIRUS COUNT HITS 10 TAKEN INTO 
ACCOUNT WEALTH FACTORS:  
 
 
To further look at how the wealth factor affected the rate at which the 
Covid-19 virus spread. I multiplied the values of the total cases 20 days after each 
country had surpassed 10 cases by the percentage of people living under $3.20 to 
zoom in on the minority group. 
 
From this graph we can see how the 2 countries (​INDIA​ and INDONESIA) 
with high poverty rates have the fastest initial spread of the Covid-19 virus with 
ITALY​ once again being an outlier. There is a very visible difference between the 
gaps in the graph after taking into account the wealth factor and prior to. We can 
see that the 2 countries with high poverty rates stand out a lot more from the rest 
compared to the initial graph. This shows how countries with high poverty rates are 
more susceptible to initial spread of the virus. 


From the zoomed in version of the graph we can actually see that the 
predicted initial rate of increase for the 2 countries with the highest percentage of 
poverty are increasing the fastest even surpassing ​ITALY​; the outlier. We also see 
that ​ISRAEL ​and ​JAPAN’s​ lines are almost parallel to the x-axis, showing an almost 0 
increase in cases. This nicely connects to its percentage of people living under 
$3.20 daily. As these 2 countries both have a percentage of under 1%. 


4.3 Demographics Age 
 
JAPAN ​ITALY  
 
​CHINA ​INDIA 
 
​ISRAEL ​INDONESIA 
 
A factor that oftentimes - especially in the countries we’ve chosen - separate 
MEDCs and LEDCs is age demographic. As shown in visuals above, ​ITALY ​and 
JAPAN ​have about a quarter of their population above the age of 65. In the case of 
JAPAN​ 28.1% of its population is at 65 and above, and in the case of ​ITALY ​23% of 
its population is at 65 and above.  
The rapid spread of COVID-19 has revealed the need to understand how 
population dynamics interact with pandemics. Population aging is currently more 
pronounced in wealthier countries, which, mercifully, may lessen the impact of this 
pandemic in lower-income countries with weaker health systems but younger age 
structures. Poor general health status and co infections such as HIV and tuberculosis 
will increase the danger of COVID-19 in these countries, along with 
intergenerational proximity and challenges to physical distancing.​ Anybody can get 
sick in this pandemic. But different people have different risks of getting severe 
symptoms that require hospitalization or intensive care - and the chance of dying 
vary widely across age groups.   
ITALY ​currently has the highest fatality rate for Covid-19 of any country with a 
major outbreak. The deluge of fatal COVID-19 cases in ​ITALY​ ​was unexpected, 
given the affected region’s health and wealth. ​This could be attributed to its ageing 
population. Research by experts already suggests that the novel coronavirus is 
considerably more fatal with each passing decade of life, and our data analysis 
shows that those 65 and older have a 3.5% chance of dying if they got the 
coronavirus; those 80 and older face a 20.23% percent chance. ​ITALY​ is also 
characterized by extensive intergenerational contacts, supported by a high degree 
of residential proximity between adult children and parents. Even when 
intergenerational families do not coreside, daily contacts are frequent. Many Italians 
prefer to live close to extended family, with over half of the population in the 
northern regions commuting. Intergenerational interactions, coincidence, and 
commuting may have accelerated the outbreak in Italy through social networks that 
increased the proximity of elderly to initial cases.  
JAPAN​, a country with more than 35.8 million people 65 or older,has data 
that does not fit the above analysis. Although its demographic leans towards an 
ageing population even more than ​ITALY, ​it’s COVID-19 related deaths and total 
cases have been relatively constant, displaying a linear like trend. This anomaly as 
mentioned earlier could be the result of a poor testing on the government's part.  
5.0 Limitations of Predictions  
While this paper does comprehensively evaluate the factors potentially 
impacting the spread of Covid-19 across the world, it is important to assess the 
accuracy of the data procured. 
Firstly, when it comes to modelling the data, the functions tested, while 
representative of the data procured so far, aren’t likely to apply accurately to the 
future. Countries have different levels of lockdown and different agendas as to when 
different services become available which aren’t factored into the models and 
predictions. 
Secondly, the data itself might not prove to be entirely accurate. For one, the 
reported death rate might not be representative of the total deaths arising as a 
result of Covid-19. Due to the inadequate testing we analysed earlier, there remains 
doubt that a number of deaths may have gone unreported. While this doesn’t 
directly impact our analysis as we focused primarily on the positive cases of 
Covid-19, an accurate picture of the impact it has had on different countries would 
have opened up further opportunities for evaluation. 
On this topic, the majority of predictions made in the evaluations were based 
on data from the past which, while it shows the country’s effectiveness at tackling 
the virus, can’t be verified as representative of the future. Case in point: when 
predicting the amount of people who are going to test positive for coronavirus over 
the next few months, we used a quadratic graph. The models in this scenario were 
likely not completely accurate with the existing data and, as a result, not accurate 
enough to predict the future. 
Lastly, even when the data is adjusted mathematically to justify the impact of 
a specific factor, it isn’t possible to ensure that it impacts the rate of spread 
proportionally. For example, when adjusting for population density, it is likely that it 
affects the spread of the coronavirus to a degree, but after that point, doesn’t 
strongly impact the number of cases. Additionally, these predictions don’t take into 
account the other identified factors. For example, in a densely populated area, the 
coronavirus is more likely to spread quickly, but there might be more deaths due to 
less access to healthcare in less populated areas. 
6.0 Conclusion 
At an overall level, our report allowed us to identify the factors that contributed most 
significantly to the spread of Covid-19. While the predictions we made from these factors 
may not have been entirely accurate, they provide us with a detailed understanding of why 
some countries appeared to be more affected by the virus than others. In terms of practical 
application, it would be useful to predict the countries which are likely to be more affected 
in the near future, as well as in future pandemics. 


COVID-19 data configuration and statistical analysis

  • 1.
  • 2.
    Author’s Note  During ashutdown, the things that mark our days—going to school, engaging in sports,  watching a movie with friends—vanish and time takes on a flat, seamless quality. Without  some self-imposed structure, it’s easy to feel a little untethered. A friend recently posted on  social media: “For those who have lost track, today is Blursday the Fortyteenth of Maprilay.”     Giving shape to time is especially important now, when the future is so shapeless. We do  not know whether the virus will continue to rage for weeks or months or, god help us, on  and off for years. We do not know when we will feel safe again. And so many of us, minus  those who are gifted at compartmentalization or denial, remain largely captive to fear. We  may stay this way if we do not create at least the illusion of movement in our lives, our long  days spent with ourselves or families.  __________________________________________________________________________________    LINK TO EVERY COUNTRY TOTAL DEATH AND TOTAL CASE                                           
  • 3.
    Prelude  In December 2019,a novel coronavirus was isolated, after a cluster of patients in  Wuhan, China were diagnosed with pneumonia of unknown cause. This new isolate  was named ‘SARS-CoV-2’ and is the cause of the disease COVID-19. The virus has  led to an ongoing outbreak and an unprecedented international health crisis. The  number of infected people is rapidly increasing globally and most probably is a vast  underestimation of the real number of patients worldwide, as infected people are  contagious even when minimally symptomatic or asymptomatic. The spread of the  disease has presented an extreme challenge to the international community, and  policy-makers from different countries have each chosen different strategies,  depending on the local spread of the virus, healthcare-system resources, economic  and political factors, public adherence, and their perception of the situation.                 
  • 4.
    1.0 Introduction  The followingreport aims to identify the primary factors influencing the spread of  Covid-19. To do this, we analyzed the rate of spread in MEDCs and LEDCs,  countries differing significantly in development. MEDCs, being more economically  developed, tend to have superior healthcare, higher life expectancy, and generally  better infrastructure, contrasting with LEDCs. This report aims to understand  whether the characteristics of MEDCs and LEDCs can significantly impact the rate of  spread of Covid-19, as well as more obscure factors that could have a greater  impact than previously thought. In this report we will be examining 3 different  MEDCs and LEDCs to develop a clear conclusion on whether we believe a country's  development correlates to the rate of spread of Covid-19.     The 3 MEDCs which will be explored:    CHINA ITALY JAPAN      The 3 LEDCs which will be explored:      ISRAEL (CONTROVERSIAL) INDIA INDONESIA     
  • 5.
    2.0 Hypothesis forFactors Impacting Spread  Before diving into the details from different countries, we hypothesized what  apparent factors could significantly contribute to the disparity in case and death  rates across the world.  Firstly, medical experts have confirmed the risk the virus poses to different  age groups. For this coronavirus, SARS-CoV-2, the elderly are more susceptible to  the dangers of the virus, and are more likely to become critically ill or to die when  compared to the youth demographic. When looking at data from China and other  MEDCs, we concluded that people between the ages of 40 and 49 have an  estimated CFR (Case Fatality Rate) of about 0.4%; for those 80 and older, it’s 13.4%.  This gulf of survivability is already playing out in some countries with older  populations, such as Italy.  Additionally, Covid-19 has been demonstrably deadlier for those with  existing health conditions, including lung disease (often caused by smoking),  cardiovascular disease, severe obesity, diabetes, kidney failure, and liver disease. So  countries — or regions — with less healthy populations might also be seeing big  differences in the rates at which people are dying from the illness.  Beyond the varying of the impacts of the illness itself, there are lots of  variables on how numbers are being gathered and recorded. ​Perhaps the biggest  factor here is testing. When experts calculate a basic fatality rate, it can be as simple  as dividing the number of deaths by the number of confirmed cases (although - and  we’ll get to this later - it really shouldn't be).  Since the international spread of the novel coronavirus, countries have varied  widely in their ability and willingness to roll out testing. So that means the  denominator (the number of cases) can be closer or further from an accurate count  of how many people actually have the virus. The larger the percentage of a  population that has been tested, the more complete picture we will get of the  virus’s actual fatality rate there.   
  • 6.
    The other issuewith the poor testing rates is sampling bias. Tests that are  available are usually saved for the sickest and riskiest cases. This pushes the fatality  rate higher than it actually is because the testing is more likely to omit mild or  asymptomatic cases and instead overrepresents those who are more likely to die. It  also means that it presents the total cases as much less than it is, and gives off the  picture that the rate of spread will be slower. So, as testing becomes more  widespread in various countries, their fatality rates will drop. This particular issue is  something that pervades Japan’s response to the pandemic - something you’ll read  about in our analysis below.     
  • 7.
    3.0 Data andAnalysis  The first stage of this process was to consider what data from the sheet we  received would be relevant to our study. The purpose of this data would be to allow  us to see any major trends to then evaluate. As our paper is focused on the rate of  spread of the disease in MEDCs and LEDCs, the cumulative cases would be  integral. The deaths per day, while not directly related to the spread of Covid-19,  would provide valuable insight contributing to the importance and relevance of our  analysis.   To begin the evaluation process, we initially modeled the data on a graphing  software for ease of visualization. This raised the subsequent consideration of an  appropriate function to represent the data points.    3.1 Function Selection  To determine the ideal function to represent the data as well as fully  understand the nature of the spread we experimented with a number of  expressions. The previews are from the data of Italy.      1. Linear Function     
  • 8.
      2. Quadratic Function    3.Cubic Function     4. Quartic Function   
  • 9.
      5. Sine Function    6.Cosine Function      7. Tangent Function   
  • 10.
      8. Exponential Function    9.Root Function      10. Logarithmic Function 
  • 11.
      11. Absolute ValueFunction    12. Verhulst Function     
  • 12.
      After modeling the12 different functions on DESMOS (an online modelling  tool), we compared the accuracy of each function using the R​2​ value. A common  trend appeared to be that as the power of the function and the amount of variables  increased, the R​2​ value approached 1. However, the Verhulst function, created to  model population increase, stood out due not only to its high average R​2​ value, but  it’s prediction of a plateau.      3.2 Data Analysis for Total Cases and Total Deaths  MEDCS: ​Italy​ ​Japan​ ​China  LEDCS: ​Israel​ ​India​ Indonesia    Graph of Total Amount of Recorded Cases for the 3 MEDCs and 3 LEDCs   (x: Days, y: Cases)    (The line for ​JAPAN​ is covered by ​INDIA​) 
  • 13.
                      Graph of TotalAmount of recorded Deaths for the 3 MEDCS and 3 LEDCS  (x: Days, y: Deaths)   
  • 14.
          From comparing thegraph of total cases and total deaths we are able to see  how the quality of healthcare differs for the MEDCs and LEDCs. For example,  despite ​CHINA​ having way greater total cases than INDONESIA, we can see that  their total number of deaths are similar. Another example would be ​JAPAN​ and  ISRAEL​. Despite Japan having a predicted trend of increasing total cases, its  predicted total deaths is close to that of Israel's. From these 2 pieces of evidence  we are able to infer that the healthcare provided in MEDCs is better than LEDCs.     
  • 15.
    3.3 Total Amountof Cases Tested ​SOURCE  To further look at the rate of spread between the countries chosen we  decided to look at an external source to compare the ratio between a country's total  test to the percentage tested positive. If the ratio of positive test to total test is high  it would also connect to the rate of spread. We were not able to get our hands on  the data of total tests in ​CHINA​ as the country isn’t open to sharing their statistics.     Country  DATE  TOTAL  TESTED  TESTED  POSITIVE  PERCENTAGE of  TESTED POSITIVE to  TOTAL TESTS  PERCENTAGE  INCREASE IN  TOTAL TESTS  PERCENTAGE  INCREASE IN  POSITIVE TESTS  RATIO OF  PERCENTAGE  INCREASES  (POSITIVE:TOTAL)  Italy  Apr 6, 2020  721732  128948  17.9%         Italy  May 1, 2020  2053425  205463  10.0%  184.5%   59.3%   0.3214  Japan  Apr 6, 2020  46172  3654  7.91%         Japan  May 1, 2020  174150  14281  8.20%   277.2%  290.8%   1.049  Israel  Apr 6, 2020  124828  8430  6.75%        Israel  May 1, 2020  385922  15946  4.13%   209.2%   89.2%  0.426  India  Apr 6, 2020  101068  4067  4.02%         India  May 1, 2020  902654  35043  3.88%   793.1%  761.6%   0.960  Indonesia  Apr 6, 2020  11460  2273  19,83%         Indonesia  May 1, 2020  76538  10118  13.22%   567.9%   345.1%   0.608    A very distinct trend which we notice from just looking at this data table is  that the 2 major LEDCs (​INDIA​ and INDONESIA) have had the biggest increase in  total number of tested cases. We can infer that with an increased amount of tests, it  also means that there is an increase in the rate of spread discovered from the trend  in total cases. Despite ​INDIA​ having a 793.1% increase in total tests, there is also a  761.6% increase in total positive cases, hence showing that the percentage of total  tested positive to percentage of total tested on April 6th can now be applied to a  bigger audience, hence showing a larger spread of virus. The ratio of percentage  increase between total positive cases to total tested cases is useful as it shows how  well a country has contained the virus. If the ratio of percentage increase is 1 it  means that the virus continues to spread at the previous rate however (in this case 
  • 16.
    April 6th). Ifthe value is below 1 that means the virus is spreading slower than  before and vice versa.    Another distinct piece of data is the ratio of percentage increase between  total positive cases and total cases for ​JAPAN​. Japan is the only country with a ratio  higher than 1, showing how the amount of total positive cases are increasing in the  total amount of cases tested, corroborating with the predicted exponentially  increasing spread of virus for ​JAPAN​ from the Verhulst graph on the total number of  cases shown in section 3.2.     JAPAN​ and ​INDIA​, the 2 countries with the closest to 1 ratio of percentage  increase between total positive cases and total cases are also the 2 plotted lines  which show a continuous exponential increase in the graph in section 3.2. Whereas  the ​ITALY​, ​ISRAEL​ and INDONESIA (countries with low ratio of percentage increase)  are the plots which show a plateau in total cases as there is a decrease in rate of  spread of the virus.     To further analyze the data we decided to plot the total tested cases (x-axis)  against the total positive cases (y-axis) over a period of around 2 month in a  quadratic function to see if we could notice a trend. We used a quadratic equation  as it allows us to see the point of inflexion (point at which percentage of positive  tests out of total cases go down)     
  • 17.
      From this graphwe can see the correlation to the ratio of percentage  increase between the total positive cases and total tested cases as the only plot  which is drastically bigger than the rest is ​JAPAN​; the country's ratio of percentage  increases higher than 1. This tells us that according to the statistics given, Japan's  cases will continue to surge whereas the spread of virus will begin to slow down for  the other countries.     We also notice how the plot for ​INDIA​ is considerably more stretched out  than most of the other countries. And the x-value for the point of inflexion is  considerably higher than the rest. This piece of data once again reflects back to its  high ratio of percentage between total positive cases and total cases. This means  that the amount of positive cases are able to keep up with the increases in total  tested cases showing the continuation of the spread of the virus. This may also  mean that the countries’ social distancing measures and other regulations are not  working as well as the other countries.                                  
  • 18.
      4.0 Identification andEvaluation of Factors    4.1 Population Density ​SOURCE  Understanding that Covid-19 is a virus which is able to be droplet transmitted and  social distancing has been implemented in various nations to reduce the spread of  the virus. We decided to look into how the different population densities affected  the number of total cases for the 3 MEDCs and 3 LEDCs. Through gathering data  on the number of bodies across an area of 1km^2, we decided to divide the total  cases on each day for the 6 countries by their corresponding population density so  that each country would have a population density of 1 person per km^2. This  change in data will show how by increasing the space between each individual  within each country, some of the disparities between the total cases in different  countries will fade.    Population Density for the 3 MEDCs:    ITALY​= 200/km^2 ​ JAPAN​= 333/km^2 ​ CHINA​= 145/km^2  Population Density for the 3 LEDCs:  ISRAEL​= 416/km^2 ​ INDIA​= 414/km^2 INDONESIA= 141/km^2       
  • 19.
    As you cansee from the data presented above. After taking into account the  population density, the large disparities between some countries have disappeared  such as between ​CHINA​ and ​ITALY​. Originally​ ITALY’s​ ​Total Cases​ was 150% of  CHINA’s​ ​Total Cases​ however after taking into account that Italy has 55 more  people in a km^2 area of land in terms of ​Population Density​,​ we can see that the  gap between the 2 countries has narrowed. This demonstrates how population  density does have an affect towards the spread of the virus. As closer the proximity  between the individuals in a confined space, the more likely it is for the virus to  spread. Hence by changing the ratios of people per km^2 to 1 person per km^2,  we shall see a decrease in transmission as larger the distance between 2 people, the  less likely for transmission.     GRAPH BEFORE CONSIDERATION OF POPULATION DENSITY :    GRAPH AFTER CONSIDERATION OF POPULATION DENSITY :    
  • 20.
    Above shows acomparison of the plotted graphs before and after  consideration of population density. The disparity between ​ITALY’s​ line and  CHINA’s​ line isn't as large anymore. This illustrates how due to the high population  density in Italy, the spread of the virus was faster than China. However if we made  the population density controlled between the 2 countries, the total number of  cases begin to get closer to each other.     Another example of which population density played a role was the  comparison between INDONESIA and ​ISRAEL​. From the original data presented  above and the original graph prior to consideration of population density, there is  an obvious difference between the ​Total Cases​ with ​ISRAEL​ almost having 4 times  the amount of which INDONESIA’s. This difference in total cases may appear to be  significant initially however ​ISRAEL​ does have a population density which is ​3 times  of which INDONESIA’s. Hence after dividing the two countries total cases by their  corresponding ​Population Density​ to create a controlled comparison, the disparity  once again narrows.    Through using these 2 comparisons between ​CHINA​ and ​ITALY​,  INDONESIA and ​ISRAEL​. It can be observed that population density does play a  role in the spread of the Covid-19 virus. 
  • 21.
    4.2 Development inTerms Wealth and Poverty Percentage ​(SOURCE)   A major factor which separates MEDCs from LEDCs is a country's development in  terms of wealth. To investigate the effects of this factor we looked at the  percentage of people living below $3.20 daily. We then took into account this  percentage with our original total amount of cases for the 6 countries. Wealth is a  relevant factor as it directly correlates to sanitation and accessibility to clean  resources. With high poverty rates, there are more people who are vulnerable to  catching the Covid-19 virus.     Percentage of people living below $3.20 for the 3 MEDCs:   ITALY​= 4.5% ​ JAPAN​= 0.7% ​ CHINA​= 1.5%  Percentage of people living below $3.20 for the 3 LEDCs:  ISRAEL​= 0.9% ​ INDIA​= 81.2% INDONESIA= 28.8%    Immediately after seeing the percentages above, we noticed an outlier with  ISRAEL​ having very low poverty rates. The reason for this is because in terms of  wealth ​ISRAEL​ is indeed developed however in other factors it is still considered  developing. For instance it is a country which is highly dependent on imports  meaning it is not self sufficient in terms of resources. Besides this anomaly, we can  observe a distinct difference in terms of the poverty percentage between the  MEDCs and LEDCs.     In order to see whether this external factor has an effect on the rate of  Covid-19 spread we decided to plot a graph of the first 20 days after each country  hit more than 10 cases. And see whether we could spot a trend between the rates  of increase and the poverty rate through using the percentage of individuals living  under $3.20         
  • 22.
    INITIAL 20 DAYSAFTER TOTAL CORONAVIRUS COUNT HITS 10:          The graph of the initial 20 days after a total of 10 cases is very different to the  graph of all the recorded cases. The predicted plots of the different countries for  the initial 20 days are a lot closer together as most of the countries have yet to take  their own measures to prevent the spread of the virus hence we do not see any  disparities.     We know that​ ISRAEL​, INDONESIA and ​INDIA ​all fall under the LEDCs. From  the graph above we can see that the 3 countries are of the 4 which have the fastest  initial increase in total cases with ​ITALY ​being an outlier        
  • 23.
    INITIAL 20 DAYSAFTER TOTAL CORONAVIRUS COUNT HITS 10 TAKEN INTO  ACCOUNT WEALTH FACTORS:       To further look at how the wealth factor affected the rate at which the  Covid-19 virus spread. I multiplied the values of the total cases 20 days after each  country had surpassed 10 cases by the percentage of people living under $3.20 to  zoom in on the minority group.    From this graph we can see how the 2 countries (​INDIA​ and INDONESIA)  with high poverty rates have the fastest initial spread of the Covid-19 virus with  ITALY​ once again being an outlier. There is a very visible difference between the  gaps in the graph after taking into account the wealth factor and prior to. We can  see that the 2 countries with high poverty rates stand out a lot more from the rest  compared to the initial graph. This shows how countries with high poverty rates are  more susceptible to initial spread of the virus. 
  • 24.
          From the zoomedin version of the graph we can actually see that the  predicted initial rate of increase for the 2 countries with the highest percentage of  poverty are increasing the fastest even surpassing ​ITALY​; the outlier. We also see  that ​ISRAEL ​and ​JAPAN’s​ lines are almost parallel to the x-axis, showing an almost 0  increase in cases. This nicely connects to its percentage of people living under  $3.20 daily. As these 2 countries both have a percentage of under 1%.                               
  • 25.
    4.3 Demographics Age    JAPAN​ITALY     ​CHINA ​INDIA    ​ISRAEL ​INDONESIA    A factor that oftentimes - especially in the countries we’ve chosen - separate  MEDCs and LEDCs is age demographic. As shown in visuals above, ​ITALY ​and  JAPAN ​have about a quarter of their population above the age of 65. In the case of 
  • 26.
    JAPAN​ 28.1% ofits population is at 65 and above, and in the case of ​ITALY ​23% of  its population is at 65 and above.   The rapid spread of COVID-19 has revealed the need to understand how  population dynamics interact with pandemics. Population aging is currently more  pronounced in wealthier countries, which, mercifully, may lessen the impact of this  pandemic in lower-income countries with weaker health systems but younger age  structures. Poor general health status and co infections such as HIV and tuberculosis  will increase the danger of COVID-19 in these countries, along with  intergenerational proximity and challenges to physical distancing.​ Anybody can get  sick in this pandemic. But different people have different risks of getting severe  symptoms that require hospitalization or intensive care - and the chance of dying  vary widely across age groups.    ITALY ​currently has the highest fatality rate for Covid-19 of any country with a  major outbreak. The deluge of fatal COVID-19 cases in ​ITALY​ ​was unexpected,  given the affected region’s health and wealth. ​This could be attributed to its ageing  population. Research by experts already suggests that the novel coronavirus is  considerably more fatal with each passing decade of life, and our data analysis  shows that those 65 and older have a 3.5% chance of dying if they got the  coronavirus; those 80 and older face a 20.23% percent chance. ​ITALY​ is also  characterized by extensive intergenerational contacts, supported by a high degree  of residential proximity between adult children and parents. Even when  intergenerational families do not coreside, daily contacts are frequent. Many Italians  prefer to live close to extended family, with over half of the population in the  northern regions commuting. Intergenerational interactions, coincidence, and  commuting may have accelerated the outbreak in Italy through social networks that  increased the proximity of elderly to initial cases.   JAPAN​, a country with more than 35.8 million people 65 or older,has data  that does not fit the above analysis. Although its demographic leans towards an  ageing population even more than ​ITALY, ​it’s COVID-19 related deaths and total  cases have been relatively constant, displaying a linear like trend. This anomaly as  mentioned earlier could be the result of a poor testing on the government's part.  
  • 27.
    5.0 Limitations ofPredictions   While this paper does comprehensively evaluate the factors potentially  impacting the spread of Covid-19 across the world, it is important to assess the  accuracy of the data procured.  Firstly, when it comes to modelling the data, the functions tested, while  representative of the data procured so far, aren’t likely to apply accurately to the  future. Countries have different levels of lockdown and different agendas as to when  different services become available which aren’t factored into the models and  predictions.  Secondly, the data itself might not prove to be entirely accurate. For one, the  reported death rate might not be representative of the total deaths arising as a  result of Covid-19. Due to the inadequate testing we analysed earlier, there remains  doubt that a number of deaths may have gone unreported. While this doesn’t  directly impact our analysis as we focused primarily on the positive cases of  Covid-19, an accurate picture of the impact it has had on different countries would  have opened up further opportunities for evaluation.  On this topic, the majority of predictions made in the evaluations were based  on data from the past which, while it shows the country’s effectiveness at tackling  the virus, can’t be verified as representative of the future. Case in point: when  predicting the amount of people who are going to test positive for coronavirus over  the next few months, we used a quadratic graph. The models in this scenario were  likely not completely accurate with the existing data and, as a result, not accurate  enough to predict the future.  Lastly, even when the data is adjusted mathematically to justify the impact of  a specific factor, it isn’t possible to ensure that it impacts the rate of spread  proportionally. For example, when adjusting for population density, it is likely that it  affects the spread of the coronavirus to a degree, but after that point, doesn’t  strongly impact the number of cases. Additionally, these predictions don’t take into  account the other identified factors. For example, in a densely populated area, the  coronavirus is more likely to spread quickly, but there might be more deaths due to  less access to healthcare in less populated areas. 
  • 28.
    6.0 Conclusion  At anoverall level, our report allowed us to identify the factors that contributed most  significantly to the spread of Covid-19. While the predictions we made from these factors  may not have been entirely accurate, they provide us with a detailed understanding of why  some countries appeared to be more affected by the virus than others. In terms of practical  application, it would be useful to predict the countries which are likely to be more affected  in the near future, as well as in future pandemics.