Download to read offline


![The COVID19 Hot-Spot Map of India]](https://image.slidesharecdn.com/analyticsoncovid19-201215064244/85/Analytics-on-covid-19-19-320.jpg)
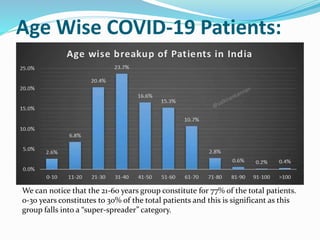


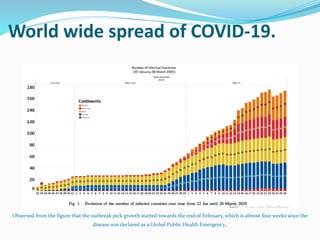
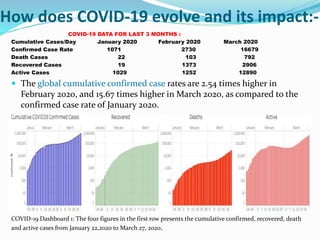
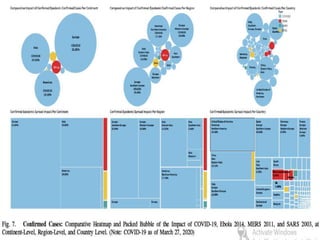
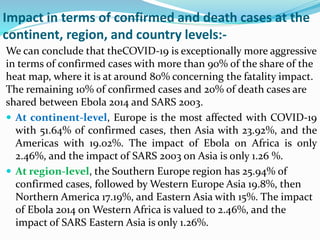
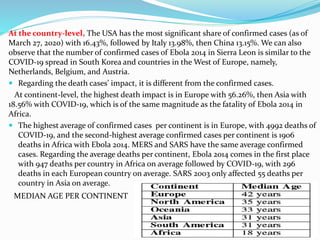
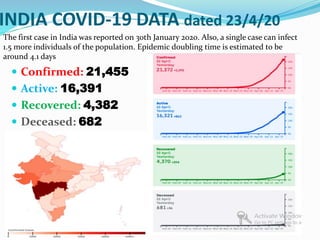
The document analyzes analytics and data related to the spread and impact of COVID-19 globally and in India. Some key findings include: - COVID-19 has spread to over 170 countries more rapidly than previous epidemics like SARS and MERS. - As of late March, Europe had over 50% of global confirmed cases and over 50% of deaths, with high numbers in Italy, Spain, Germany and France. - In India, the majority of cases are in the 21-60 age group and males are affected more than females. The outbreak may peak in India in May. - The document compares data on confirmed cases, deaths, recoveries and active cases over time to analyze trends and severity of COVID


