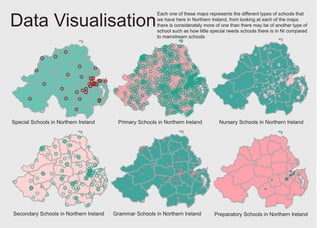
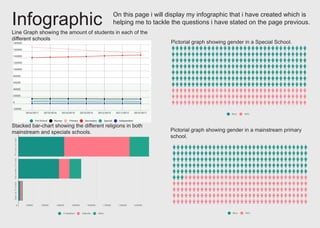
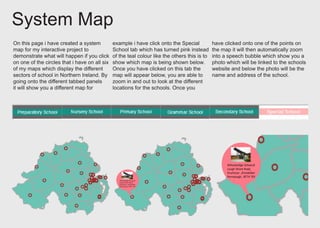
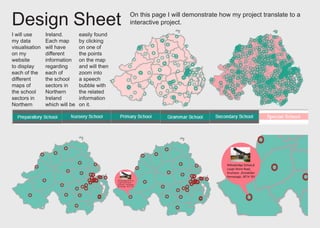
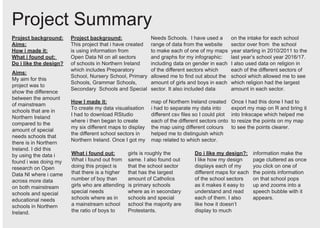
ICT Role in 21st Century Education & its Challenges.pptx
Coursework 1 design deck alan
1. Data Visualisation
Each one of these maps represents the different types of schools that
we have here in Northern Ireland, from looking at each of the maps
there is considerately more of one than there may be of another type of
school such as how little special needs schools there is in NI compared
to mainstream schools
Special Schools in Northern Ireland
Secondary Schools in Northern Ireland
Primary Schools in Northern Ireland Nursery Schools in Northern Ireland
Grammar Schools in Northern Ireland Preparatory Schools in Northern Ireland
2. Project Page
Aims:
The aim for this project that I’m doing
is to show the difference between the
amount of mainstream schools that
there is in Northern Ireland compared
to the amount of schools there is for
children and young adults who may have
a special educational need or a have
special need of any sort such as ADHD
or Down Syndrome in Northern Ireland.
Questions:
A few of the questions that I am going
to tackle and try and find out the reason
why this is “Is there more boys or girls in
a special needs school compared to a
mainstream school in Northern Ireland?”
I have answered this questions by using
a pictorial graph on my Infographic page
which shows the amount of boys and
girls that are enrolled in both a special
school and a mainstream school.
Another question I’m going to tackle is
“Has the amount of people diagnosed
with a special educational need
increased or decreased in the last few
years?”
On the next page I’ve made a infographic
which helps me to answer this question
in the form of a line-graph which shows
the change either the increased or
decreased of students that have been
enrolling and attending each of the
different sectors of schools in Northern
Ireland from 2010/2011 to 2016/2017.
Another question i will be trying to find
out the answer to is “ Which religion
attends each of the different school
sectors more?”
I have used a stacked bar-chart on the
next page which helps me to answer
this question as it shows the amount of
protestant , catholic and other religion
that is enrolled in each of the sectors.
On this page I will go through what my aims are for this project
and I will also talk about what questions I am going to tackle
through this project.
3. Infographic On this page i will display my infographic that i have created which is
helping me to tackle the questions i have stated on the page previous.
Line Graph showing the amount of students in each of the
different schools
Pictorial graph showing gender in a Special School.
Pictorial graph showing gender in a mainstream primary
school.
Stacked bar-chart showing the different religions in both
mainstream and specials schools.
4. System Map
On this page i have created a system
map for my interactive project to
demonstrate what will happen if you click
on one of the circles that i have on all six
of my maps which display the different
sectors of school in Northern Ireland. By
going onto the different tabbed panels
it will show you a different map for
example i have click onto the Special
School tab which has turned pink instead
of the teal colour like the others this is to
show which map is being shown below.
Once you have clicked on this tab the
map will appear below, you are able to
zoom in and out to look at the different
locations for the schools. Once you
have clicked onto one of the points on
the map it will then automatically zoom
into a speech bubble which show you a
photo which will be linked to the schools
website and below the photo will be the
name and address of the school.
5. Design Sheet On this page I will demonstrate how my project translate to a
interactive project.
I will use
my data
visualisation
on my
website
to display
each of the
different
maps of
the school
sectors in
Northern
Ireland.
Each map
will have
different
information
regarding
each of
the school
sectors in
Northern
Ireland
which will be
easily found
by clicking
on one of
the points
on the map
and will then
zoom into
a speech
bubble with
the related
information
on it.
6. Project Summary
Project background:
Aims:
How i made it:
What i found out:
Do i like the design?
Project background:
This project that i have created
is using information from
Open Data NI on all sectors
of schools in Northern Ireland
which includes Preparatory
School, Nursery School, Primary
Schools, Grammar Schools,
Secondary Schools and Special
Needs Schools. I have used a
range of data from the website
to make each of one of my maps
and graphs for my infographic:
including data on gender in each
of the different sectors which
allowed me to find out about the
amount of girls and boys in each
sector. It also included data
on the intake for each school
sector over from the school
year starting in 2010/2011 to the
last year’s school year 2016/17.
I also used data on religion in
each of the different sectors of
school which allowed me to see
which religion had the largest
amount in each sector.
Aims:
My aim for this
project was to
show the difference
between the amount
of mainstream
schools that are in
Northern Ireland
compared to the
amount of special
needs schools that
there is in Northern
Ireland. I did this
by using the data i
found i was doing my
research on Open
Data NI where i came
across more data
on both mainstream
schools and special
educational needs
schools in Northern
Ireland.
How I made it:
To create my data visualisation
I had to download RStudio
where i then began to create
my six different maps to display
the different school sectors in
Northern Ireland. Once I got my
map of Northern Ireland created
i had to separate my data into
different csv files so I could plot
each of the different sectors onto
the map using different colours
helped me to distinguish which
map related to which sector.
Once I had this done I had to
export my map on R and bring it
into Inkscape which helped me
to resize the points on my map
to see the points clearer.
What i found out:
What i found out from
doing this project is
that there is a higher
number of boy than
girls who are attending
special needs
schools where as in
a mainstream school
the ratio of boys to
girls is roughly the
same. I also found out
that the school sector
that has the largest
amount of Catholics
is primary schools
where as in secondary
schools and special
school the majority are
Protestants.
Do i like my design?:
I like how my design
displays each of my
different maps for each
of the school sectors
as it makes it easy to
understand and read
each of them. I also
like how it doesn’t
display to much
information make the
page cluttered as once
you click on one of
the points information
on that school pops
up and zooms into a
speech bubble with it
appears.