Download to read offline

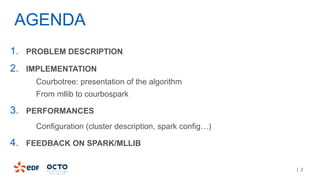
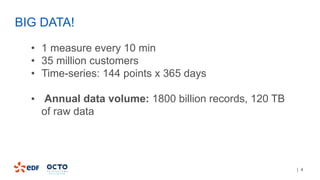
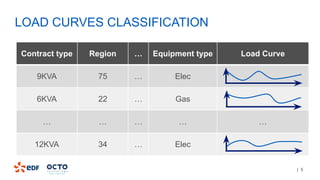


The document discusses the development of CourboSpark, a decision tree algorithm for analyzing time-series data using Apache Spark. It highlights the challenges of processing vast datasets, including 1800 billion records from 35 million customers, and the approach to classifying load curves based on various features. The presentation covers implementation details, scalability considerations, and potential future enhancements for improving model performance.