Download to read offline


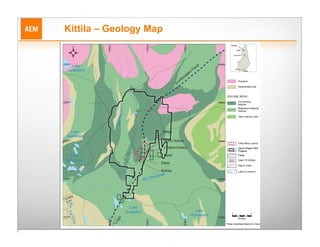


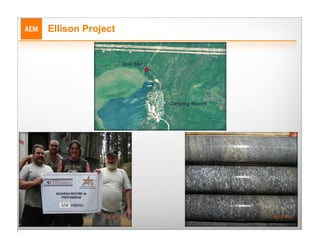


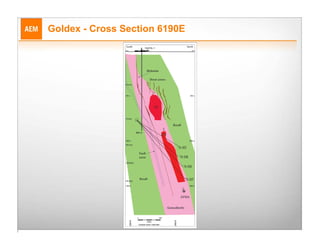


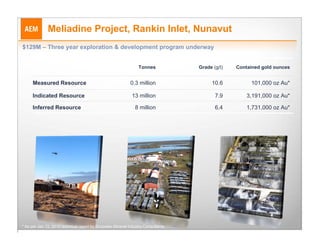


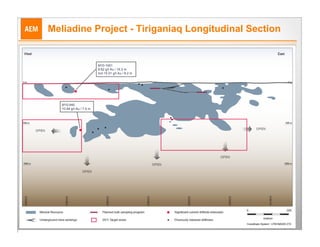


The document provides information about Agnico-Eagle Mines Limited's exploration projects and core sample showcases. It summarizes key projects including Pinos Altos in Mexico, Kittila in Finland, LaRonde in Canada, Goldex in Canada, Meliadine in Nunavut, and Meadowbank in Canada. For each project, it provides details on 2011 production estimates, 2012-2015 production outlooks, exploration focuses, reserve and resource figures, mine lives, and 2011 exploration budgets. The document also includes maps, diagrams and photos related to the geology and drilling at each site.


