Download to read offline
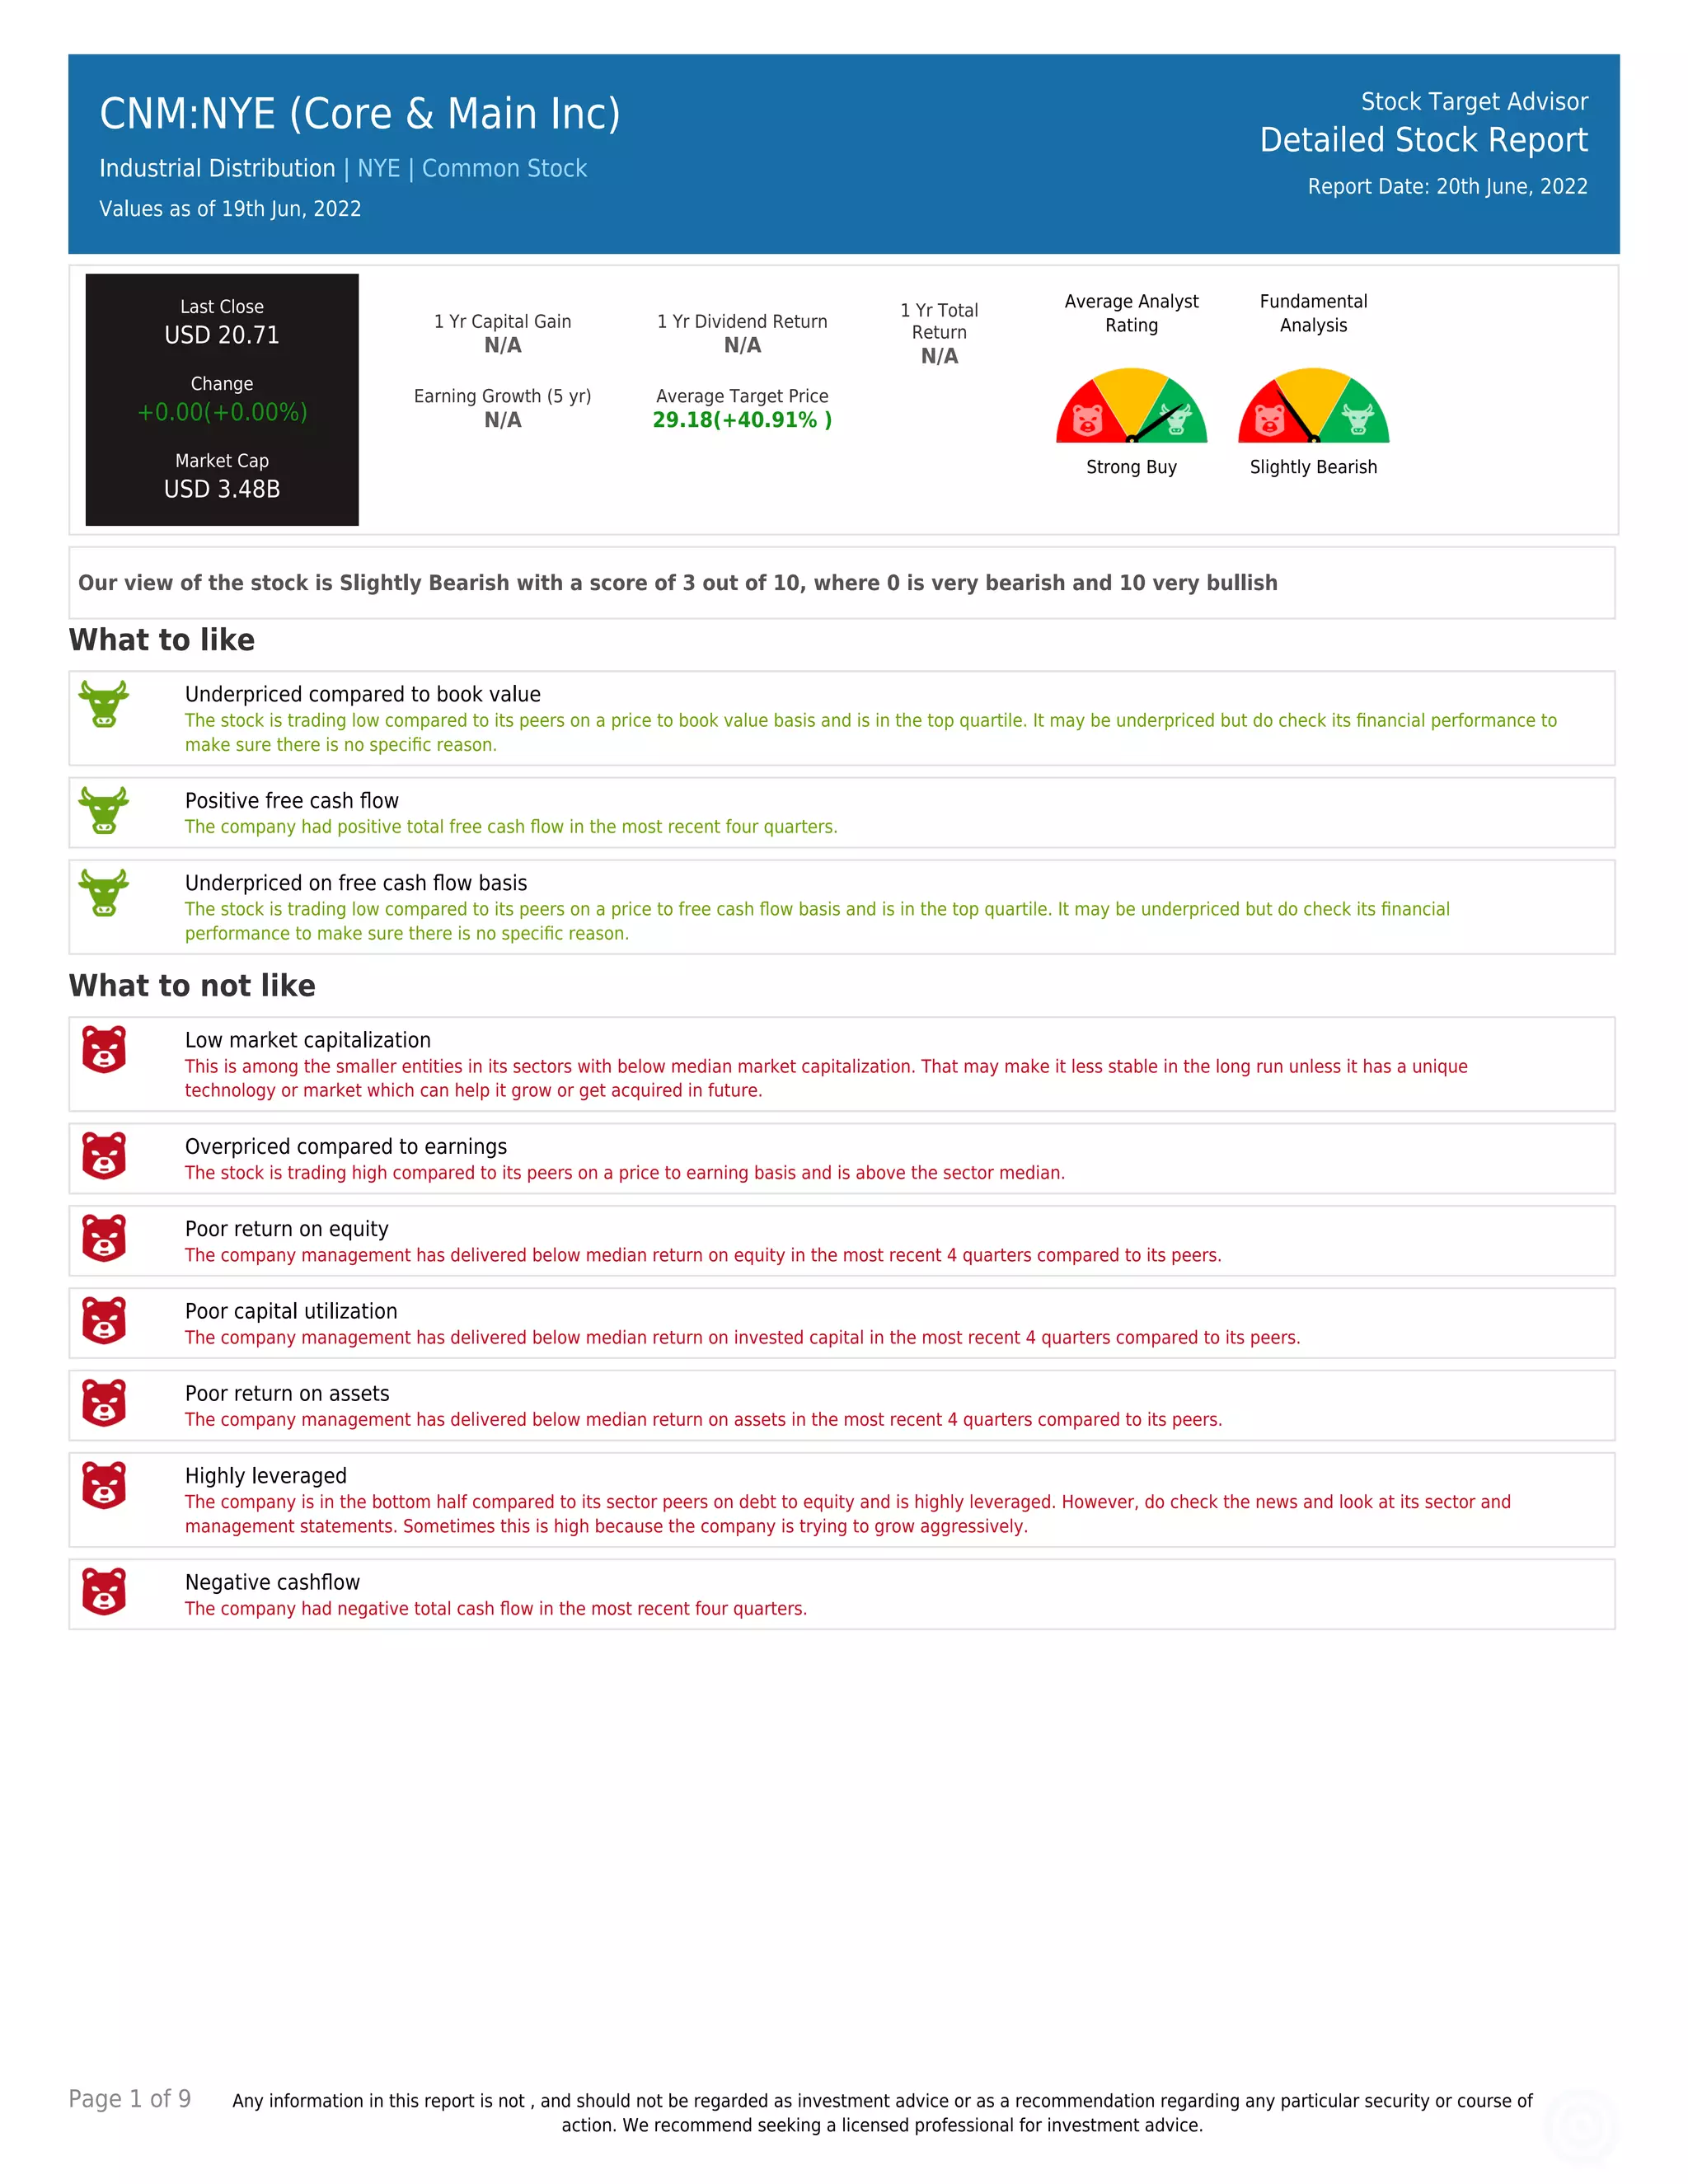
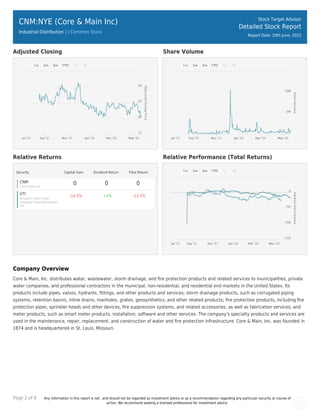
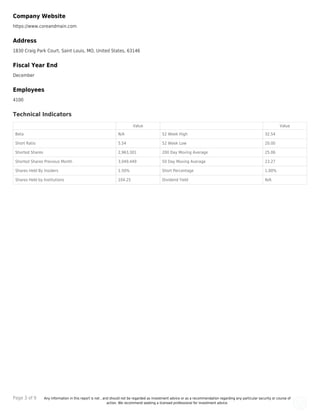

The report on Core & Main Inc. indicates a slightly bearish outlook with a stock price of $20.71 as of June 19, 2022, and an average target price of $29.18, suggesting a potential capital gain of 40.91%. Despite being underpriced compared to book value and demonstrating positive free cash flow, the company faces challenges such as low market capitalization, high leverage, and poor returns on equity, assets, and capital utilization. The company distributes water, wastewater, and fire protection products and services, operating within a competitive industrial distribution sector.


