Download to read offline
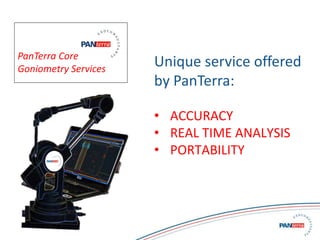
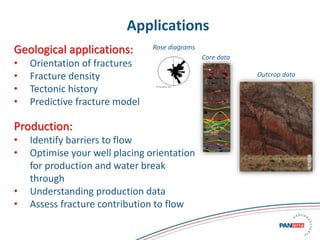
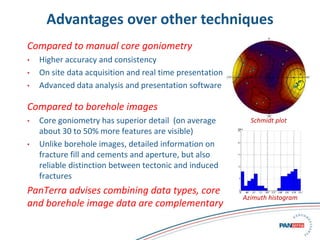
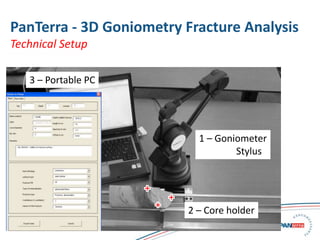


PanTerra offers high-precision core goniometry services using an advanced core goniometer they developed to better analyze fracture orientation in cores. This provides real-time, on-site structural analysis of fractures up to 6 feet long with applications in understanding geological history, optimizing well placement, and assessing fracture contribution to flow. The core goniometry system logs structural and sedimentary planes in cores with 0.2mm precision and can measure features not visible on borehole images.


![Human Reproduction [ Reproductive System ] Notes @irfanullah_mehar Irfanullah...](https://cdn.slidesharecdn.com/ss_thumbnails/humanreproductionreproductivesystemnotesirfanullahmeharirfanullahmeharjanantantra-260111172350-56e85778-thumbnail.jpg?width=640&height=640&fit=bounds)


