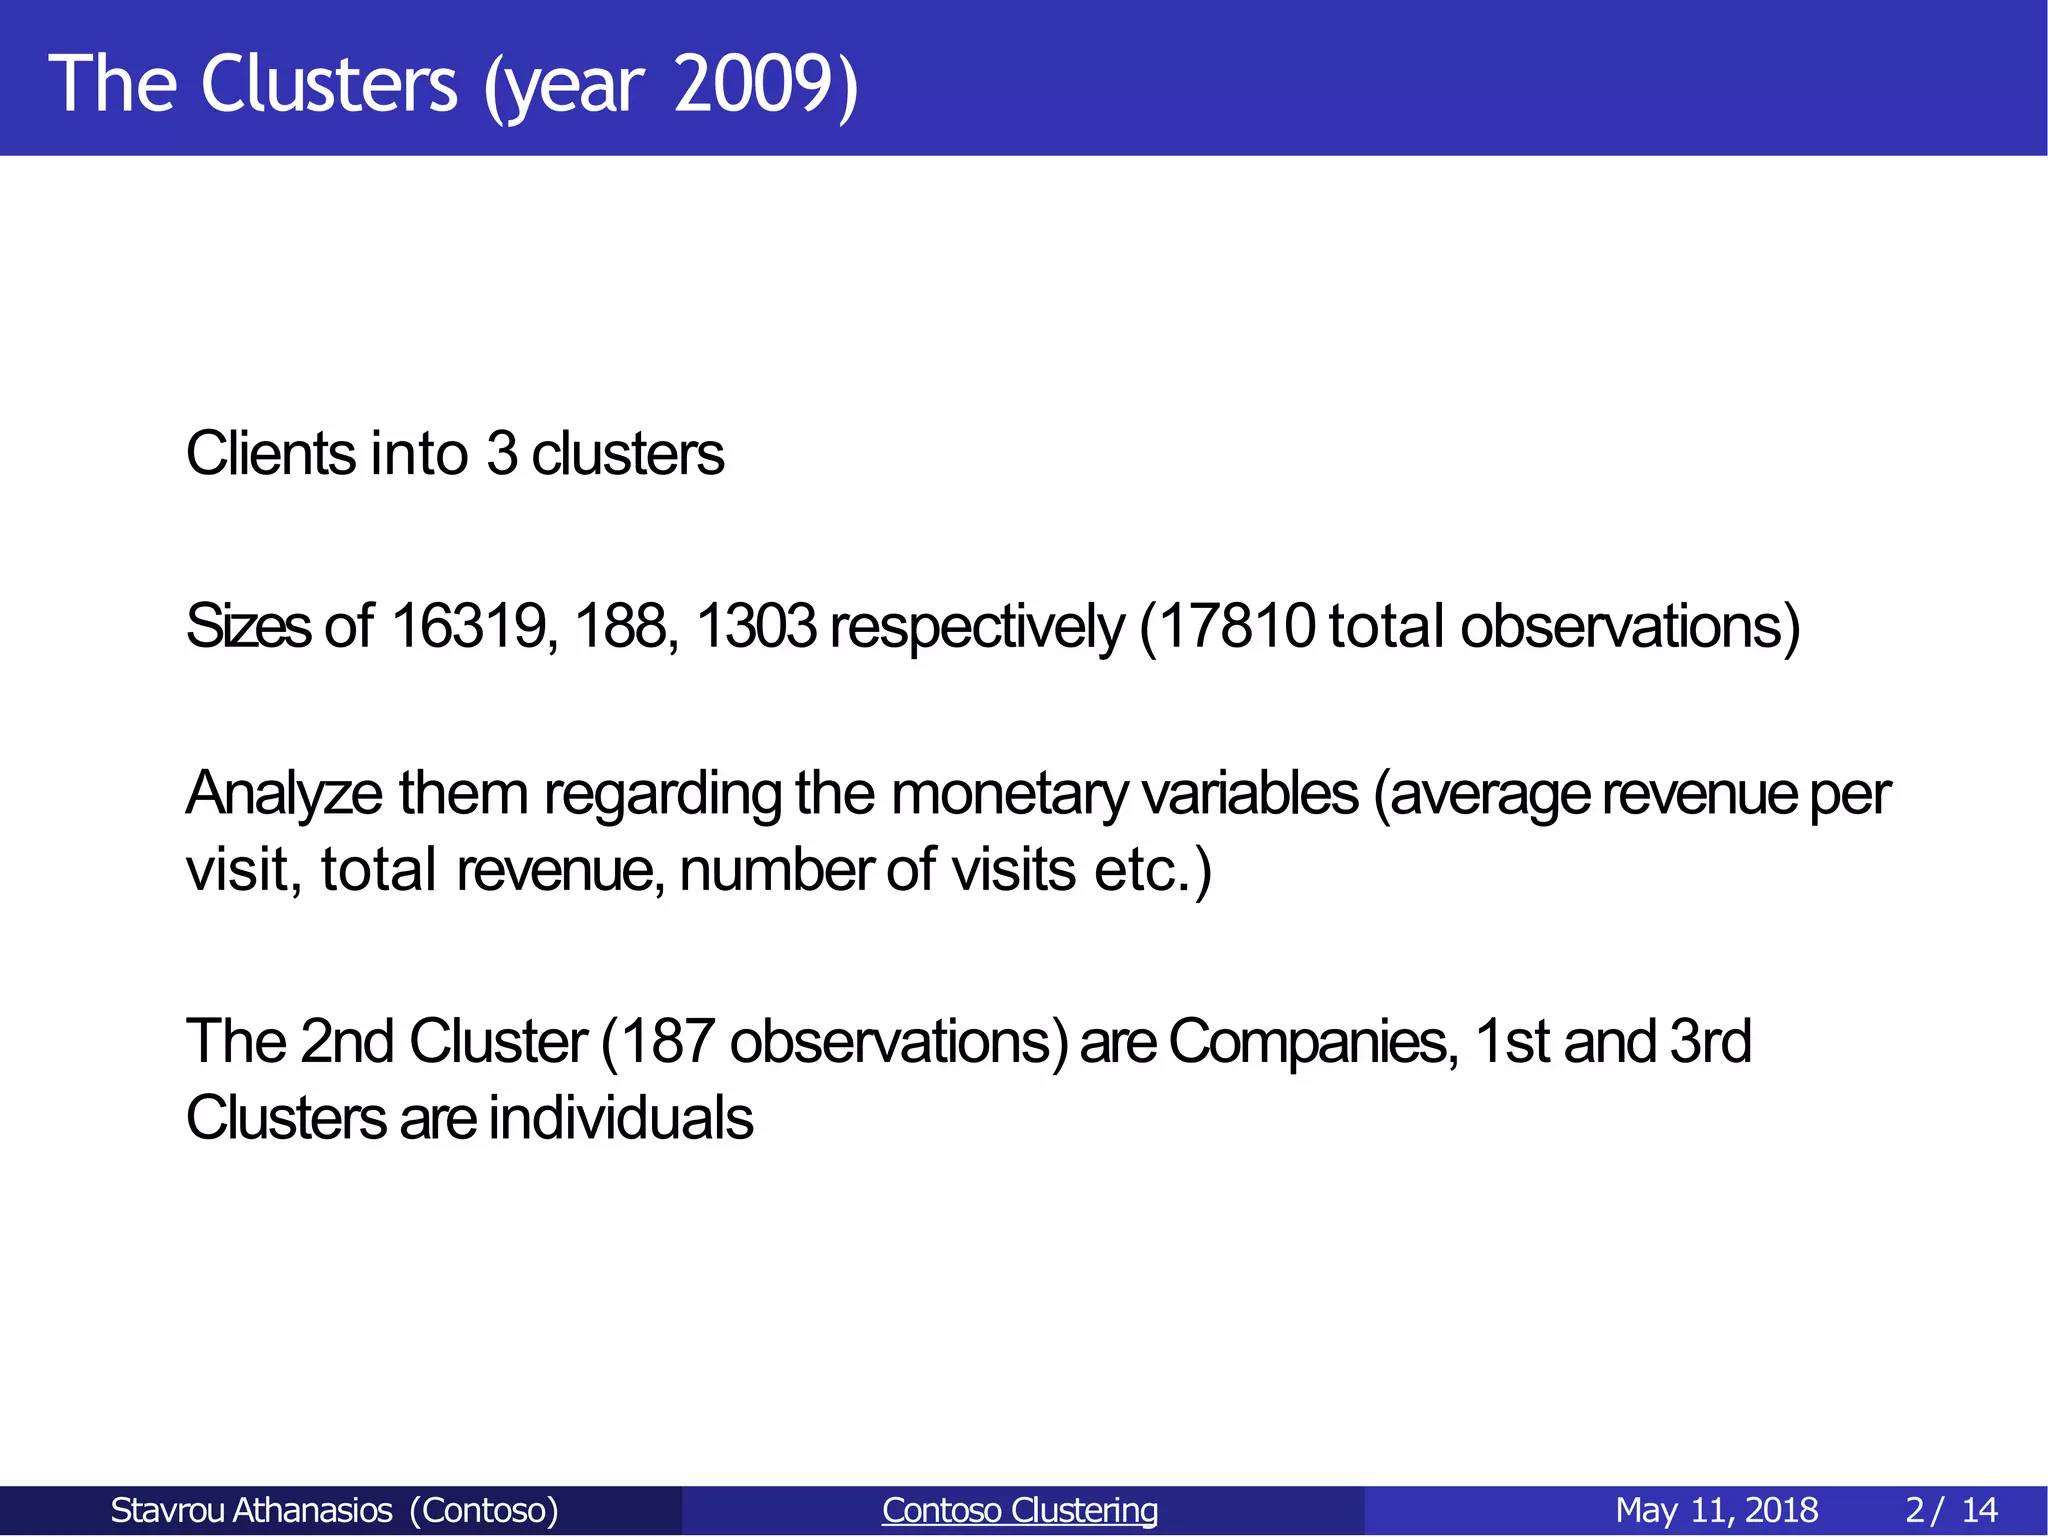
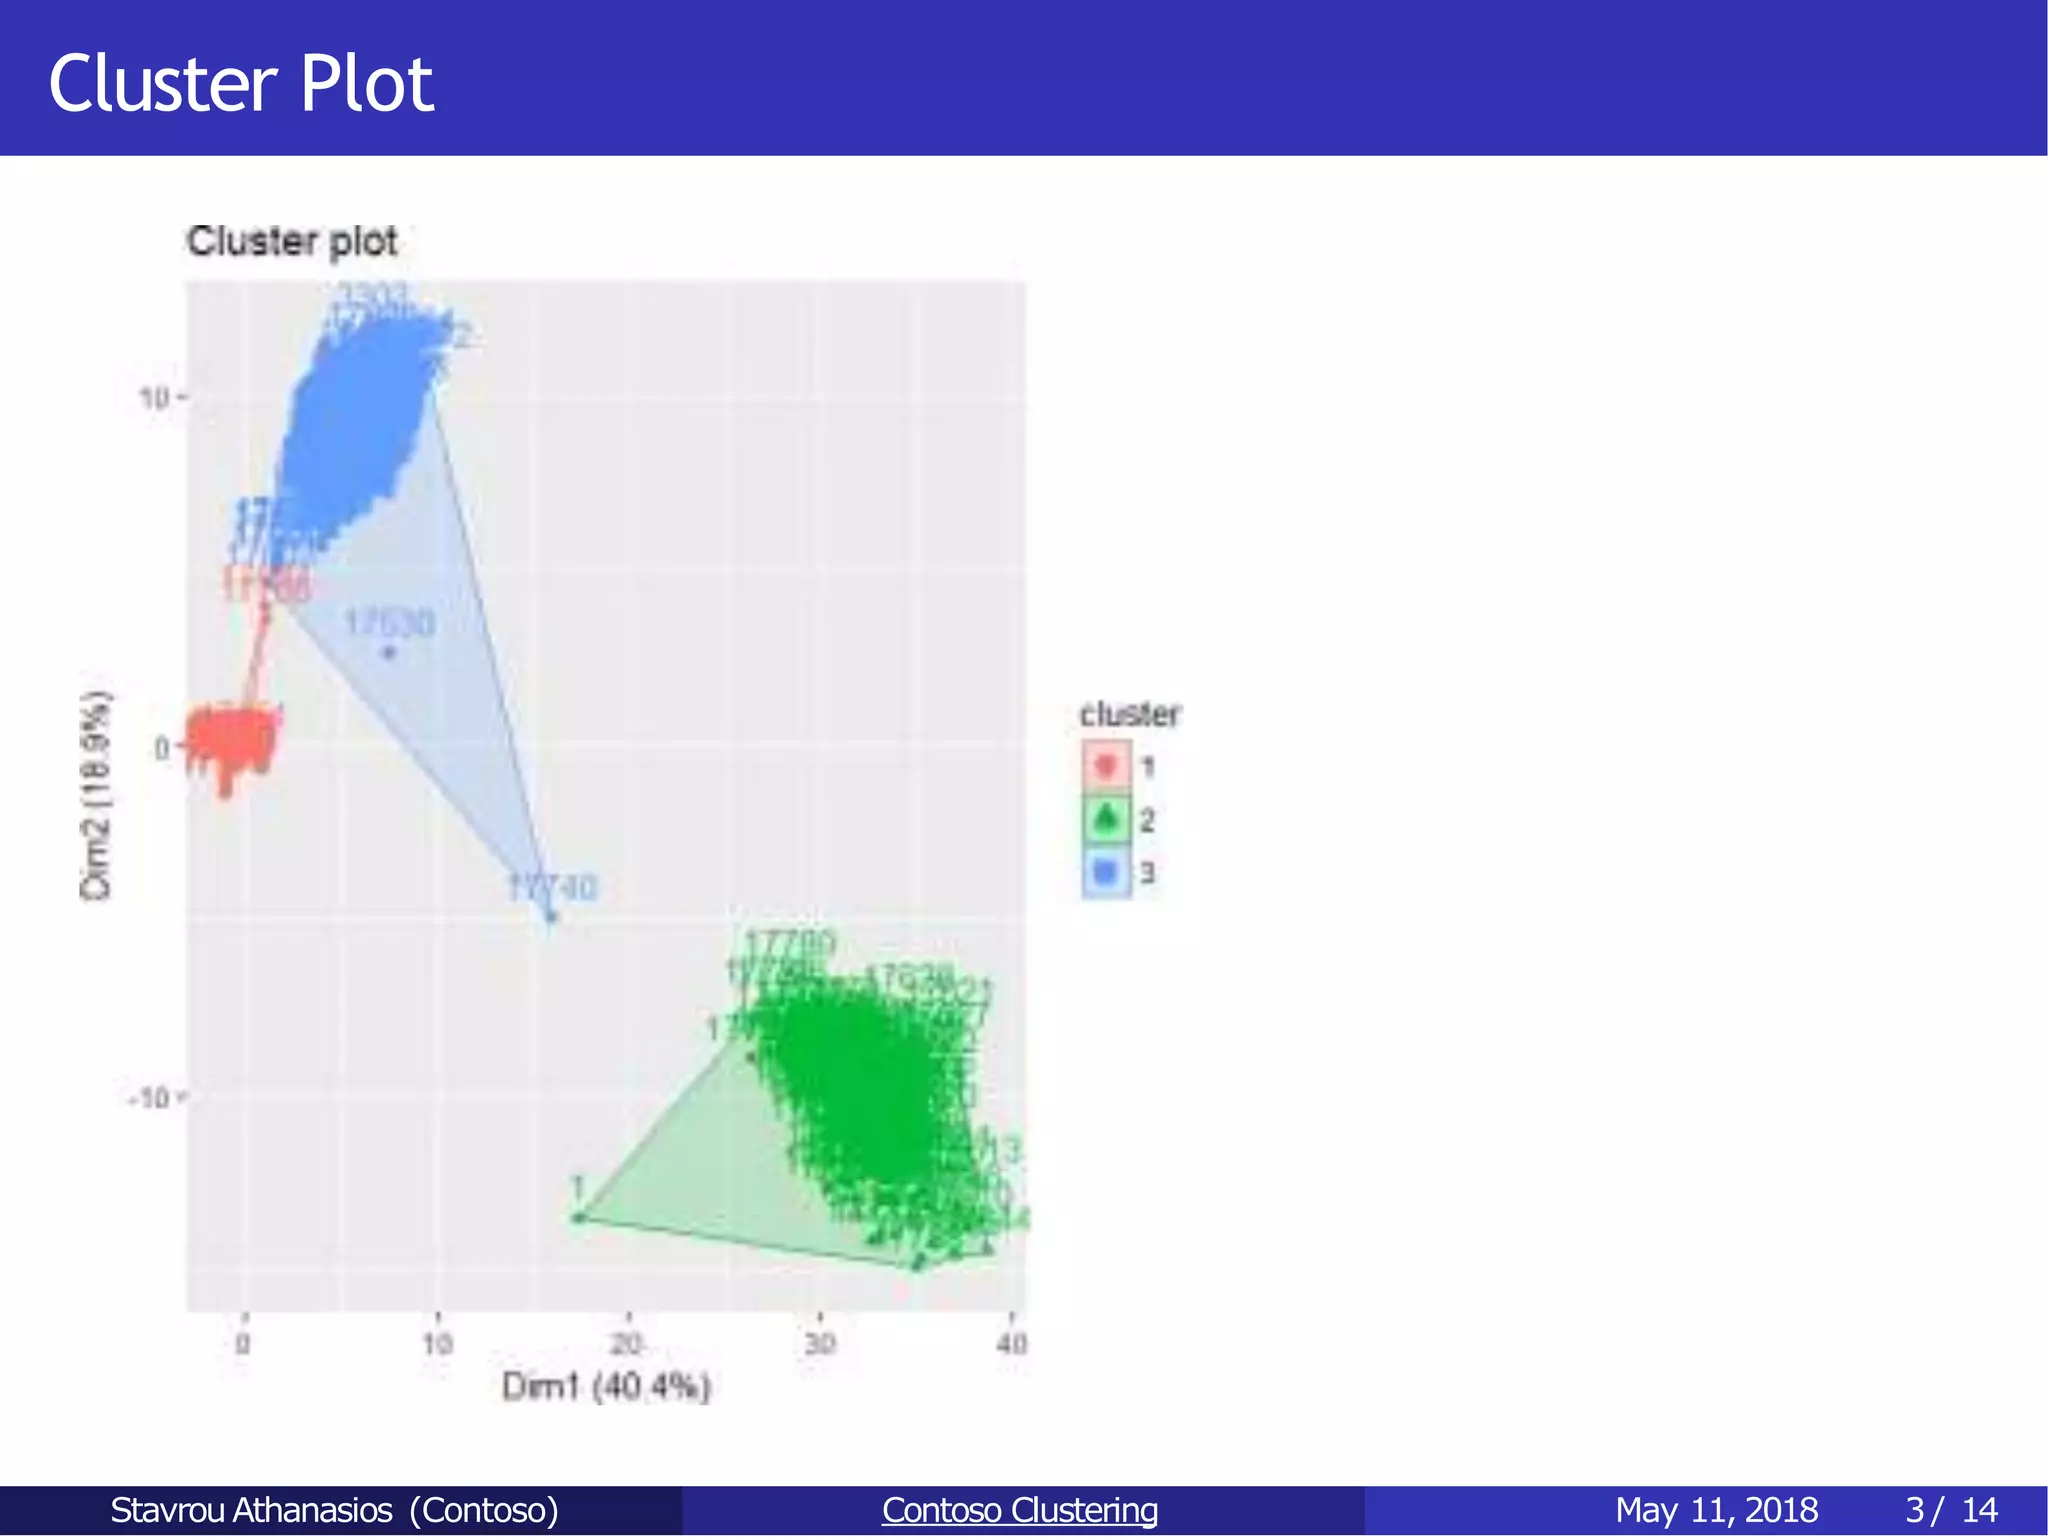
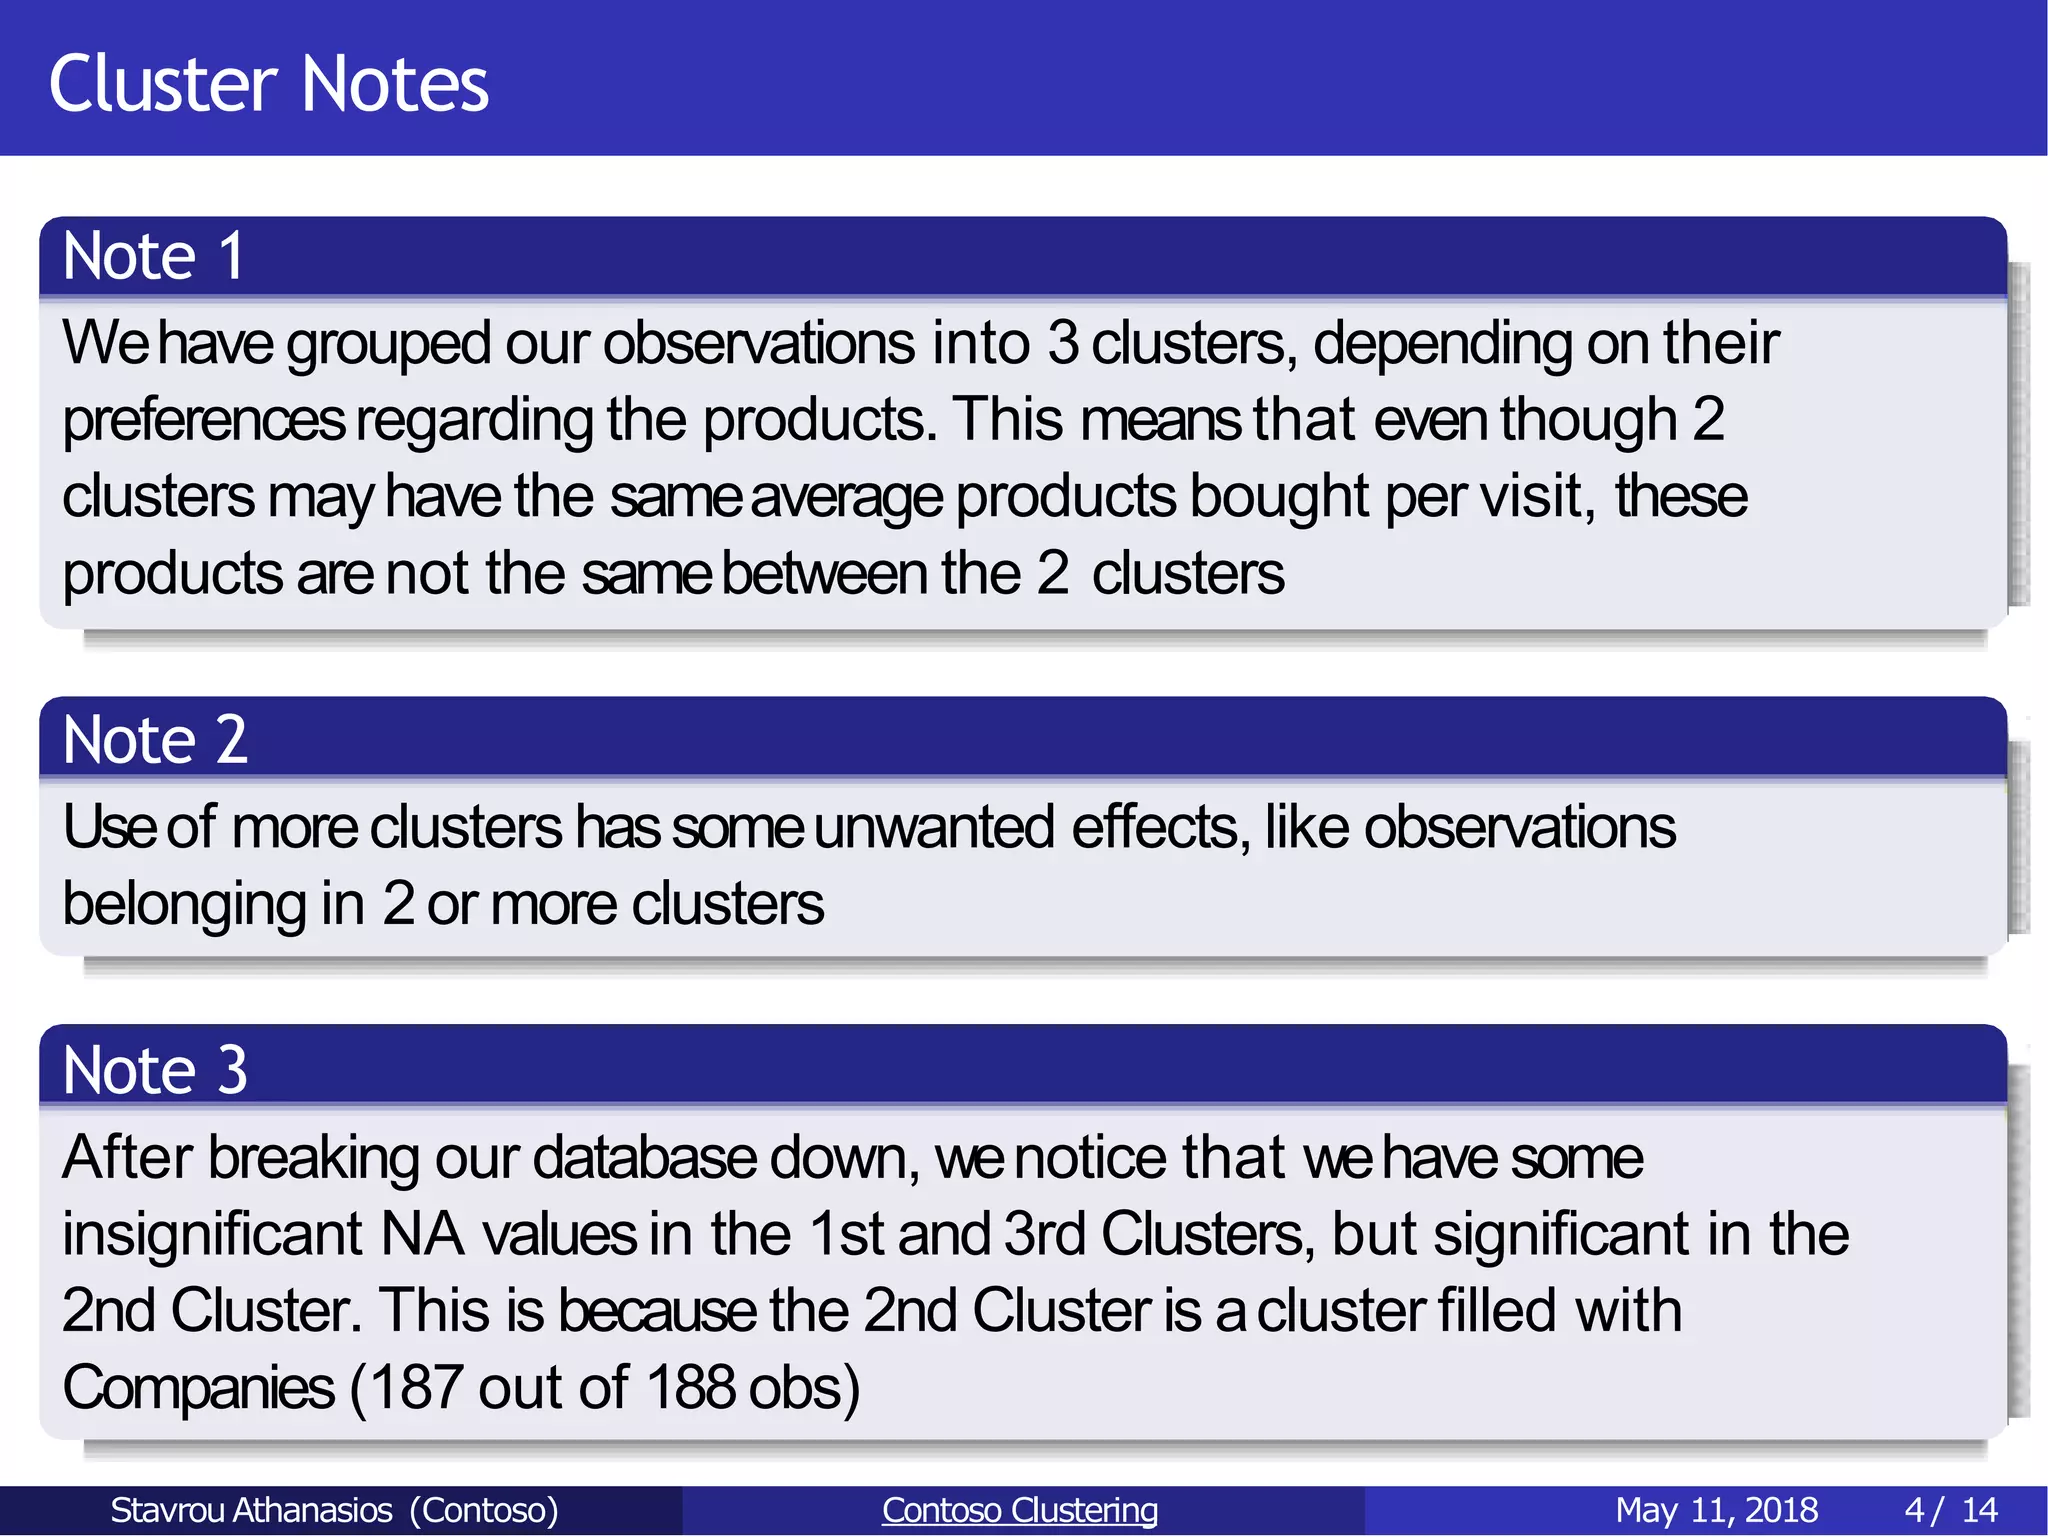
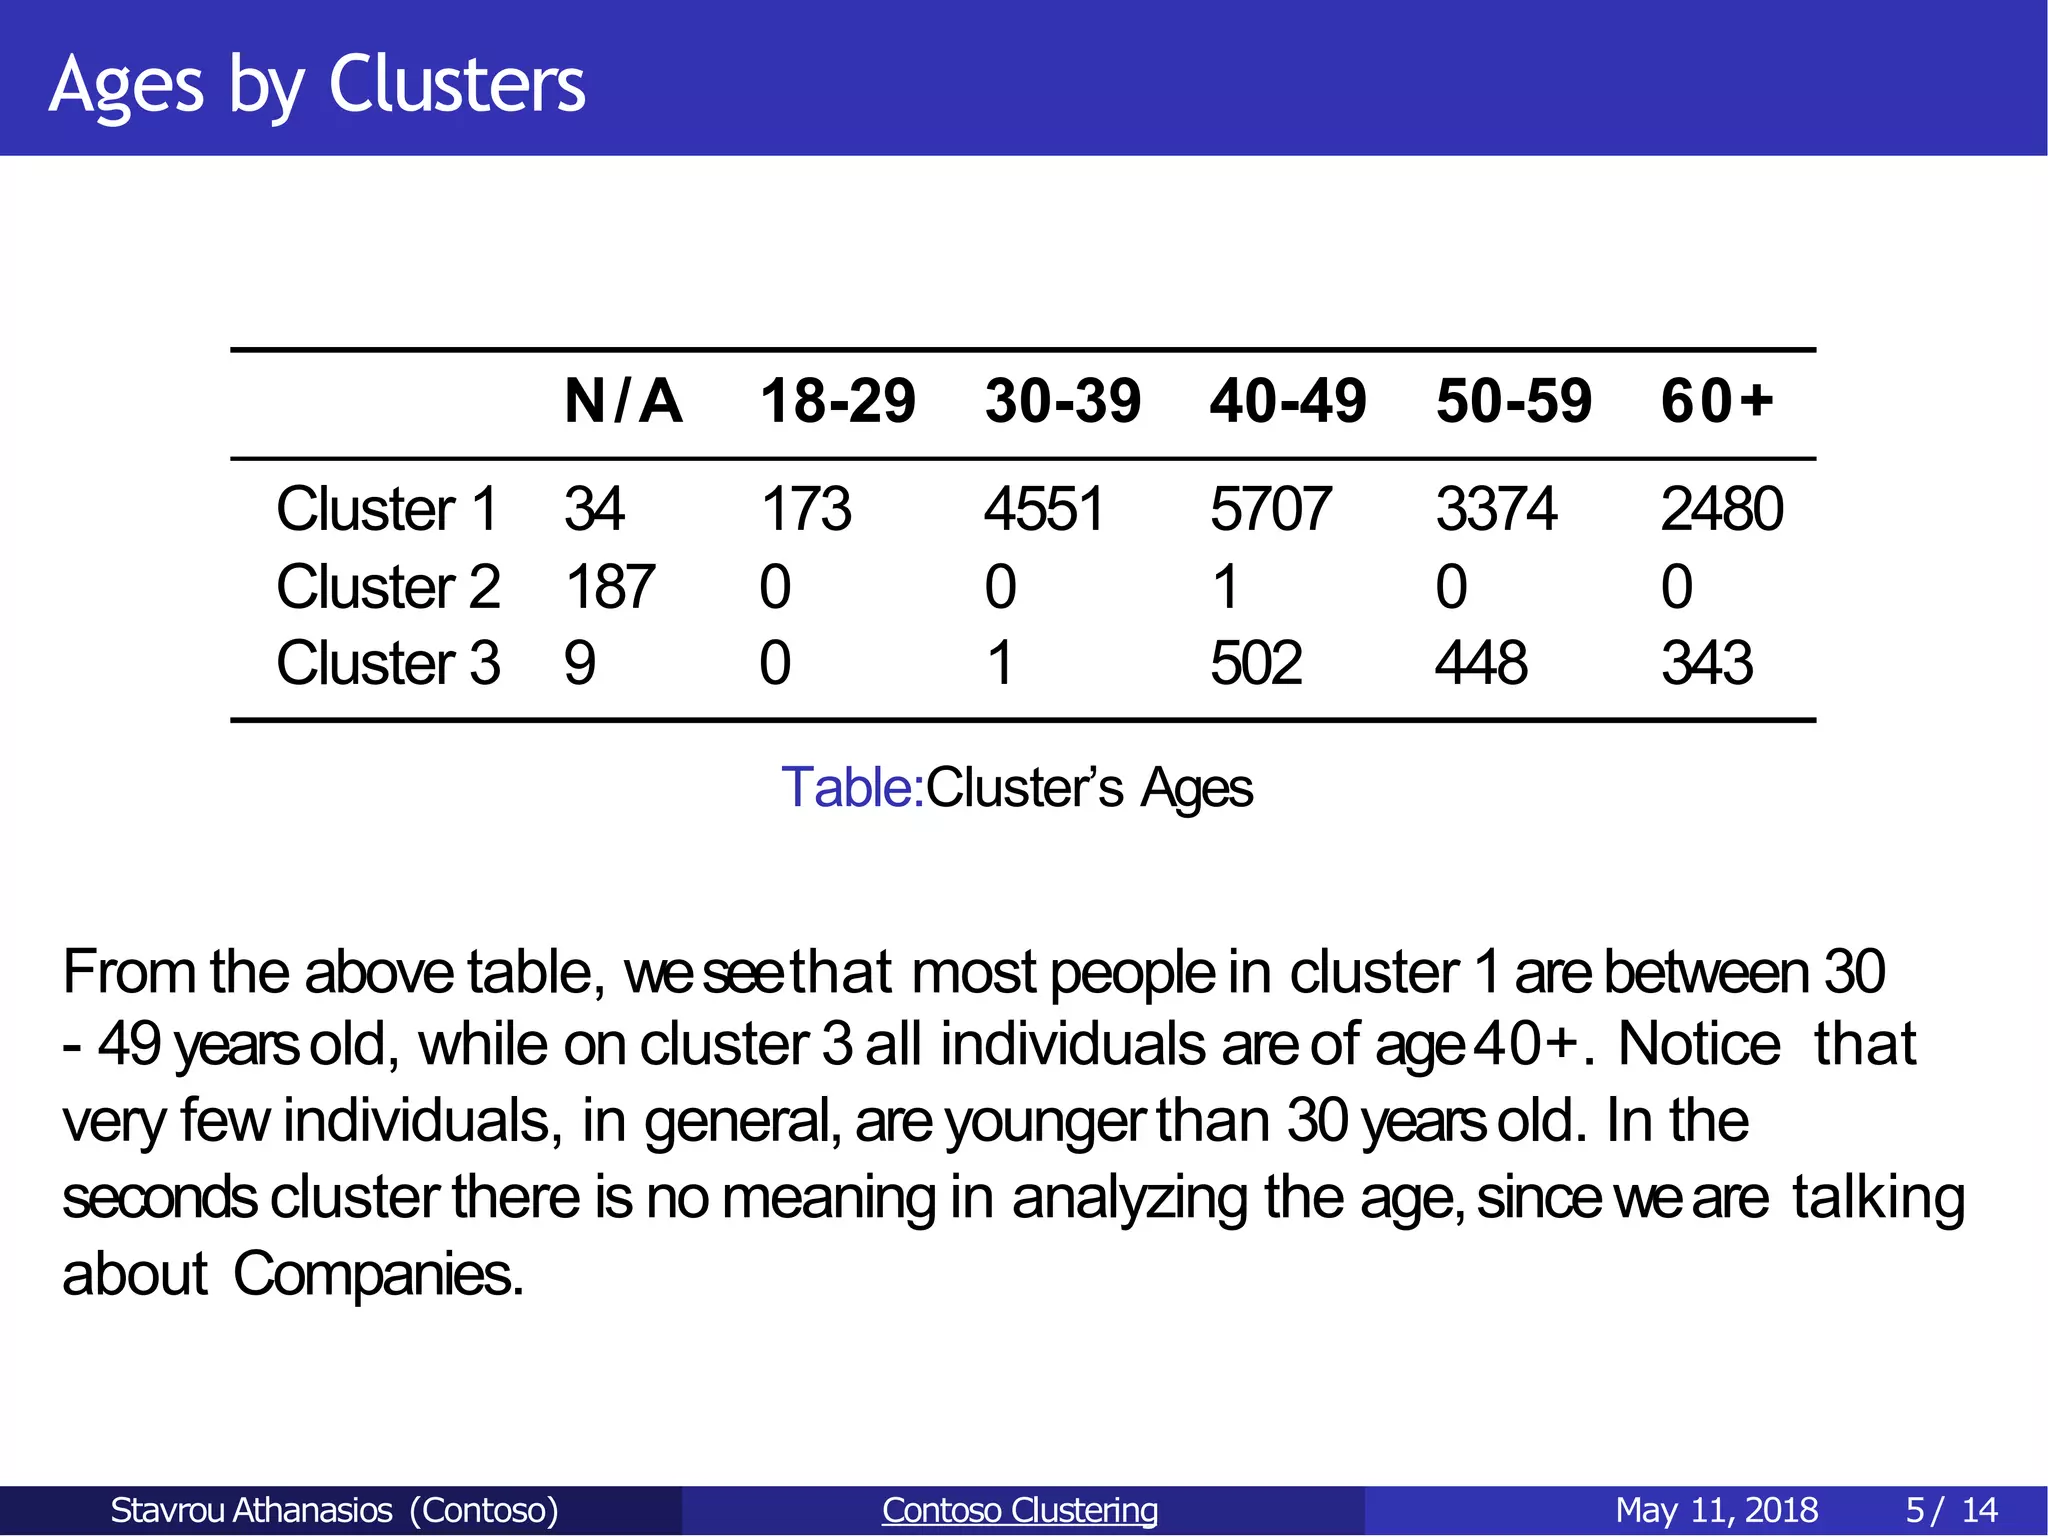
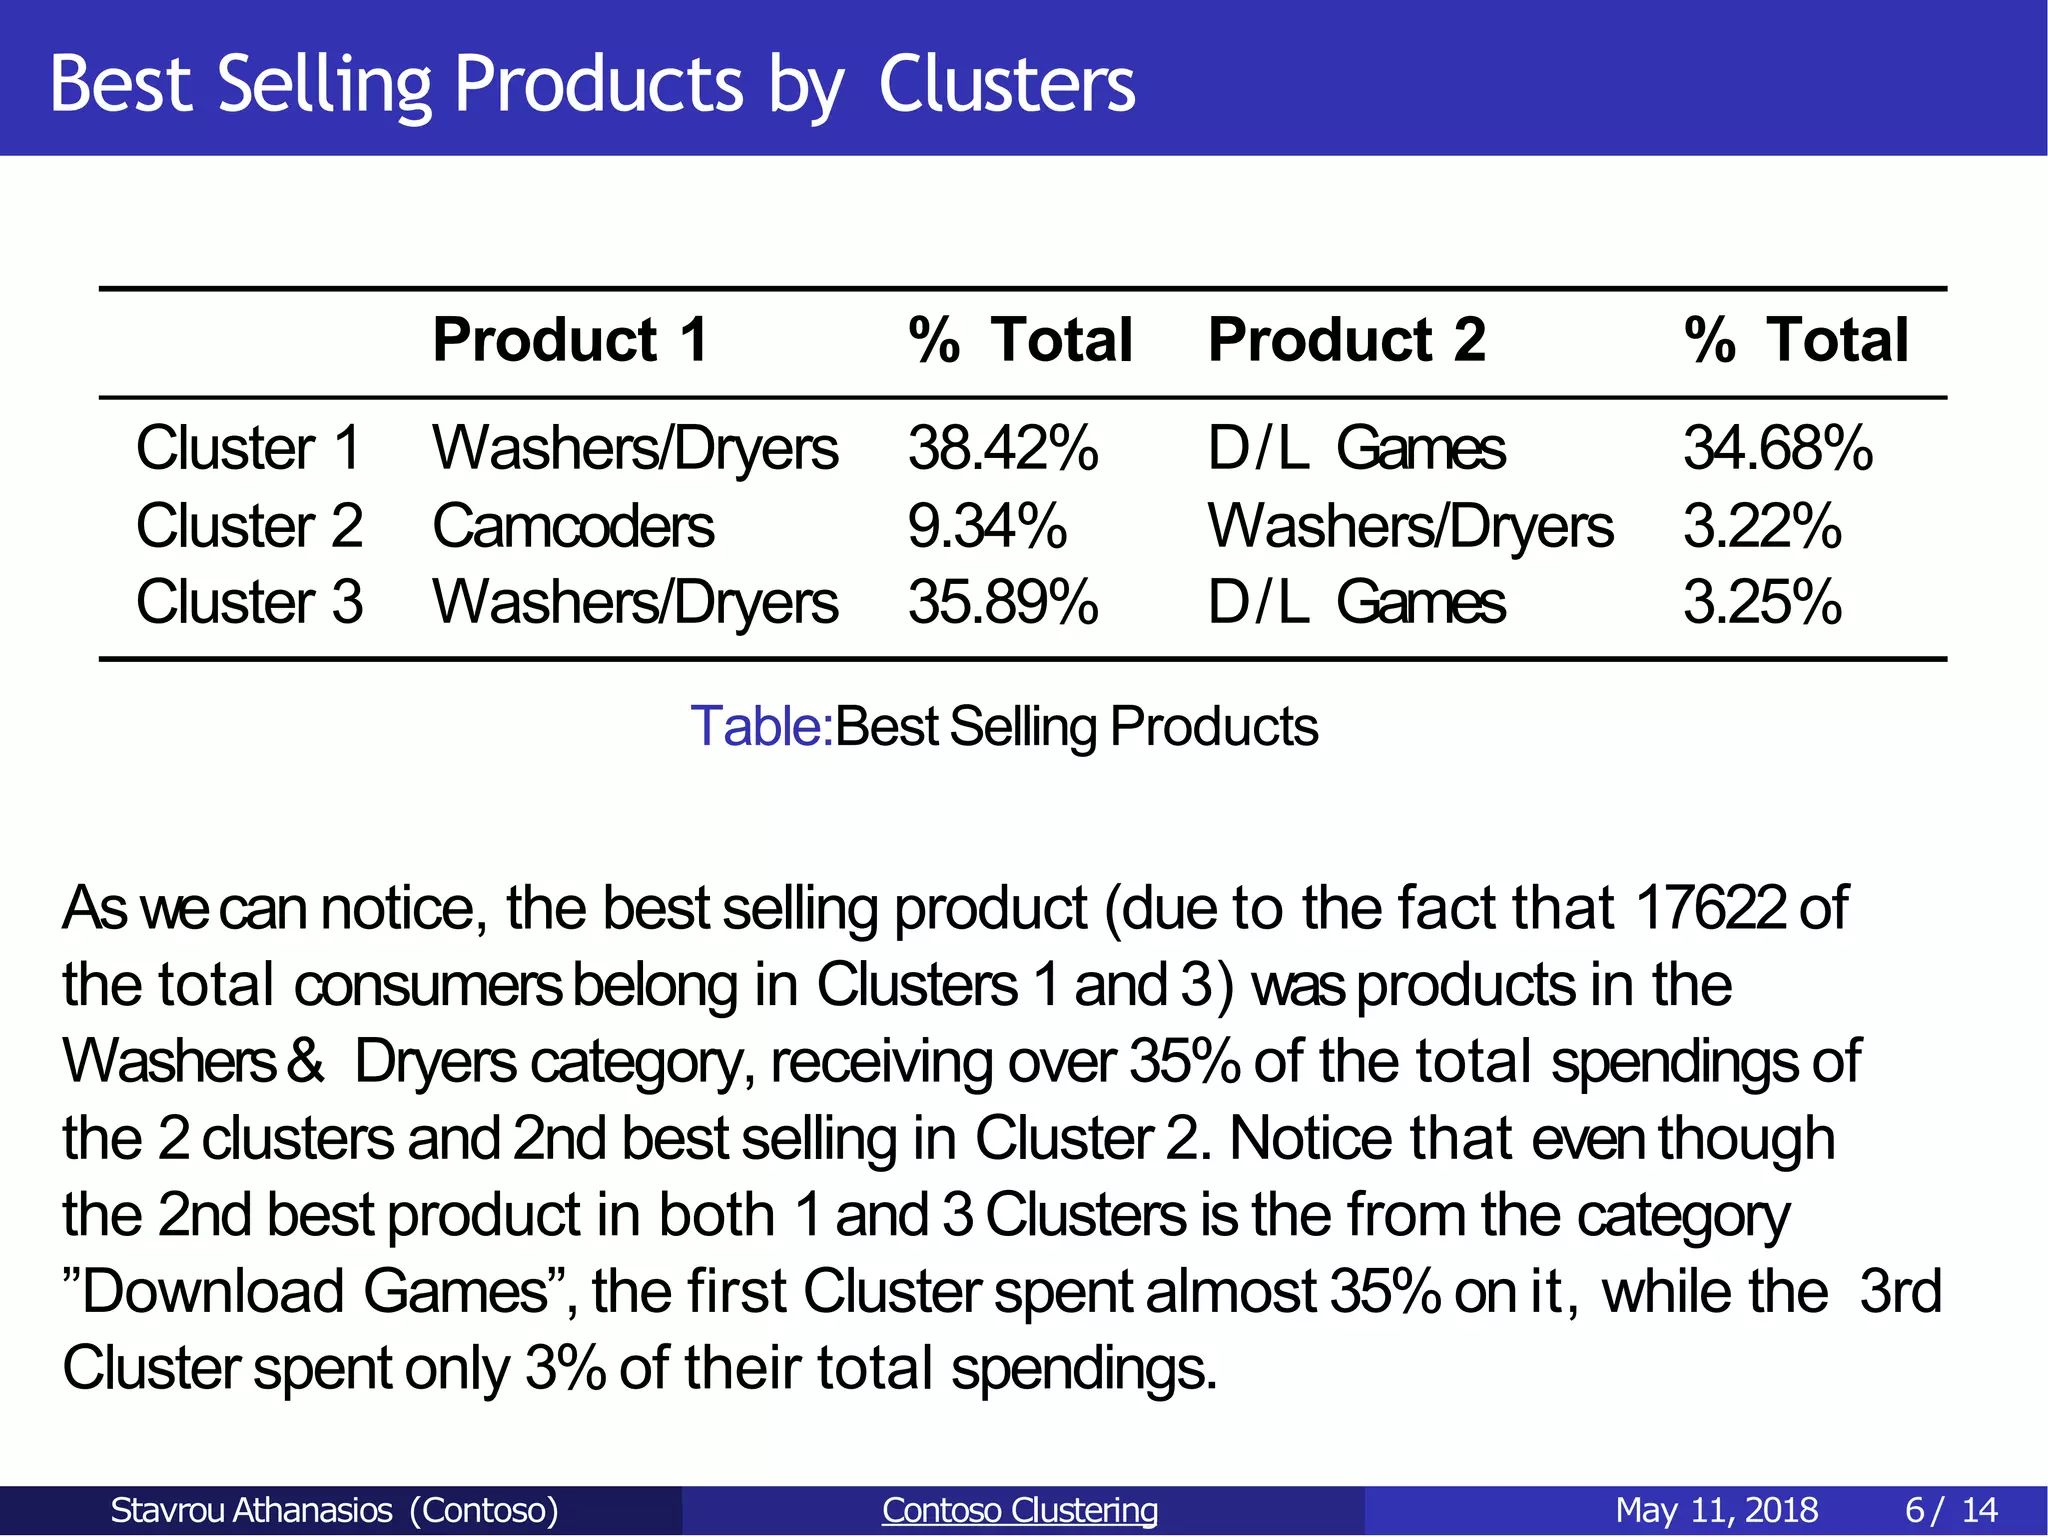
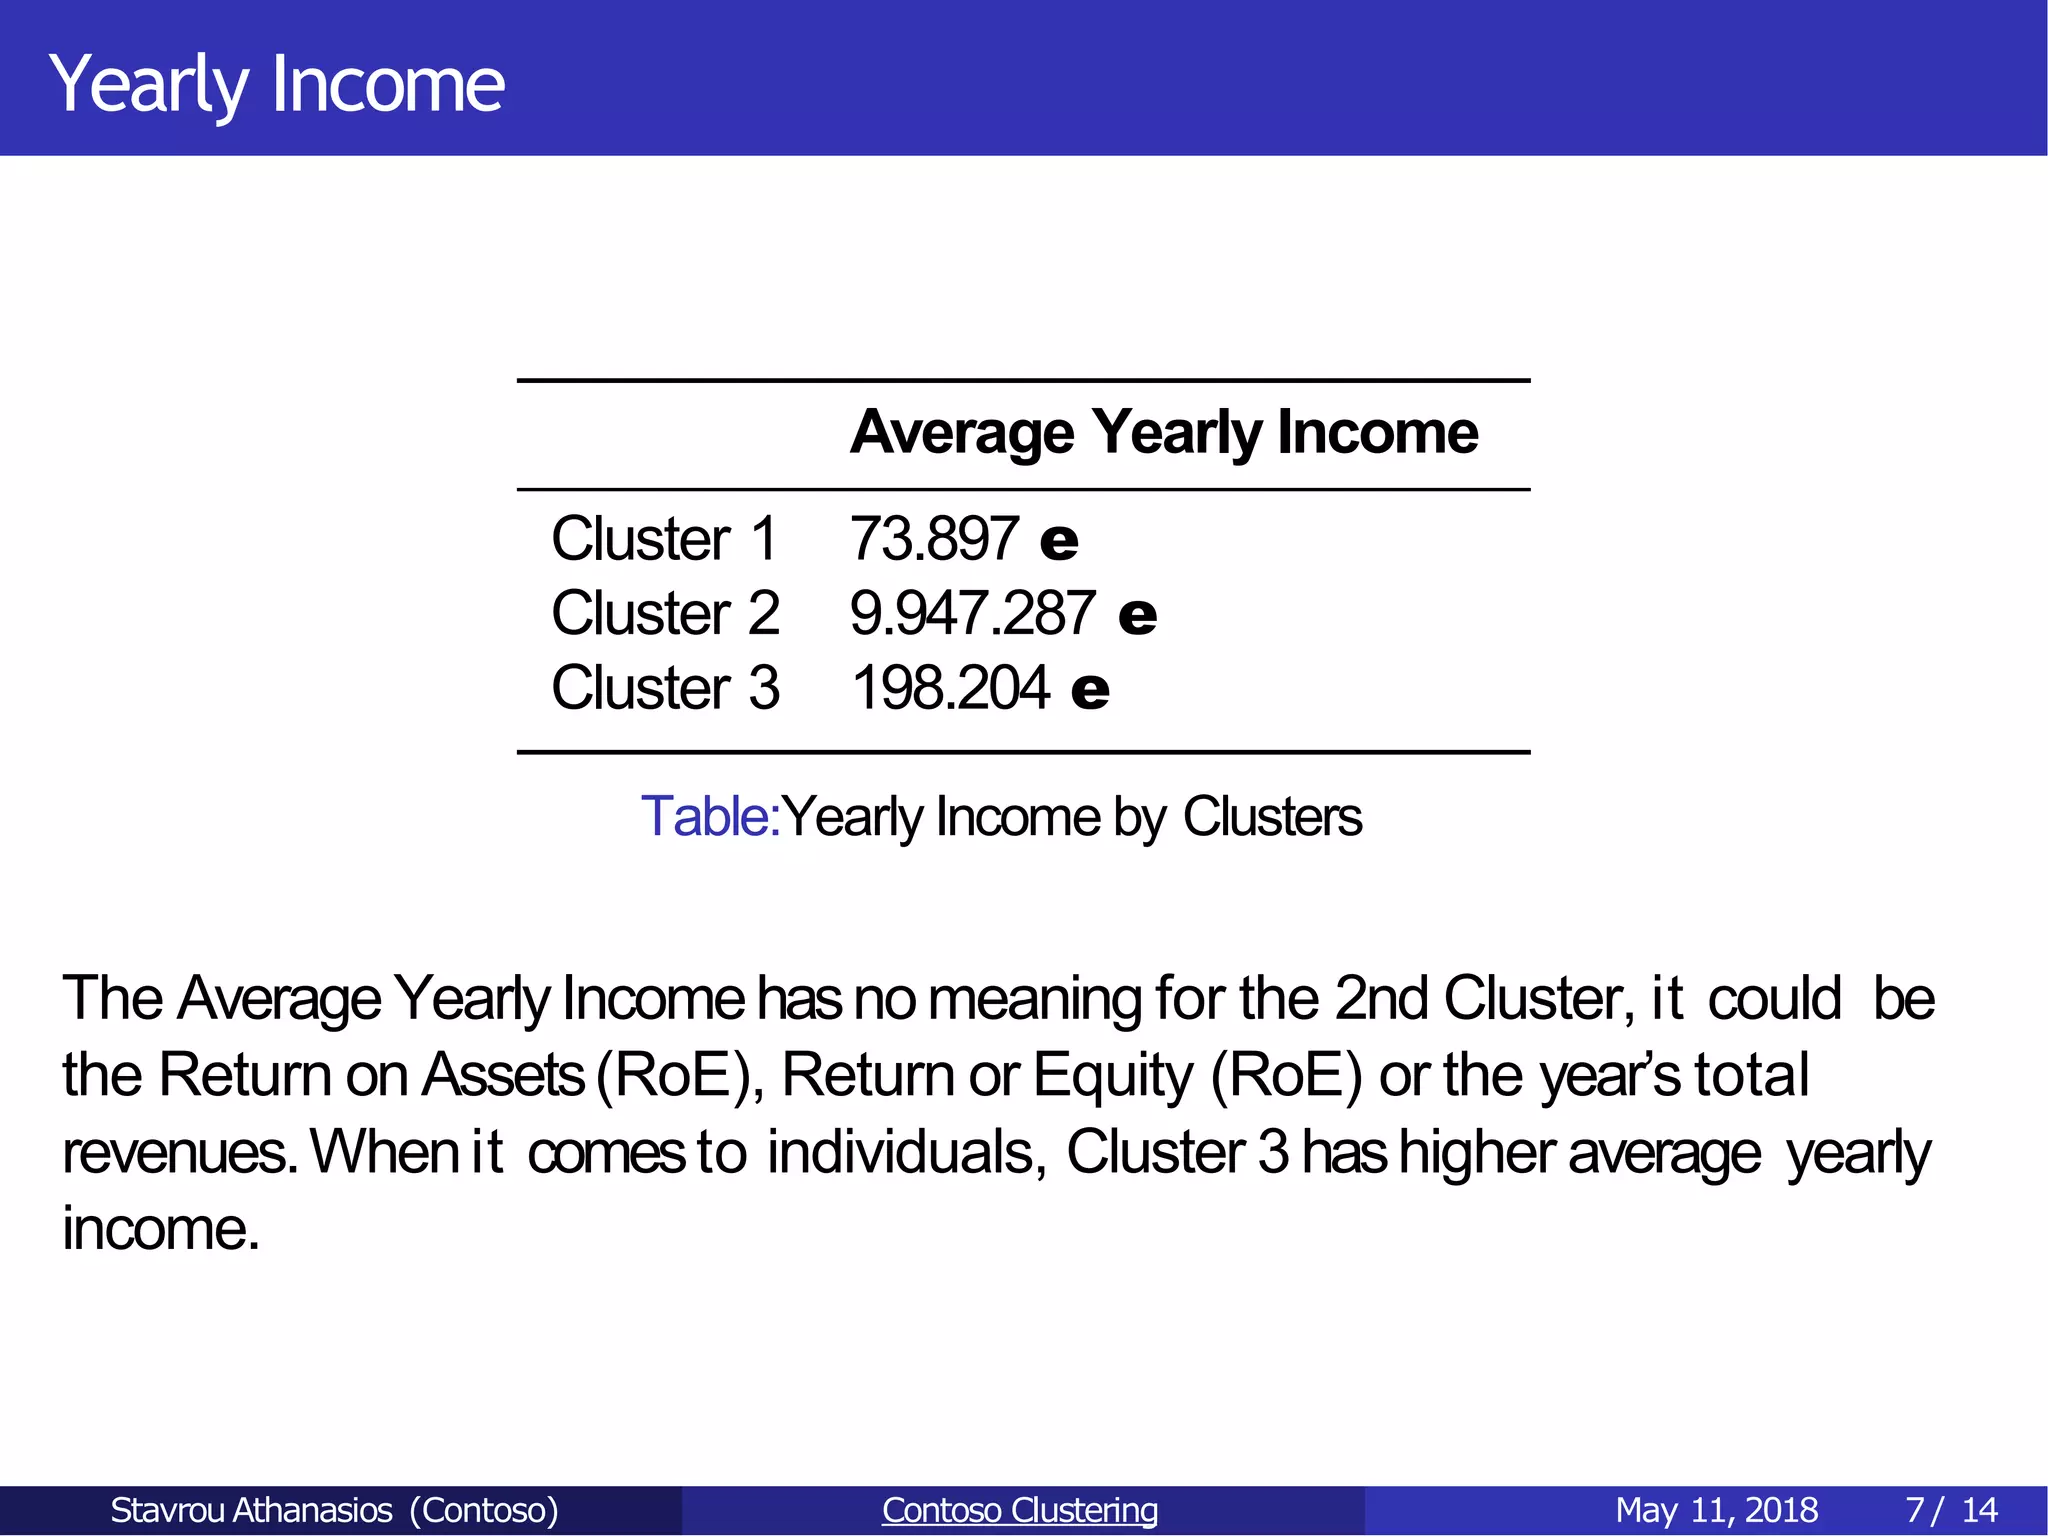
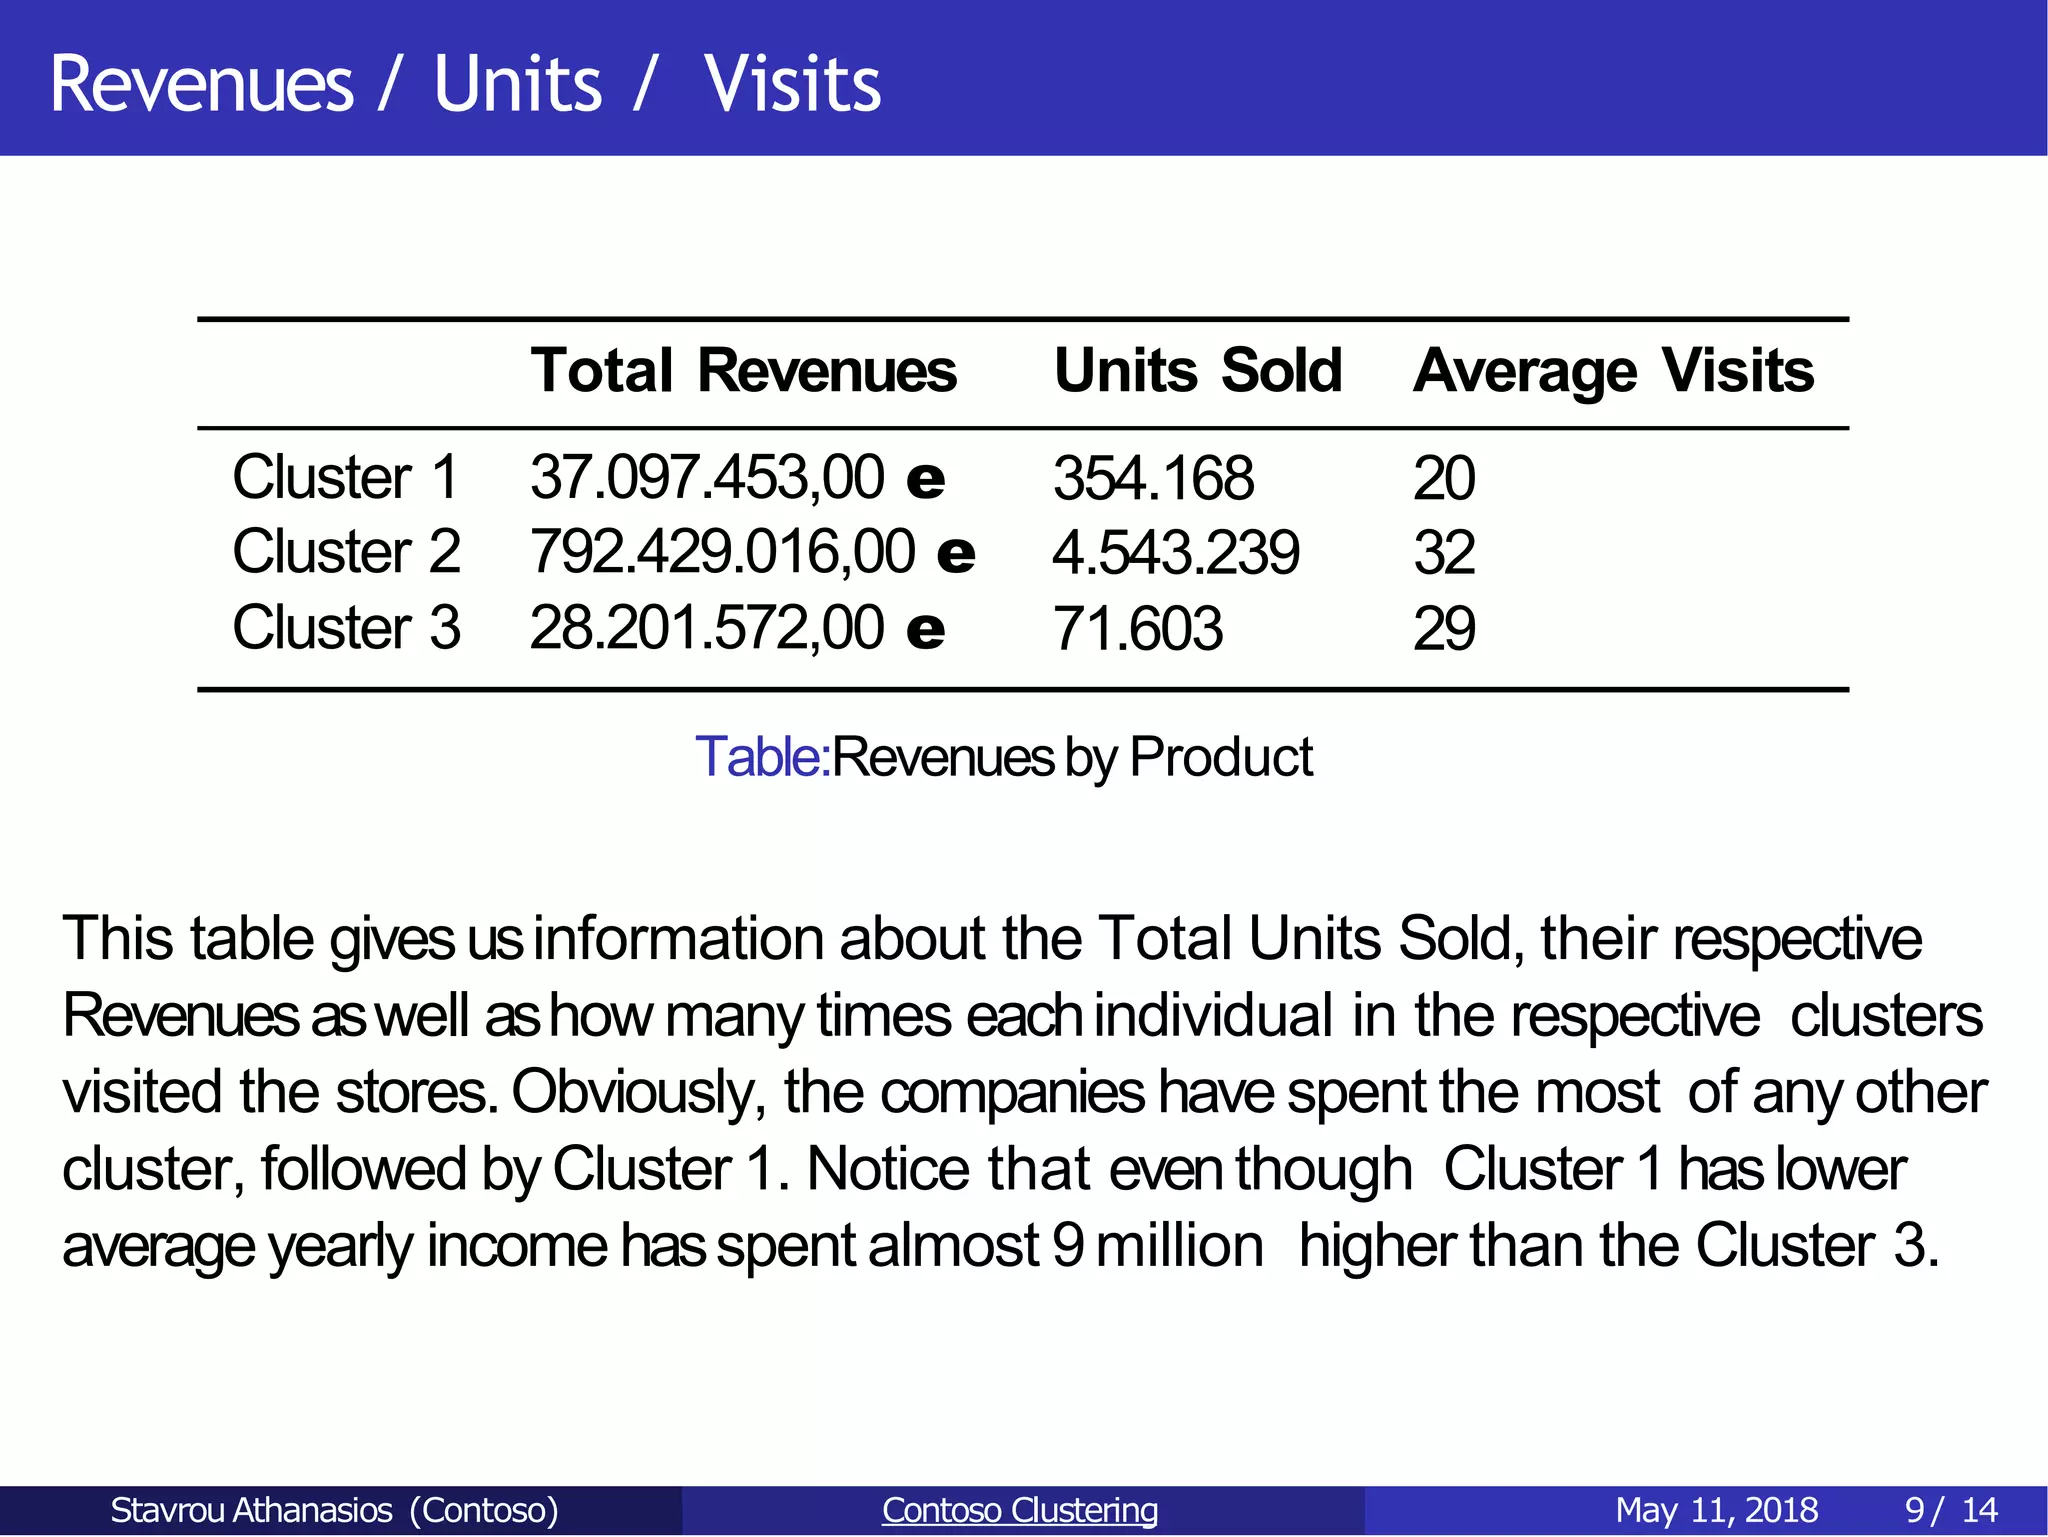
Clients Clustering
Stavrou Athanasios
Contoso
May 11,2018
Stavrou Athanasios (Contoso) Contoso Clustering May 11, 2018 1/ 14
The Clusters (year 2009)
Clients into 3 clusters
Sizes of 16319, 188, 1303respectively (17810 total observations)
Analyze them regarding the monetary variables (averagerevenueper
visit, total revenue, number of visits etc.)
The 2nd Cluster (187 observations)areCompanies, 1st and3rd
Clusters areindividuals
Stavrou Athanasios (Contoso) Contoso Clustering May 11, 2018 2/ 14
Cluster Plot
Stavrou Athanasios (Contoso) Contoso Clustering May 11, 2018 3/ 14
Cluster Notes
Note 1
Wehave grouped our observations into 3 clusters, depending on their
preferencesregarding the products. This meansthat eventhough 2
clustersmayhavethe sameaverageproducts bought per visit, these
products arenot the samebetween the 2 clusters
Note 2
Useof moreclustershassomeunwanted effects, like observations
belonging in 2 or more clusters
Note 3
After breaking our database down, wenotice that wehavesome
insignificant NA valuesin the 1st and3rd Clusters, but significant in the
2nd Cluster. This is becausethe 2nd Cluster is acluster filled with
Companies (187 out of 188 obs)
Stavrou Athanasios (Contoso) Contoso Clustering May 11, 2018 4/ 14
Ages by Clusters
N/A 18-29 30-39 40-49 50-59 60+
Cluster 1 34 173 4551 5707 3374 2480
Cluster 2 187 0 0 1 0 0
Cluster 3 9 0 1 502 448 343
Table:Cluster’s Ages
From the above table, weseethat most peoplein cluster 1arebetween 30
- 49 yearsold, while on cluster 3 all individuals areof age40+. Notice that
very few individuals, in general,areyoungerthan 30yearsold. In the
secondscluster there is no meaning in analyzing the age,sinceweare talking
about Companies.
Stavrou Athanasios (Contoso) Contoso Clustering May 11, 2018 5/ 14
Best Selling Products by Clusters
Product 1 % Total Product 2 % Total
Cluster 1 Washers/Dryers 38.42% D/L Games 34.68%
Cluster 2 Camcoders 9.34% Washers/Dryers 3.22%
Cluster 3 Washers/Dryers 35.89% D/L Games 3.25%
Table:Best Selling Products
As wecan notice, the best selling product (due to the fact that 17622of
the total consumersbelong in Clusters 1 and3) wasproducts in the
Washers& Dryers category, receiving over 35%of the total spendings of
the 2clusters and2nd best selling in Cluster 2. Notice that eventhough
the 2nd best product in both 1and3Clusters is the from the category
”Download Games”, the first Cluster spent almost 35%on it, while the 3rd
Cluster spent only 3%of their total spendings.
Stavrou Athanasios (Contoso) Contoso Clustering May 11, 2018 6/ 14
Yearly Income
Average Yearly Income
Cluster 1 73.897 e
Cluster 2 9.947.287 e
Cluster 3 198.204 e
Table:Yearly Income by Clusters
The Average YearlyIncomehasnomeaning for the 2nd Cluster, it could be
the Return on Assets(RoE), Return or Equity (RoE) or the year’s total
revenues.Whenit comesto individuals, Cluster 3 hashigher average yearly
income.
Stavrou Athanasios (Contoso) Contoso Clustering May 11, 2018 7/ 14
Marital Status by Clusters
N/A Married Single
Cluster 1 34 8763 7522
Cluster 2 187 1 0
Cluster 3 9 825 469
Table:Marital Status
Weseethat most peoplein the population areMarried, but in Cluster 3
almost two out of three consumersareMarried, while in Cluster 1almost
50 percent are Married.
Stavrou Athanasios (Contoso) Contoso Clustering May 11, 2018 8/ 14
Revenues / Units / Visits
Total Revenues Units Sold Average Visits
Cluster 1 37.097.453,00 e 354.168 20
Cluster 2 792.429.016,00 e 4.543.239 32
Cluster 3 28.201.572,00 e 71.603 29
Table:Revenuesby Product
This table givesusinformation about the Total Units Sold, their respective
Revenuesaswell ashowmany times eachindividual in the respective clusters
visited the stores.Obviously, the companies have spent the most of any other
cluster, followed byCluster 1. Notice that eventhough Cluster 1 haslower
averageyearly income hasspent almost 9million higher than the Cluster 3.
Stavrou Athanasios (Contoso) Contoso Clustering May 11, 2018 9/ 14
Children & Gender
N/A Average Children Male Female
Cluster 1 34 2 8211 8074
Cluster 2 187 0 1 0
Cluster 3 9 2 679 615
Table:Children & Gender
Onceagain, the total children andgendervariables have no meaning when it
comesto Cluster 2. Weseethat there aremoreMales than Females, but
moreor lessthey arehalf-half, with 2children on average.This means that
the children an individuals has,or their gendergivesusno information
regarding the Cluster they are in.
Stavrou Athanasios (Contoso) Contoso Clustering May 11, 2018 10/ 14
Education
N/A BSc. MSc. HS Partial Col Partial HS
Cluster 1 34 4861 2937 2604 4616 1267
Cluster 2 187 1 0 0 0 0
Cluster 3 9 455 243 213 345 38
Table:Education
Due to the bounded space,BSc. = College,MSc. = GraduateDegree, HS
= High School, Partial Col = Partial College andPartial HS= Partial High
School. Leaving Cluster 2 aside,weseethat in Clusters 1and 2most have
goneto College (graduated or not), andthat most of them finish High
School. Almost 2out of 3individuals have beenin College,in both Clusters.
Stavrou Athanasios (Contoso) Contoso Clustering May 11, 2018 11/ 14
Continent Breakdown
Asia Europe North America
Cluster 1 3597 4869 7853
Cluster 2 35 19 134
Cluster 3 0 645 658
Table:Revenuesby Product
Wenotice that the clusters areconsisted of different Continents. More
specifically, the Companies in Cluster 2 comemainly from North America,
the most individuals in Cluster 1comefrom North America, while in Cluster
3the Continent of origin is split half-half between Europe and North
America. Notice that 187 our of 230companies comefrom NA, 34 from EU
and9 from Asia.
Stavrou Athanasios (Contoso) Contoso Clustering May 11, 2018 12/ 14
Conclusions 1
In general,wehave 3Clusters, for the year2009. Thesearedifferentiated by
the revenuesper product and havesomedifferent characteristics. The
Cluster 2 is the richest one,bought the most units and brought the most
revenuesto the company.The mostly bought product comefrom the
”camcoders” category (9% of their total purchases)and their preferences
vary,asthe products they bought vary.In contrast, Cluster 1 mostly
purchased only two categories, Washers/Dryers andDownload Games (over
70%of the total purchases).Cluster 3bought mostly Washers/Dyers,but
they purchased many other products in small quantities. Wealso noted that
most individuals / companies comefrom NA, followed byEU and Asia.
Stavrou Athanasios (Contoso) Contoso Clustering May 11, 2018 13/ 14
Conclusions 2
Moving on, wehave no other characteristics about the secondcluster, due to
the nature of the type of variable (being Companies). Regarding Clusters1
and3, wenotice that Cluster 1haslower averageagethan Cluster 3, aswell
asbigger size(number of customersthat belong in it). It seemsthat the 2
clusters havethe samepercentagesof Males / Females. Another
characteristic that differs, is the fact that in Cluster 1 almost 1in 2people
aremarried, while in Cluster 3only 1 in 3is married. Lastly, the 2clusters
havepeoplewith, moreor less,the samelevel of education within its
individuals. Most peoplehave attended College,whether partially or fully.
Stavrou Athanasios (Contoso) Contoso Clustering May 11, 2018 14/ 14

Consumers clustering

  • 1.
    Clients Clustering Stavrou Athanasios Contoso May11,2018 Stavrou Athanasios (Contoso) Contoso Clustering May 11, 2018 1/ 14
  • 2.
    The Clusters (year2009) Clients into 3 clusters Sizes of 16319, 188, 1303respectively (17810 total observations) Analyze them regarding the monetary variables (averagerevenueper visit, total revenue, number of visits etc.) The 2nd Cluster (187 observations)areCompanies, 1st and3rd Clusters areindividuals Stavrou Athanasios (Contoso) Contoso Clustering May 11, 2018 2/ 14
  • 3.
    Cluster Plot Stavrou Athanasios(Contoso) Contoso Clustering May 11, 2018 3/ 14
  • 4.
    Cluster Notes Note 1 Wehavegrouped our observations into 3 clusters, depending on their preferencesregarding the products. This meansthat eventhough 2 clustersmayhavethe sameaverageproducts bought per visit, these products arenot the samebetween the 2 clusters Note 2 Useof moreclustershassomeunwanted effects, like observations belonging in 2 or more clusters Note 3 After breaking our database down, wenotice that wehavesome insignificant NA valuesin the 1st and3rd Clusters, but significant in the 2nd Cluster. This is becausethe 2nd Cluster is acluster filled with Companies (187 out of 188 obs) Stavrou Athanasios (Contoso) Contoso Clustering May 11, 2018 4/ 14
  • 5.
    Ages by Clusters N/A18-29 30-39 40-49 50-59 60+ Cluster 1 34 173 4551 5707 3374 2480 Cluster 2 187 0 0 1 0 0 Cluster 3 9 0 1 502 448 343 Table:Cluster’s Ages From the above table, weseethat most peoplein cluster 1arebetween 30 - 49 yearsold, while on cluster 3 all individuals areof age40+. Notice that very few individuals, in general,areyoungerthan 30yearsold. In the secondscluster there is no meaning in analyzing the age,sinceweare talking about Companies. Stavrou Athanasios (Contoso) Contoso Clustering May 11, 2018 5/ 14
  • 6.
    Best Selling Productsby Clusters Product 1 % Total Product 2 % Total Cluster 1 Washers/Dryers 38.42% D/L Games 34.68% Cluster 2 Camcoders 9.34% Washers/Dryers 3.22% Cluster 3 Washers/Dryers 35.89% D/L Games 3.25% Table:Best Selling Products As wecan notice, the best selling product (due to the fact that 17622of the total consumersbelong in Clusters 1 and3) wasproducts in the Washers& Dryers category, receiving over 35%of the total spendings of the 2clusters and2nd best selling in Cluster 2. Notice that eventhough the 2nd best product in both 1and3Clusters is the from the category ”Download Games”, the first Cluster spent almost 35%on it, while the 3rd Cluster spent only 3%of their total spendings. Stavrou Athanasios (Contoso) Contoso Clustering May 11, 2018 6/ 14
  • 7.
    Yearly Income Average YearlyIncome Cluster 1 73.897 e Cluster 2 9.947.287 e Cluster 3 198.204 e Table:Yearly Income by Clusters The Average YearlyIncomehasnomeaning for the 2nd Cluster, it could be the Return on Assets(RoE), Return or Equity (RoE) or the year’s total revenues.Whenit comesto individuals, Cluster 3 hashigher average yearly income. Stavrou Athanasios (Contoso) Contoso Clustering May 11, 2018 7/ 14
  • 8.
    Marital Status byClusters N/A Married Single Cluster 1 34 8763 7522 Cluster 2 187 1 0 Cluster 3 9 825 469 Table:Marital Status Weseethat most peoplein the population areMarried, but in Cluster 3 almost two out of three consumersareMarried, while in Cluster 1almost 50 percent are Married. Stavrou Athanasios (Contoso) Contoso Clustering May 11, 2018 8/ 14
  • 9.
    Revenues / Units/ Visits Total Revenues Units Sold Average Visits Cluster 1 37.097.453,00 e 354.168 20 Cluster 2 792.429.016,00 e 4.543.239 32 Cluster 3 28.201.572,00 e 71.603 29 Table:Revenuesby Product This table givesusinformation about the Total Units Sold, their respective Revenuesaswell ashowmany times eachindividual in the respective clusters visited the stores.Obviously, the companies have spent the most of any other cluster, followed byCluster 1. Notice that eventhough Cluster 1 haslower averageyearly income hasspent almost 9million higher than the Cluster 3. Stavrou Athanasios (Contoso) Contoso Clustering May 11, 2018 9/ 14
  • 10.
    Children & Gender N/AAverage Children Male Female Cluster 1 34 2 8211 8074 Cluster 2 187 0 1 0 Cluster 3 9 2 679 615 Table:Children & Gender Onceagain, the total children andgendervariables have no meaning when it comesto Cluster 2. Weseethat there aremoreMales than Females, but moreor lessthey arehalf-half, with 2children on average.This means that the children an individuals has,or their gendergivesusno information regarding the Cluster they are in. Stavrou Athanasios (Contoso) Contoso Clustering May 11, 2018 10/ 14
  • 11.
    Education N/A BSc. MSc.HS Partial Col Partial HS Cluster 1 34 4861 2937 2604 4616 1267 Cluster 2 187 1 0 0 0 0 Cluster 3 9 455 243 213 345 38 Table:Education Due to the bounded space,BSc. = College,MSc. = GraduateDegree, HS = High School, Partial Col = Partial College andPartial HS= Partial High School. Leaving Cluster 2 aside,weseethat in Clusters 1and 2most have goneto College (graduated or not), andthat most of them finish High School. Almost 2out of 3individuals have beenin College,in both Clusters. Stavrou Athanasios (Contoso) Contoso Clustering May 11, 2018 11/ 14
  • 12.
    Continent Breakdown Asia EuropeNorth America Cluster 1 3597 4869 7853 Cluster 2 35 19 134 Cluster 3 0 645 658 Table:Revenuesby Product Wenotice that the clusters areconsisted of different Continents. More specifically, the Companies in Cluster 2 comemainly from North America, the most individuals in Cluster 1comefrom North America, while in Cluster 3the Continent of origin is split half-half between Europe and North America. Notice that 187 our of 230companies comefrom NA, 34 from EU and9 from Asia. Stavrou Athanasios (Contoso) Contoso Clustering May 11, 2018 12/ 14
  • 13.
    Conclusions 1 In general,wehave3Clusters, for the year2009. Thesearedifferentiated by the revenuesper product and havesomedifferent characteristics. The Cluster 2 is the richest one,bought the most units and brought the most revenuesto the company.The mostly bought product comefrom the ”camcoders” category (9% of their total purchases)and their preferences vary,asthe products they bought vary.In contrast, Cluster 1 mostly purchased only two categories, Washers/Dryers andDownload Games (over 70%of the total purchases).Cluster 3bought mostly Washers/Dyers,but they purchased many other products in small quantities. Wealso noted that most individuals / companies comefrom NA, followed byEU and Asia. Stavrou Athanasios (Contoso) Contoso Clustering May 11, 2018 13/ 14
  • 14.
    Conclusions 2 Moving on,wehave no other characteristics about the secondcluster, due to the nature of the type of variable (being Companies). Regarding Clusters1 and3, wenotice that Cluster 1haslower averageagethan Cluster 3, aswell asbigger size(number of customersthat belong in it). It seemsthat the 2 clusters havethe samepercentagesof Males / Females. Another characteristic that differs, is the fact that in Cluster 1 almost 1in 2people aremarried, while in Cluster 3only 1 in 3is married. Lastly, the 2clusters havepeoplewith, moreor less,the samelevel of education within its individuals. Most peoplehave attended College,whether partially or fully. Stavrou Athanasios (Contoso) Contoso Clustering May 11, 2018 14/ 14