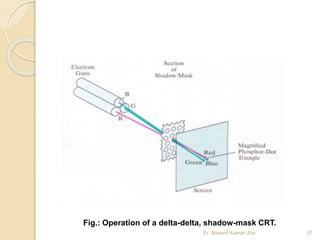
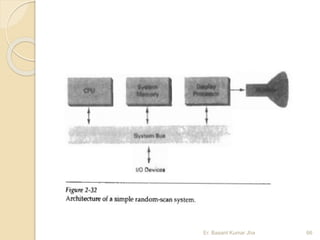
SlideShare a Scribd company logo
1 of 67
COMPUTER GRAPHICS
AND ANIMATION
Er. Basant Kumar Jha
Er. Basant Kumar Jha 1
UNIT 1
INTRODUCTION
Er. Basant Kumar Jha 2
 Computer graphics is an art of drawing pictures
on computer screens with the help of
programming.
 It involves computations, creation, and
manipulation of data.
 In other words, we can say that computer
graphics is a rendering tool for the generation
and manipulation of images.
 Today, computer graphics is a core technology in
digital photography, film, video games, cell phone
and computer displays, and many specialized
applications.
 A great deal of specialized hardware and
software has been developed, with the displays
of most devices being driven by computer
graphics hardware. Er. Basant Kumar Jha 3
Advantages of Computer
Graphics
 It provides tools for producing pictures not only of
concrete real world objects but also of abstract,
synthetic objects such as mathematical surface in 4D
and of data that have no inherent geometry such as
survey results.
 It has the ability to show moving pictures and thus it is
possible to produce animations with computer graphics.
 With computer graphics user can also control the
animation speed, portion of the view and the amount of
details shown.
 The computer graphics provides tool called Motion
dynamics. With this tool user can move and tumble
objects with respect to a stationary observer, or he can
make objects stationary and the viewer moving around
them. A typical example is walk through made by builder
to show flat interior and building surroundings. In many
case it is also possible to move both objects and viewer.
Er. Basant Kumar Jha 4
Advantages of Computer
Graphics (contd.)
The computer graphics also provides
facility called update dynamics. With
update dynamics, it is possible to change
the shape, color or other properties of
the objects being viewed.
With the recent development of digital
signal processing (DSP) and audio
synthesis chip the interactive graphics
can now provide audio feedback along
with the graphical feedbacks to make the
simulated environment even more
realistic.
Er. Basant Kumar Jha 5
Areas of Applications
1. Education and Training: Computer-
generated model of the physical, financial
and economic system is often used as
educational aids. Model of physical
systems, physiological system, population
trends or equipment can help trainees to
understand the operation of the system. For
some training applications, particular
systems are designed. For example: Flight
Simulator.
 Flight Simulator: It helps in giving training
to the pilots of airplanes. These pilots spend
much of their training not in a real aircraft
but on the ground at the controls of a Flight
Simulator.
Er. Basant Kumar Jha 6
Areas of Applications (contd.)
2. Use in Biology: Molecular biologist can
display a picture of molecules and gain
insight into their structure with the help of
computer graphics.
3. Computer-Generated Maps: Town
planners and transportation engineers can
use computer-generated maps which
display data useful to them in their planning
work.
4. Architect: Architect can explore an
alternative solution to design problems at an
interactive graphics terminal. In this way,
they can test many more solutions that
would not be possible without the computer.
Er. Basant Kumar Jha 7
Areas of Applications (contd.)
5. Presentation Graphics: Example of
presentation Graphics are bar charts, line
graphs, pie charts and other displays showing
relationships between multiple parameters.
Presentation Graphics is commonly used to
summarize
 Financial Reports
 Statistical Reports
 Mathematical Reports
 Scientific Reports
 Economic Data for research reports
 Managerial Reports
 Consumer Information Bulletins
 And other types of reports
Er. Basant Kumar Jha 8
Areas of Applications (contd.)
6. Computer Art: Computer Graphics are also used in
the field of commercial arts. It is used to generate
television and advertising commercial.
7. Entertainment: Computer Graphics are now
commonly used in making motion pictures, music
videos and television shows.
8. Visualization: It is used for visualization of scientists,
engineers, medical personnel, business analysts for
the study of a large amount of information.
9. Educational Software: Computer Graphics is used in
the development of educational software for making
computer-aided instruction.
10. Printing Technology: Computer Graphics is used for
printing technology and textile design.
Er. Basant Kumar Jha 9
11. Graphical User Interfaces: It is common now for
software packages to provide a graphical interface. A
major component of a graphical interface is a window
manager that allows a user to display multiple-window
areas. Each window can contain a different process
that can contain graphical or nongraphical displays.
To make a particular window active, we simply click in
that window using an interactive pointing device.
Interfaces also display menus and icons for fast
selection of processing options or parameter values.
An icon is a graphical symbol that is designed to look
like the processing option it represents. The
advantages of icons are that they take up less screen
space than corresponding textual descriptions and
they can be understood more quickly if well designed.
Menus contain lists of textual descriptions and icons.
Er. Basant Kumar Jha 10
HARDWARE AND
SOFTWARE FOR
COMPUTER GRAPHICS
Er. Basant Kumar Jha 11
 Due to the widespread recognition of the power
and utility of computer graphics in virtually all
fields, a broad range of graphics hardware and
software systems is now available.
 Graphics capabilities for both two-dimensional
and three-dimensional applications are now
common on general-purpose computers,
including many hand-held calculators.
 With personal computers, we can use a wide
variety of interactive input devices and graphics
software packages.
 For higher quality applications, we can choose
from a number of sophisticated special-purpose
graphics hardware systems and technologies.
Er. Basant Kumar Jha 12
Video Display Devices
Typically, the primary output device in
a graphics system is a video monitor.
The operation of most video monitors
is based on the standard cathode-ray
tube (CRT) design, but several other
technologies exist
Er. Basant Kumar Jha 13
Cathode-Ray Tube (CRT)
 Figure below illustrates the basic operation of a
CRT.
 A beam of electrons (cathode rays), emitted by
an electron gun, passes through focusing and
deflection systems that direct the beam toward
specified positions on the phosphor-coated
screen.
 The phosphor then emits a small spot of light at
each position contacted by the electron beam.
 Because the light emitted by the phosphor fades
very rapidly, some method is needed for
maintaining the screen picture.
 One way to keep the phosphor glowing is to
redraw the picture repeatedly by quickly directing
the electron beam back over the same points.
This type of display is called a refresh CRT.
Er. Basant Kumar Jha 14
Cathode-Ray Tube (CRT)
(contd.)
Er. Basant Kumar Jha 15
Cathode-Ray Tube (CRT)
(contd.)
 The primary components of an electron gun in a CRT
are the heated metal cathode and a control grid.
 Heat is supplied to the cathode by directing a current
through a coil of wire, called the filament, inside the
cylindrical cathode structure.
 This causes electrons to be ‘boiled off" the hot cathode
surface.
 In the vacuum inside the CRT envelope, the free,
negatively charged electrons are then accelerated
toward the phosphor coating by a high positive voltage.
 The accelerating voltage can be generated with a
positively charged metal coating on the inside of the
CRT envelope near the phosphor screen, or an
accelerating anode can be used.
 Sometimes the electron gun is built to contain the
accelerating anode and focusing system within the
same unit.
Er. Basant Kumar Jha 16
Cathode-Ray Tube (CRT)
(contd.)
Er. Basant Kumar Jha 17
Figure: Operation of an electron gun with an accelerating anode
Er. Basant Kumar Jha 18
Er. Basant Kumar Jha 19
Er. Basant Kumar Jha 20
Cathode-Ray Tube (CRT)
(contd.)
Intensity of the electron beam is
controlled by setting voltage levels on
the control grid, which is a metal cylinder
that fits over the cathode.
The focusing system in a CRT is needed
to force the electron beam to converge
into a small spot as it strikes the
phosphor.
Otherwise, the electrons would repel
each other, and the beam would spread
out as it approaches the screen.
Focusing is accomplished with either
electric or magnetic fields.
Er. Basant Kumar Jha 21
Cathode-Ray Tube (CRT)
(contd.)
 As with focusing, deflection of the electron beam can be
controlled either with electric fields or with magnetic fields.
 Cathode-ray tubes are now commonly constructed with
magnetic deflection coils mounted on the outside of the CRT
envelope.
 Two pairs of coils are used, with the coils in each pair
mounted on opposite sides of the neck of the CRT envelope.
 One pair is mounted on the top and bottom of the neck, and
the other pair is mounted on opposite sides of the neck.
 One pair of plates is mounted horizontally to control the
vertical deflection, and the other pair is mounted vertically to
control horizontal deflection.
 Spots of light are produced on the screen by the transfer of
the CRT beam energy to the phosphor. When the electrons in
the beam collide with the phosphor coating, they are stopped
and their kinetic energy is absorbed by the phosphor.
Er. Basant Kumar Jha 22
Cathode-Ray Tube (CRT)
(contd.)
 Part of the beam energy is converted by friction into
heat energy, and the remainder causes electrons in the
phosphor atoms to move up to higher quantum-energy
levels.
 After a short time, the "excited phosphor electrons
begin dropping back to their stable ground state, giving
up their extra energy as small quantums of light energy.
 What we see on the screen is the combined effect of all
the electron light emissions: a glowing spot that quickly
fades after all the excited phosphor electrons have
returned to their ground energy level.
 The frequency (or color) of the light emitted by the
phosphor is proportional to the energy difference
between the excited quantum state and the ground
state.
Er. Basant Kumar Jha 23
Cathode-Ray Tube (CRT)
(contd.)
 The maximum number of points that can be
displayed without overlap on a CRT is referred to
as the resolution.
 A more precise definition of resolution is the
number of points per centimeter that can be
plotted horizontally and vertically, although it is
often simply stated as the total number of points
in each direction.
 Thus, resolution of a CRT is dependent on the
type of phosphor, the intensity to be displayed,
and the focusing and deflection systems.
 Typical resolution on high-quality systems is
1280 by 1024, with higher resolutions available
on many systems.
Er. Basant Kumar Jha 24
Cathode-Ray Tube (CRT)
(contd.)
Another property of video monitors is
aspect ratio.
This number gives the ratio of vertical
points to horizontal points necessary to
produce equal-length lines in both
directions on the screen.
 An aspect ratio of 3/4 means that a
vertical line plotted with three points has
the same length as a horizontal line
plotted with four points.
Er. Basant Kumar Jha 25
Raster-Scan Displays (contd.)
 The most common type of graphics monitor employing
a CRT is the raster-scan display.
 In a raster-scan system, the electron beam is swept
across the screen, one row at a time from top to bottom.
 As the electron beam moves across each row, the
beam intensity is turned on and off to create a pattern of
illuminated spots.
 Picture definition is stored in a memory area called the
refresh buffer or frame buffer. This memory area holds
the set of intensity values for all the screen points.
Stored intensity values are then retrieved from the
refresh buffer and "painted" on the screen one row
(scan line) at a time.
 Each screen point is referred to as a pixel or pel
(shortened forms of picture element).
 Home television sets and printers are examples of
systems using raster-scan methods.
Er. Basant Kumar Jha 26
Raster-Scan Displays (contd.)
Er. Basant Kumar Jha 27
Fig. : Raster Scan System
 In a simple black-and-white system, each screen point
is either on or off, so only one bit per pixel is needed to
control the intensity of screen positions.
 A bit value of 1 indicates that the electron beam is to be
turned on at that position, and a value of 0 indicates
that the beam intensity is to be off.
 Additional bits are needed when color and intensity
variations can be displayed. Up to 24 bits per pixel are
included in high-quality systems, which can require
several megabytes of storage for the frame buffer,
depending on the resolution of the system.
 On a black-and-white system with one bit per pixeI, the
frame buffer is commonly called a bitmap. For systems
with multiple bits per pixel, the frame buffer is often
referred to as a pixmap.
Er. Basant Kumar Jha 28
Random-Scan Displays
 When operated as a random-scan display
unit, a CRT has the electron beam directed
only to the parts of the screen where a
picture is to be drawn.
 Random-scan monitors draw a picture one
line at a time and for this reason are also
referred to as vector displays (or stroke-
writing or calligraphic displays).
 The component lines of a picture can be
drawn and refreshed by a random-scan
system in any specified order.
 A pen plotter operates in a similar way and is
an example of a random-scan, hard-copy
device.
Er. Basant Kumar Jha 29
Er. Basant Kumar Jha 30
Fig.: Random scan system
 Picture definition is now stored as a set of line drawing
commands in an area of memory referred to as the
refresh display file. Sometimes the refresh display file is
called the display list, display program, or simply the
refresh buffer.
 Random-scan displays are designed to draw all the
component lines of a picture 30 to 60 times each
second. High quality vector systems are capable of
handling approximately 100,000 "short" lines at this
refresh rate.
 Since picture definition is stored as a set of line-drawing
instructions and not as a set of intensity values for all
screen points, vector displays generally have higher
resolution than raster systems.
 Also, vector displays produce smooth line drawings
because the CRT beam directly follows the line path. A
raster system, in contrast, produces jagged lines that
are plotted as discrete point sets.
Er. Basant Kumar Jha 31
Color CRT Monitors
A CRT monitor displays color pictures by
using a combination of phosphors that
emit different-colored light.
By combining the emitted light from the
different phosphors, a range of colors
can be generated.
The two basic techniques for producing
color displays with a CRT are:
1. Beam-penetration method
2. Shadow-mask method.
Er. Basant Kumar Jha 32
Beam-Penetration Method
 The beam-penetration method for displaying
color pictures has been used with random-scan
monitors.
 Two layers of phosphor, usually red and green,
are coated onto the inside of the CRT screen,
and the displayed color depends on how far the
electron beam penetrates into the phosphor
layers.
 A beam of slow electrons excites only the outer
red layer.
 A beam of very fast electrons penetrates through
the red layer and excites the inner green layer.
 At intermediate beam speeds, combinations of
red and green light are emitted to show two
additional colors, orange and yellow.
Er. Basant Kumar Jha 33
Er. Basant Kumar Jha 34
 The speed of the electrons, and hence
the screen color at any point, is
controlled by the beam-acceleration
voltage.
 Beam penetration has been an
inexpensive way to produce color in
random-scan monitors, but only four
colors are possible, and the quality of
pictures is not as good as with other
methods.
Er. Basant Kumar Jha 35
Shadow-mask method
 Shadow-mask methods are commonly used
in raster scan systems (including color TV)
because they produce a much wider range of
colors than the beam penetration method.
 A shadow-mask CRT has three phosphor
color dots at each pixel position. One
phosphor dot emits a red light, another emits
a green light,
and the third emits a blue light.
 This type of CRT has three electron guns,
one for
each color dot, and a shadow-mask grid just
behind the phosphor-coated screen.
Er. Basant Kumar Jha 36
Er. Basant Kumar Jha 37
Fig.: Operation of a delta-delta, shadow-mask CRT.
 Figure illustrates the delta-delta shadow-
mask method, commonly used in color CRT
systems.
 The three electron beams are deflected and
focused as a group onto the shadow mask,
which contains a series of holes aligned with
the phosphor-dot patterns.
 When the three beams pass through a hole in
the shadow mask, they activate a dot
triangle, which appears as a small color spot
on the screen.
 The phosphor dots in the triangles are
arranged so that each electron beam can
activate only its corresponding color dot when
it passes through the shadow mask.
Er. Basant Kumar Jha 38
 Another configuration for the three
electron guns is an in-line arrangement
in which the three electron guns, and the
corresponding
red-green-blue color dots on the screen,
are aligned along one scan line instead
of in a triangular pattern.
 This in-line arrangement of electron guns
is easier to keep in alignment and is
commonly used in high-resolution color
CRTs. Er. Basant Kumar Jha 39
 We obtain color variations in a shadow-mask
CRT by varying the intensity levels of the
three electron beams.
 By turning off the red and green guns, we get
only the color coming from the blue phosphor.
 Other combinations of beam intensities
produce a small light spot for each pixel
position, since our eyes tend to merge the
three colors into one composite.
 The color we see depends on the amount of
excitation of the red, green, and blue
phosphors.
Er. Basant Kumar Jha 40
Flat-Panel Displays
 The term Flat-panel display refers to a class of video
devices that have reduced volume, weight, and power
requirements compared to a CRT.
 A significant feature of flat-panel displays is that they
are thinner than CRTs, and we can hang them on walls
or wear them on our wrists.
 We can even write on some flat-panel displays.
 We can separate flat-panel displays into two categories:
emissive displays and non-emissive displays.
 The emissive displays (or emitters) are devices that
convert electrical energy into light.
 Plasma panels, thin-film electroluminescent displays,
and Light-emitting diodes are examples of emissive
displays.
Er. Basant Kumar Jha 41
Non-emissive displays (or non-
emitters) use optical effects to convert
sunlight or light from some other
source into graphics patterns.
The most important example of a non-
emissive flat-panel display is a liquid-
crystal device.
Er. Basant Kumar Jha 42
Plasma Panels
 Plasma panels, also called gas-discharge displays, are
constructed by filling the region between two glass plates with
a mixture of gases that usually includes neon.
 A series of vertical conducting ribbons is placed on one glass
panel, and a set of horizontal ribbons is built into the other
glass panel.
 Firing voltages applied to a pair of horizontal and vertical
conductors cause the gas at the intersection of the two
conductors to break down into a glowing plasma of
electrons and ions.
 Picture definition is stored in a refresh buffer, and the firing
voltages are applied to refresh the pixel positions (at the
intersections of the conductors) 60 times per second.
 Alternating-current methods are used to provide faster
application of the firing voltages, and thus brighter displays.
Separation
between pixels is provided by the electric field of the
conductors.
Er. Basant Kumar Jha 43
Er. Basant Kumar Jha 44
Light-Emitting Diode (LED)
A matrix of diodes is arranged to form
the pixel positions in the display, and
picture definition is stored in a refresh
buffer.
As in scan-line refreshing of a CRT,
information is read from the refresh
buffer and converted to voltage levels
that are applied to the diodes to
produce the light patterns in the
display.
Er. Basant Kumar Jha 45
Er. Basant Kumar Jha 46
Er. Basant Kumar Jha 47
Thin-film Electroluminescent
Displays
 Thin-film electroluminescent displays are similar in
construction to a plasma panel.
 The difference is that the region between the glass
plates is filled with a phosphor, such as zinc sulfide
doped with manganese, instead of a gas.
 When a sufficiently high voltage is applied to a pair of
crossing electrodes, the phosphor becomes a
conductor in the area of the intersection of the two
electrodes.
 Electrical energy is then absorbed by the manganese
atoms,
which then release the energy as a spot of light similar
to the glowing plasma effect in a plasma panel.
 Electroluminescent displays require more power than
plasma panels, and good color and gray scale displays
are hard to achieve.
Er. Basant Kumar Jha 48
Er. Basant Kumar Jha 49
Er. Basant Kumar Jha 50
Liquid Crystal Displays (LCDs)
These non-emissive devices produce a
picture by passing polarized light from
the surroundings or from an internal light
source through a liquid-crystal material
that can be
aligned to either block or transmit the
light.
The term liquid crystal refers to the fact
that these compounds have a crystalline
arrangement of molecules, yet they flow
like a liquid. Er. Basant Kumar Jha 51
Two glass plates, each containing a light
polarizer at right angles to the-other
plate, sandwich the liquid-crystal
material.
Rows of horizontal transparent
conductors are built into one glass plate,
and columns of vertical conductors are
put into the other plate.
The intersection of two conductors
defines a pixel position.
Normally, the molecules are aligned as
shown in the "on state" of Figure.
Er. Basant Kumar Jha 52
Er. Basant Kumar Jha 53
Another method for constructing LCDs
is to place a transistor at each pixel
location, using thin-film transistor
technology.
The transistors are used to control the
voltage at pixel locations and to
prevent charge from gradually leaking
out of the liquid-crystal cells. These
devices are called active-matrix
displays.
Er. Basant Kumar Jha 54
 Polarized light passing through the material is twisted
so that it will pass through the opposite polarizer. The
light is then reflected back to the viewer.
 To turn off the pixel, we apply a voltage to the two
intersecting conductors to align the molecules so that
the light is not twisted. This type of flat-panel device is
referred to as a passive-matrix LCD.
 Picture definitions are stored in a refresh buffer, and the
screen is refreshed at the rate of 60 frames per second,
as in the emissive devices.
 Back lighting is also commonly applied using solid-state
electronic devices, so that the system is not completely
dependent on outside light.
 Colors can be displayed by using different materials or
dyes and by placing a triad of color pixels at each
screen location.
Er. Basant Kumar Jha 55
RASTER-SCAN SYSTEMS
Interactive raster graphics systems
typically employ several processing
units.
In addition to the central processing unit,
or CPU, a special-purpose processor,
called the video controller or display
controller, is used to control the
operation of the display device.
Organization of a simple raster system is
shown in Figure. Here, the frame buffer
can be anywhere in the system memory,
and the video controller accesses the
frame buffer to refresh the screen.
Er. Basant Kumar Jha 56
Er. Basant Kumar Jha 57
Video Controller
 Figure shows a commonly used organization
for raster systems.
 A fixed area of the system memory is
reserved for the frame buffer, and the video
controller is given direct access to the frame-
buffer memory.
 Frame-buffer locations, and the
corresponding screen positions, are
referenced in Cartesian coordinates.
 For many graphics monitors, the coordinate
origin is defined at the lower left screen
corner. Er. Basant Kumar Jha 58
Er. Basant Kumar Jha 59
The screen surface is then
represented as the first quadrant of a
two-dimensional system, with positive
x values increasing to the right and
positive y values increasing from
bottom to
top.
On some personal computers, the
coordinate origin is referenced at the
upper left comer of the screen, so the
y values are inverted.
Er. Basant Kumar Jha 60
Er. Basant Kumar Jha 61
Raster-Scan Display
Processor
Figure shows one way to set up the
organization of a raster system
containing a separate display
processor, sometimes referred to as a
graphics controller
or a display coprocessor.
The purpose of the display processor
is to free the CPU from the graphics
chores. In addition to the system
memory, a separate display processor
memory area can also be provided.
Er. Basant Kumar Jha 62
Er. Basant Kumar Jha 63
 A major task of the display processor is
digitizing a picture definition given in an
application program into a set of pixel-
intensity values for storage in the frame
buffer. This digitization process is called scan
conversion.
 Graphics commands specifying straight lines
and other geometric objects are scan
converted into a set of discrete intensity
points.
 Scan converting a straight-line segment, for
example, means that we have to locate the
pixel positions closest to the line path and
store the intensity for each position in the
Er. Basant Kumar Jha 64
Random-scan Systems
 The organization of a simple random-scan (vector)
system is shown in Figure.
 An application program is input and stored in the
system memory along with a graphics package.
 Graphics commands in the application program are
translated by the graphics package into a display file
stored in the system memory. This display file is then
accessed by the display processor to refresh the
screen.
 The display processor cycles through each command in
the display file program once during every refresh cycle.
 Sometimes the display processor in a random-scan
system is referred to as a display processing unit or a
graphics controller.
Er. Basant Kumar Jha 65
Er. Basant Kumar Jha 66
Graphics patterns are drawn on a
random-scan system by directing the
electron beam along the component
lines of the picture.
Lines are defined by the values for their
coordinate endpoints, and these input
coordinate values are converted to x and
y deflection voltages.
A scene is then drawn one line at a time
by
positioning the beam to fill in the line
between specified endpoints.
Er. Basant Kumar Jha 67

More Related Content

Similar to COMPUTER GRAPHICS AND ANIMATION UNIT 1.pptx

lecture2 computer graphics graphics hardware(Computer graphics tutorials)
 lecture2  computer graphics graphics hardware(Computer graphics tutorials) lecture2  computer graphics graphics hardware(Computer graphics tutorials)
lecture2 computer graphics graphics hardware(Computer graphics tutorials)
Daroko blog(www.professionalbloggertricks.com)
 
COMUTER GRAPHICS NOTES
COMUTER GRAPHICS NOTESCOMUTER GRAPHICS NOTES
COMUTER GRAPHICS NOTES
ho58
 

Similar to COMPUTER GRAPHICS AND ANIMATION UNIT 1.pptx (20)

A concept of graphics
A concept of graphicsA concept of graphics
A concept of graphics
 
Introduction to Computer Graphics
Introduction to Computer GraphicsIntroduction to Computer Graphics
Introduction to Computer Graphics
 
bhargav_flowing-fountain
bhargav_flowing-fountainbhargav_flowing-fountain
bhargav_flowing-fountain
 
lecture2 computer graphics graphics hardware(Computer graphics tutorials)
 lecture2  computer graphics graphics hardware(Computer graphics tutorials) lecture2  computer graphics graphics hardware(Computer graphics tutorials)
lecture2 computer graphics graphics hardware(Computer graphics tutorials)
 
Computergraphics2marks
Computergraphics2marksComputergraphics2marks
Computergraphics2marks
 
Basic Design and development of drones through mechatronics
Basic Design and development of drones through mechatronicsBasic Design and development of drones through mechatronics
Basic Design and development of drones through mechatronics
 
IRJET- Implementation of Arduino UNO based Two Directional [2D] Plotter
IRJET- Implementation of Arduino UNO based Two Directional [2D] PlotterIRJET- Implementation of Arduino UNO based Two Directional [2D] Plotter
IRJET- Implementation of Arduino UNO based Two Directional [2D] Plotter
 
Introduction_computer_graphics_unit-1.pptx
Introduction_computer_graphics_unit-1.pptxIntroduction_computer_graphics_unit-1.pptx
Introduction_computer_graphics_unit-1.pptx
 
Embedded systems The Past Present and the Future
Embedded systems The Past Present and the FutureEmbedded systems The Past Present and the Future
Embedded systems The Past Present and the Future
 
Computer Graphics Full Tutorial.pptx
Computer Graphics Full Tutorial.pptxComputer Graphics Full Tutorial.pptx
Computer Graphics Full Tutorial.pptx
 
Anti missile diffusion system through MATLAB with Image Processing
Anti missile diffusion system through MATLAB with Image ProcessingAnti missile diffusion system through MATLAB with Image Processing
Anti missile diffusion system through MATLAB with Image Processing
 
Computer graphics notes
Computer graphics notesComputer graphics notes
Computer graphics notes
 
Introduction to computer graphics - Copy.pdf
Introduction to computer graphics - Copy.pdfIntroduction to computer graphics - Copy.pdf
Introduction to computer graphics - Copy.pdf
 
Cg
CgCg
Cg
 
MAJOR PROJECT
MAJOR PROJECT MAJOR PROJECT
MAJOR PROJECT
 
COMUTER GRAPHICS NOTES
COMUTER GRAPHICS NOTESCOMUTER GRAPHICS NOTES
COMUTER GRAPHICS NOTES
 
Cg notes
Cg notesCg notes
Cg notes
 
CG_ch1.pptx
CG_ch1.pptxCG_ch1.pptx
CG_ch1.pptx
 
Introduction to graphics
Introduction to graphicsIntroduction to graphics
Introduction to graphics
 
color tracking robot
color tracking robotcolor tracking robot
color tracking robot
 

Recently uploaded

Recently uploaded (20)

Food safety_Challenges food safety laboratories_.pdf
Food safety_Challenges food safety laboratories_.pdfFood safety_Challenges food safety laboratories_.pdf
Food safety_Challenges food safety laboratories_.pdf
 
HMCS Max Bernays Pre-Deployment Brief (May 2024).pptx
HMCS Max Bernays Pre-Deployment Brief (May 2024).pptxHMCS Max Bernays Pre-Deployment Brief (May 2024).pptx
HMCS Max Bernays Pre-Deployment Brief (May 2024).pptx
 
On National Teacher Day, meet the 2024-25 Kenan Fellows
On National Teacher Day, meet the 2024-25 Kenan FellowsOn National Teacher Day, meet the 2024-25 Kenan Fellows
On National Teacher Day, meet the 2024-25 Kenan Fellows
 
80 ĐỀ THI THỬ TUYỂN SINH TIẾNG ANH VÀO 10 SỞ GD – ĐT THÀNH PHỐ HỒ CHÍ MINH NĂ...
80 ĐỀ THI THỬ TUYỂN SINH TIẾNG ANH VÀO 10 SỞ GD – ĐT THÀNH PHỐ HỒ CHÍ MINH NĂ...80 ĐỀ THI THỬ TUYỂN SINH TIẾNG ANH VÀO 10 SỞ GD – ĐT THÀNH PHỐ HỒ CHÍ MINH NĂ...
80 ĐỀ THI THỬ TUYỂN SINH TIẾNG ANH VÀO 10 SỞ GD – ĐT THÀNH PHỐ HỒ CHÍ MINH NĂ...
 
General Principles of Intellectual Property: Concepts of Intellectual Proper...
General Principles of Intellectual Property: Concepts of Intellectual  Proper...General Principles of Intellectual Property: Concepts of Intellectual  Proper...
General Principles of Intellectual Property: Concepts of Intellectual Proper...
 
TỔNG ÔN TẬP THI VÀO LỚP 10 MÔN TIẾNG ANH NĂM HỌC 2023 - 2024 CÓ ĐÁP ÁN (NGỮ Â...
TỔNG ÔN TẬP THI VÀO LỚP 10 MÔN TIẾNG ANH NĂM HỌC 2023 - 2024 CÓ ĐÁP ÁN (NGỮ Â...TỔNG ÔN TẬP THI VÀO LỚP 10 MÔN TIẾNG ANH NĂM HỌC 2023 - 2024 CÓ ĐÁP ÁN (NGỮ Â...
TỔNG ÔN TẬP THI VÀO LỚP 10 MÔN TIẾNG ANH NĂM HỌC 2023 - 2024 CÓ ĐÁP ÁN (NGỮ Â...
 
Simple, Complex, and Compound Sentences Exercises.pdf
Simple, Complex, and Compound Sentences Exercises.pdfSimple, Complex, and Compound Sentences Exercises.pdf
Simple, Complex, and Compound Sentences Exercises.pdf
 
SOC 101 Demonstration of Learning Presentation
SOC 101 Demonstration of Learning PresentationSOC 101 Demonstration of Learning Presentation
SOC 101 Demonstration of Learning Presentation
 
On_Translating_a_Tamil_Poem_by_A_K_Ramanujan.pptx
On_Translating_a_Tamil_Poem_by_A_K_Ramanujan.pptxOn_Translating_a_Tamil_Poem_by_A_K_Ramanujan.pptx
On_Translating_a_Tamil_Poem_by_A_K_Ramanujan.pptx
 
dusjagr & nano talk on open tools for agriculture research and learning
dusjagr & nano talk on open tools for agriculture research and learningdusjagr & nano talk on open tools for agriculture research and learning
dusjagr & nano talk on open tools for agriculture research and learning
 
latest AZ-104 Exam Questions and Answers
latest AZ-104 Exam Questions and Answerslatest AZ-104 Exam Questions and Answers
latest AZ-104 Exam Questions and Answers
 
OSCM Unit 2_Operations Processes & Systems
OSCM Unit 2_Operations Processes & SystemsOSCM Unit 2_Operations Processes & Systems
OSCM Unit 2_Operations Processes & Systems
 
Python Notes for mca i year students osmania university.docx
Python Notes for mca i year students osmania university.docxPython Notes for mca i year students osmania university.docx
Python Notes for mca i year students osmania university.docx
 
HMCS Vancouver Pre-Deployment Brief - May 2024 (Web Version).pptx
HMCS Vancouver Pre-Deployment Brief - May 2024 (Web Version).pptxHMCS Vancouver Pre-Deployment Brief - May 2024 (Web Version).pptx
HMCS Vancouver Pre-Deployment Brief - May 2024 (Web Version).pptx
 
COMMUNICATING NEGATIVE NEWS - APPROACHES .pptx
COMMUNICATING NEGATIVE NEWS - APPROACHES .pptxCOMMUNICATING NEGATIVE NEWS - APPROACHES .pptx
COMMUNICATING NEGATIVE NEWS - APPROACHES .pptx
 
Graduate Outcomes Presentation Slides - English
Graduate Outcomes Presentation Slides - EnglishGraduate Outcomes Presentation Slides - English
Graduate Outcomes Presentation Slides - English
 
Exploring_the_Narrative_Style_of_Amitav_Ghoshs_Gun_Island.pptx
Exploring_the_Narrative_Style_of_Amitav_Ghoshs_Gun_Island.pptxExploring_the_Narrative_Style_of_Amitav_Ghoshs_Gun_Island.pptx
Exploring_the_Narrative_Style_of_Amitav_Ghoshs_Gun_Island.pptx
 
Wellbeing inclusion and digital dystopias.pptx
Wellbeing inclusion and digital dystopias.pptxWellbeing inclusion and digital dystopias.pptx
Wellbeing inclusion and digital dystopias.pptx
 
Accessible Digital Futures project (20/03/2024)
Accessible Digital Futures project (20/03/2024)Accessible Digital Futures project (20/03/2024)
Accessible Digital Futures project (20/03/2024)
 
Google Gemini An AI Revolution in Education.pptx
Google Gemini An AI Revolution in Education.pptxGoogle Gemini An AI Revolution in Education.pptx
Google Gemini An AI Revolution in Education.pptx
 

COMPUTER GRAPHICS AND ANIMATION UNIT 1.pptx

  • 1. COMPUTER GRAPHICS AND ANIMATION Er. Basant Kumar Jha Er. Basant Kumar Jha 1
  • 3.  Computer graphics is an art of drawing pictures on computer screens with the help of programming.  It involves computations, creation, and manipulation of data.  In other words, we can say that computer graphics is a rendering tool for the generation and manipulation of images.  Today, computer graphics is a core technology in digital photography, film, video games, cell phone and computer displays, and many specialized applications.  A great deal of specialized hardware and software has been developed, with the displays of most devices being driven by computer graphics hardware. Er. Basant Kumar Jha 3
  • 4. Advantages of Computer Graphics  It provides tools for producing pictures not only of concrete real world objects but also of abstract, synthetic objects such as mathematical surface in 4D and of data that have no inherent geometry such as survey results.  It has the ability to show moving pictures and thus it is possible to produce animations with computer graphics.  With computer graphics user can also control the animation speed, portion of the view and the amount of details shown.  The computer graphics provides tool called Motion dynamics. With this tool user can move and tumble objects with respect to a stationary observer, or he can make objects stationary and the viewer moving around them. A typical example is walk through made by builder to show flat interior and building surroundings. In many case it is also possible to move both objects and viewer. Er. Basant Kumar Jha 4
  • 5. Advantages of Computer Graphics (contd.) The computer graphics also provides facility called update dynamics. With update dynamics, it is possible to change the shape, color or other properties of the objects being viewed. With the recent development of digital signal processing (DSP) and audio synthesis chip the interactive graphics can now provide audio feedback along with the graphical feedbacks to make the simulated environment even more realistic. Er. Basant Kumar Jha 5
  • 6. Areas of Applications 1. Education and Training: Computer- generated model of the physical, financial and economic system is often used as educational aids. Model of physical systems, physiological system, population trends or equipment can help trainees to understand the operation of the system. For some training applications, particular systems are designed. For example: Flight Simulator.  Flight Simulator: It helps in giving training to the pilots of airplanes. These pilots spend much of their training not in a real aircraft but on the ground at the controls of a Flight Simulator. Er. Basant Kumar Jha 6
  • 7. Areas of Applications (contd.) 2. Use in Biology: Molecular biologist can display a picture of molecules and gain insight into their structure with the help of computer graphics. 3. Computer-Generated Maps: Town planners and transportation engineers can use computer-generated maps which display data useful to them in their planning work. 4. Architect: Architect can explore an alternative solution to design problems at an interactive graphics terminal. In this way, they can test many more solutions that would not be possible without the computer. Er. Basant Kumar Jha 7
  • 8. Areas of Applications (contd.) 5. Presentation Graphics: Example of presentation Graphics are bar charts, line graphs, pie charts and other displays showing relationships between multiple parameters. Presentation Graphics is commonly used to summarize  Financial Reports  Statistical Reports  Mathematical Reports  Scientific Reports  Economic Data for research reports  Managerial Reports  Consumer Information Bulletins  And other types of reports Er. Basant Kumar Jha 8
  • 9. Areas of Applications (contd.) 6. Computer Art: Computer Graphics are also used in the field of commercial arts. It is used to generate television and advertising commercial. 7. Entertainment: Computer Graphics are now commonly used in making motion pictures, music videos and television shows. 8. Visualization: It is used for visualization of scientists, engineers, medical personnel, business analysts for the study of a large amount of information. 9. Educational Software: Computer Graphics is used in the development of educational software for making computer-aided instruction. 10. Printing Technology: Computer Graphics is used for printing technology and textile design. Er. Basant Kumar Jha 9
  • 10. 11. Graphical User Interfaces: It is common now for software packages to provide a graphical interface. A major component of a graphical interface is a window manager that allows a user to display multiple-window areas. Each window can contain a different process that can contain graphical or nongraphical displays. To make a particular window active, we simply click in that window using an interactive pointing device. Interfaces also display menus and icons for fast selection of processing options or parameter values. An icon is a graphical symbol that is designed to look like the processing option it represents. The advantages of icons are that they take up less screen space than corresponding textual descriptions and they can be understood more quickly if well designed. Menus contain lists of textual descriptions and icons. Er. Basant Kumar Jha 10
  • 11. HARDWARE AND SOFTWARE FOR COMPUTER GRAPHICS Er. Basant Kumar Jha 11
  • 12.  Due to the widespread recognition of the power and utility of computer graphics in virtually all fields, a broad range of graphics hardware and software systems is now available.  Graphics capabilities for both two-dimensional and three-dimensional applications are now common on general-purpose computers, including many hand-held calculators.  With personal computers, we can use a wide variety of interactive input devices and graphics software packages.  For higher quality applications, we can choose from a number of sophisticated special-purpose graphics hardware systems and technologies. Er. Basant Kumar Jha 12
  • 13. Video Display Devices Typically, the primary output device in a graphics system is a video monitor. The operation of most video monitors is based on the standard cathode-ray tube (CRT) design, but several other technologies exist Er. Basant Kumar Jha 13
  • 14. Cathode-Ray Tube (CRT)  Figure below illustrates the basic operation of a CRT.  A beam of electrons (cathode rays), emitted by an electron gun, passes through focusing and deflection systems that direct the beam toward specified positions on the phosphor-coated screen.  The phosphor then emits a small spot of light at each position contacted by the electron beam.  Because the light emitted by the phosphor fades very rapidly, some method is needed for maintaining the screen picture.  One way to keep the phosphor glowing is to redraw the picture repeatedly by quickly directing the electron beam back over the same points. This type of display is called a refresh CRT. Er. Basant Kumar Jha 14
  • 15. Cathode-Ray Tube (CRT) (contd.) Er. Basant Kumar Jha 15
  • 16. Cathode-Ray Tube (CRT) (contd.)  The primary components of an electron gun in a CRT are the heated metal cathode and a control grid.  Heat is supplied to the cathode by directing a current through a coil of wire, called the filament, inside the cylindrical cathode structure.  This causes electrons to be ‘boiled off" the hot cathode surface.  In the vacuum inside the CRT envelope, the free, negatively charged electrons are then accelerated toward the phosphor coating by a high positive voltage.  The accelerating voltage can be generated with a positively charged metal coating on the inside of the CRT envelope near the phosphor screen, or an accelerating anode can be used.  Sometimes the electron gun is built to contain the accelerating anode and focusing system within the same unit. Er. Basant Kumar Jha 16
  • 17. Cathode-Ray Tube (CRT) (contd.) Er. Basant Kumar Jha 17 Figure: Operation of an electron gun with an accelerating anode
  • 21. Cathode-Ray Tube (CRT) (contd.) Intensity of the electron beam is controlled by setting voltage levels on the control grid, which is a metal cylinder that fits over the cathode. The focusing system in a CRT is needed to force the electron beam to converge into a small spot as it strikes the phosphor. Otherwise, the electrons would repel each other, and the beam would spread out as it approaches the screen. Focusing is accomplished with either electric or magnetic fields. Er. Basant Kumar Jha 21
  • 22. Cathode-Ray Tube (CRT) (contd.)  As with focusing, deflection of the electron beam can be controlled either with electric fields or with magnetic fields.  Cathode-ray tubes are now commonly constructed with magnetic deflection coils mounted on the outside of the CRT envelope.  Two pairs of coils are used, with the coils in each pair mounted on opposite sides of the neck of the CRT envelope.  One pair is mounted on the top and bottom of the neck, and the other pair is mounted on opposite sides of the neck.  One pair of plates is mounted horizontally to control the vertical deflection, and the other pair is mounted vertically to control horizontal deflection.  Spots of light are produced on the screen by the transfer of the CRT beam energy to the phosphor. When the electrons in the beam collide with the phosphor coating, they are stopped and their kinetic energy is absorbed by the phosphor. Er. Basant Kumar Jha 22
  • 23. Cathode-Ray Tube (CRT) (contd.)  Part of the beam energy is converted by friction into heat energy, and the remainder causes electrons in the phosphor atoms to move up to higher quantum-energy levels.  After a short time, the "excited phosphor electrons begin dropping back to their stable ground state, giving up their extra energy as small quantums of light energy.  What we see on the screen is the combined effect of all the electron light emissions: a glowing spot that quickly fades after all the excited phosphor electrons have returned to their ground energy level.  The frequency (or color) of the light emitted by the phosphor is proportional to the energy difference between the excited quantum state and the ground state. Er. Basant Kumar Jha 23
  • 24. Cathode-Ray Tube (CRT) (contd.)  The maximum number of points that can be displayed without overlap on a CRT is referred to as the resolution.  A more precise definition of resolution is the number of points per centimeter that can be plotted horizontally and vertically, although it is often simply stated as the total number of points in each direction.  Thus, resolution of a CRT is dependent on the type of phosphor, the intensity to be displayed, and the focusing and deflection systems.  Typical resolution on high-quality systems is 1280 by 1024, with higher resolutions available on many systems. Er. Basant Kumar Jha 24
  • 25. Cathode-Ray Tube (CRT) (contd.) Another property of video monitors is aspect ratio. This number gives the ratio of vertical points to horizontal points necessary to produce equal-length lines in both directions on the screen.  An aspect ratio of 3/4 means that a vertical line plotted with three points has the same length as a horizontal line plotted with four points. Er. Basant Kumar Jha 25
  • 26. Raster-Scan Displays (contd.)  The most common type of graphics monitor employing a CRT is the raster-scan display.  In a raster-scan system, the electron beam is swept across the screen, one row at a time from top to bottom.  As the electron beam moves across each row, the beam intensity is turned on and off to create a pattern of illuminated spots.  Picture definition is stored in a memory area called the refresh buffer or frame buffer. This memory area holds the set of intensity values for all the screen points. Stored intensity values are then retrieved from the refresh buffer and "painted" on the screen one row (scan line) at a time.  Each screen point is referred to as a pixel or pel (shortened forms of picture element).  Home television sets and printers are examples of systems using raster-scan methods. Er. Basant Kumar Jha 26
  • 27. Raster-Scan Displays (contd.) Er. Basant Kumar Jha 27 Fig. : Raster Scan System
  • 28.  In a simple black-and-white system, each screen point is either on or off, so only one bit per pixel is needed to control the intensity of screen positions.  A bit value of 1 indicates that the electron beam is to be turned on at that position, and a value of 0 indicates that the beam intensity is to be off.  Additional bits are needed when color and intensity variations can be displayed. Up to 24 bits per pixel are included in high-quality systems, which can require several megabytes of storage for the frame buffer, depending on the resolution of the system.  On a black-and-white system with one bit per pixeI, the frame buffer is commonly called a bitmap. For systems with multiple bits per pixel, the frame buffer is often referred to as a pixmap. Er. Basant Kumar Jha 28
  • 29. Random-Scan Displays  When operated as a random-scan display unit, a CRT has the electron beam directed only to the parts of the screen where a picture is to be drawn.  Random-scan monitors draw a picture one line at a time and for this reason are also referred to as vector displays (or stroke- writing or calligraphic displays).  The component lines of a picture can be drawn and refreshed by a random-scan system in any specified order.  A pen plotter operates in a similar way and is an example of a random-scan, hard-copy device. Er. Basant Kumar Jha 29
  • 30. Er. Basant Kumar Jha 30 Fig.: Random scan system
  • 31.  Picture definition is now stored as a set of line drawing commands in an area of memory referred to as the refresh display file. Sometimes the refresh display file is called the display list, display program, or simply the refresh buffer.  Random-scan displays are designed to draw all the component lines of a picture 30 to 60 times each second. High quality vector systems are capable of handling approximately 100,000 "short" lines at this refresh rate.  Since picture definition is stored as a set of line-drawing instructions and not as a set of intensity values for all screen points, vector displays generally have higher resolution than raster systems.  Also, vector displays produce smooth line drawings because the CRT beam directly follows the line path. A raster system, in contrast, produces jagged lines that are plotted as discrete point sets. Er. Basant Kumar Jha 31
  • 32. Color CRT Monitors A CRT monitor displays color pictures by using a combination of phosphors that emit different-colored light. By combining the emitted light from the different phosphors, a range of colors can be generated. The two basic techniques for producing color displays with a CRT are: 1. Beam-penetration method 2. Shadow-mask method. Er. Basant Kumar Jha 32
  • 33. Beam-Penetration Method  The beam-penetration method for displaying color pictures has been used with random-scan monitors.  Two layers of phosphor, usually red and green, are coated onto the inside of the CRT screen, and the displayed color depends on how far the electron beam penetrates into the phosphor layers.  A beam of slow electrons excites only the outer red layer.  A beam of very fast electrons penetrates through the red layer and excites the inner green layer.  At intermediate beam speeds, combinations of red and green light are emitted to show two additional colors, orange and yellow. Er. Basant Kumar Jha 33
  • 35.  The speed of the electrons, and hence the screen color at any point, is controlled by the beam-acceleration voltage.  Beam penetration has been an inexpensive way to produce color in random-scan monitors, but only four colors are possible, and the quality of pictures is not as good as with other methods. Er. Basant Kumar Jha 35
  • 36. Shadow-mask method  Shadow-mask methods are commonly used in raster scan systems (including color TV) because they produce a much wider range of colors than the beam penetration method.  A shadow-mask CRT has three phosphor color dots at each pixel position. One phosphor dot emits a red light, another emits a green light, and the third emits a blue light.  This type of CRT has three electron guns, one for each color dot, and a shadow-mask grid just behind the phosphor-coated screen. Er. Basant Kumar Jha 36
  • 37. Er. Basant Kumar Jha 37 Fig.: Operation of a delta-delta, shadow-mask CRT.
  • 38.  Figure illustrates the delta-delta shadow- mask method, commonly used in color CRT systems.  The three electron beams are deflected and focused as a group onto the shadow mask, which contains a series of holes aligned with the phosphor-dot patterns.  When the three beams pass through a hole in the shadow mask, they activate a dot triangle, which appears as a small color spot on the screen.  The phosphor dots in the triangles are arranged so that each electron beam can activate only its corresponding color dot when it passes through the shadow mask. Er. Basant Kumar Jha 38
  • 39.  Another configuration for the three electron guns is an in-line arrangement in which the three electron guns, and the corresponding red-green-blue color dots on the screen, are aligned along one scan line instead of in a triangular pattern.  This in-line arrangement of electron guns is easier to keep in alignment and is commonly used in high-resolution color CRTs. Er. Basant Kumar Jha 39
  • 40.  We obtain color variations in a shadow-mask CRT by varying the intensity levels of the three electron beams.  By turning off the red and green guns, we get only the color coming from the blue phosphor.  Other combinations of beam intensities produce a small light spot for each pixel position, since our eyes tend to merge the three colors into one composite.  The color we see depends on the amount of excitation of the red, green, and blue phosphors. Er. Basant Kumar Jha 40
  • 41. Flat-Panel Displays  The term Flat-panel display refers to a class of video devices that have reduced volume, weight, and power requirements compared to a CRT.  A significant feature of flat-panel displays is that they are thinner than CRTs, and we can hang them on walls or wear them on our wrists.  We can even write on some flat-panel displays.  We can separate flat-panel displays into two categories: emissive displays and non-emissive displays.  The emissive displays (or emitters) are devices that convert electrical energy into light.  Plasma panels, thin-film electroluminescent displays, and Light-emitting diodes are examples of emissive displays. Er. Basant Kumar Jha 41
  • 42. Non-emissive displays (or non- emitters) use optical effects to convert sunlight or light from some other source into graphics patterns. The most important example of a non- emissive flat-panel display is a liquid- crystal device. Er. Basant Kumar Jha 42
  • 43. Plasma Panels  Plasma panels, also called gas-discharge displays, are constructed by filling the region between two glass plates with a mixture of gases that usually includes neon.  A series of vertical conducting ribbons is placed on one glass panel, and a set of horizontal ribbons is built into the other glass panel.  Firing voltages applied to a pair of horizontal and vertical conductors cause the gas at the intersection of the two conductors to break down into a glowing plasma of electrons and ions.  Picture definition is stored in a refresh buffer, and the firing voltages are applied to refresh the pixel positions (at the intersections of the conductors) 60 times per second.  Alternating-current methods are used to provide faster application of the firing voltages, and thus brighter displays. Separation between pixels is provided by the electric field of the conductors. Er. Basant Kumar Jha 43
  • 45. Light-Emitting Diode (LED) A matrix of diodes is arranged to form the pixel positions in the display, and picture definition is stored in a refresh buffer. As in scan-line refreshing of a CRT, information is read from the refresh buffer and converted to voltage levels that are applied to the diodes to produce the light patterns in the display. Er. Basant Kumar Jha 45
  • 48. Thin-film Electroluminescent Displays  Thin-film electroluminescent displays are similar in construction to a plasma panel.  The difference is that the region between the glass plates is filled with a phosphor, such as zinc sulfide doped with manganese, instead of a gas.  When a sufficiently high voltage is applied to a pair of crossing electrodes, the phosphor becomes a conductor in the area of the intersection of the two electrodes.  Electrical energy is then absorbed by the manganese atoms, which then release the energy as a spot of light similar to the glowing plasma effect in a plasma panel.  Electroluminescent displays require more power than plasma panels, and good color and gray scale displays are hard to achieve. Er. Basant Kumar Jha 48
  • 51. Liquid Crystal Displays (LCDs) These non-emissive devices produce a picture by passing polarized light from the surroundings or from an internal light source through a liquid-crystal material that can be aligned to either block or transmit the light. The term liquid crystal refers to the fact that these compounds have a crystalline arrangement of molecules, yet they flow like a liquid. Er. Basant Kumar Jha 51
  • 52. Two glass plates, each containing a light polarizer at right angles to the-other plate, sandwich the liquid-crystal material. Rows of horizontal transparent conductors are built into one glass plate, and columns of vertical conductors are put into the other plate. The intersection of two conductors defines a pixel position. Normally, the molecules are aligned as shown in the "on state" of Figure. Er. Basant Kumar Jha 52
  • 54. Another method for constructing LCDs is to place a transistor at each pixel location, using thin-film transistor technology. The transistors are used to control the voltage at pixel locations and to prevent charge from gradually leaking out of the liquid-crystal cells. These devices are called active-matrix displays. Er. Basant Kumar Jha 54
  • 55.  Polarized light passing through the material is twisted so that it will pass through the opposite polarizer. The light is then reflected back to the viewer.  To turn off the pixel, we apply a voltage to the two intersecting conductors to align the molecules so that the light is not twisted. This type of flat-panel device is referred to as a passive-matrix LCD.  Picture definitions are stored in a refresh buffer, and the screen is refreshed at the rate of 60 frames per second, as in the emissive devices.  Back lighting is also commonly applied using solid-state electronic devices, so that the system is not completely dependent on outside light.  Colors can be displayed by using different materials or dyes and by placing a triad of color pixels at each screen location. Er. Basant Kumar Jha 55
  • 56. RASTER-SCAN SYSTEMS Interactive raster graphics systems typically employ several processing units. In addition to the central processing unit, or CPU, a special-purpose processor, called the video controller or display controller, is used to control the operation of the display device. Organization of a simple raster system is shown in Figure. Here, the frame buffer can be anywhere in the system memory, and the video controller accesses the frame buffer to refresh the screen. Er. Basant Kumar Jha 56
  • 58. Video Controller  Figure shows a commonly used organization for raster systems.  A fixed area of the system memory is reserved for the frame buffer, and the video controller is given direct access to the frame- buffer memory.  Frame-buffer locations, and the corresponding screen positions, are referenced in Cartesian coordinates.  For many graphics monitors, the coordinate origin is defined at the lower left screen corner. Er. Basant Kumar Jha 58
  • 60. The screen surface is then represented as the first quadrant of a two-dimensional system, with positive x values increasing to the right and positive y values increasing from bottom to top. On some personal computers, the coordinate origin is referenced at the upper left comer of the screen, so the y values are inverted. Er. Basant Kumar Jha 60
  • 62. Raster-Scan Display Processor Figure shows one way to set up the organization of a raster system containing a separate display processor, sometimes referred to as a graphics controller or a display coprocessor. The purpose of the display processor is to free the CPU from the graphics chores. In addition to the system memory, a separate display processor memory area can also be provided. Er. Basant Kumar Jha 62
  • 64.  A major task of the display processor is digitizing a picture definition given in an application program into a set of pixel- intensity values for storage in the frame buffer. This digitization process is called scan conversion.  Graphics commands specifying straight lines and other geometric objects are scan converted into a set of discrete intensity points.  Scan converting a straight-line segment, for example, means that we have to locate the pixel positions closest to the line path and store the intensity for each position in the Er. Basant Kumar Jha 64
  • 65. Random-scan Systems  The organization of a simple random-scan (vector) system is shown in Figure.  An application program is input and stored in the system memory along with a graphics package.  Graphics commands in the application program are translated by the graphics package into a display file stored in the system memory. This display file is then accessed by the display processor to refresh the screen.  The display processor cycles through each command in the display file program once during every refresh cycle.  Sometimes the display processor in a random-scan system is referred to as a display processing unit or a graphics controller. Er. Basant Kumar Jha 65
  • 67. Graphics patterns are drawn on a random-scan system by directing the electron beam along the component lines of the picture. Lines are defined by the values for their coordinate endpoints, and these input coordinate values are converted to x and y deflection voltages. A scene is then drawn one line at a time by positioning the beam to fill in the line between specified endpoints. Er. Basant Kumar Jha 67