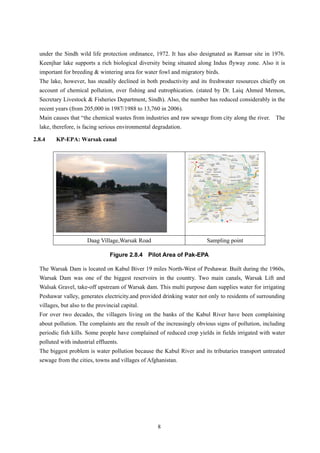
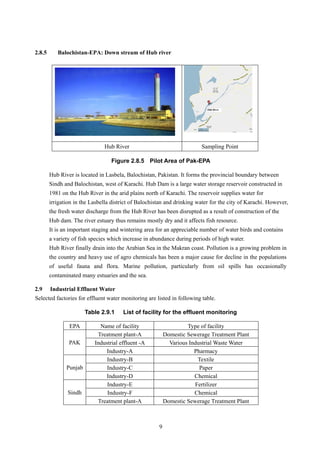
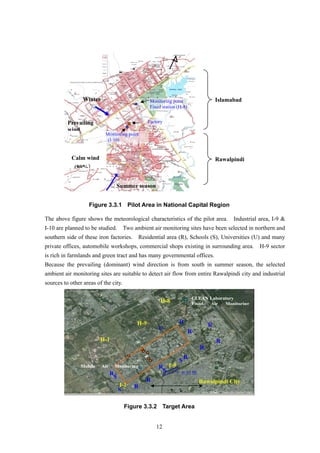
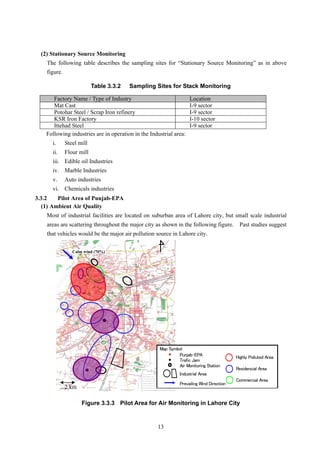
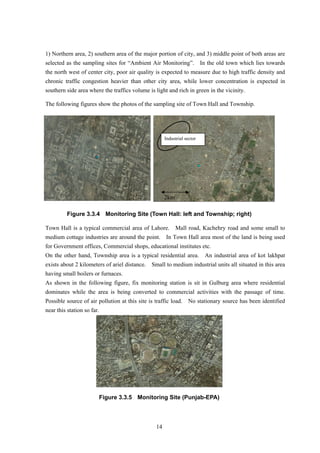
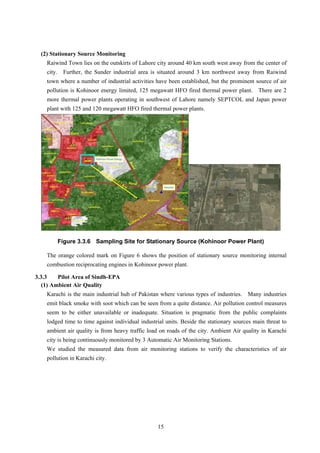
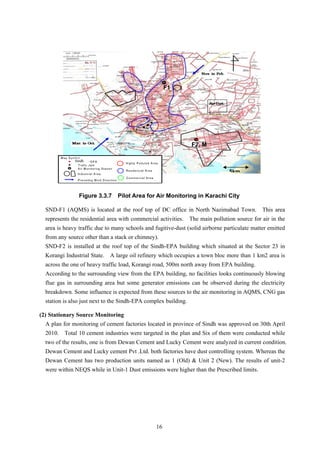
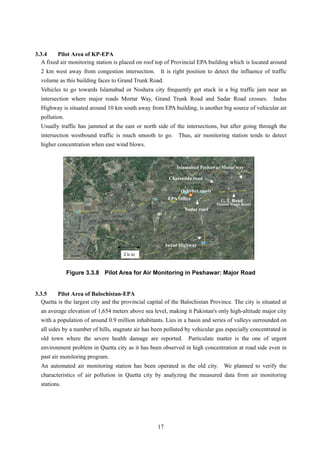
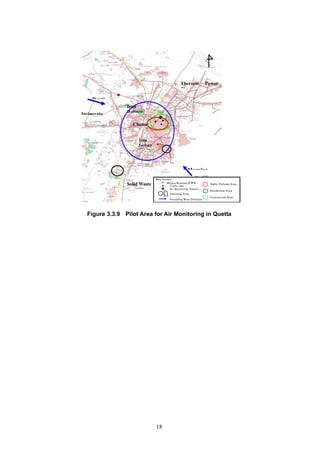
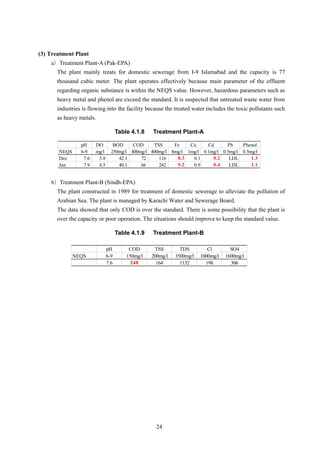
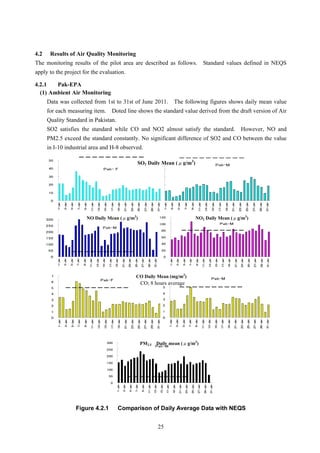
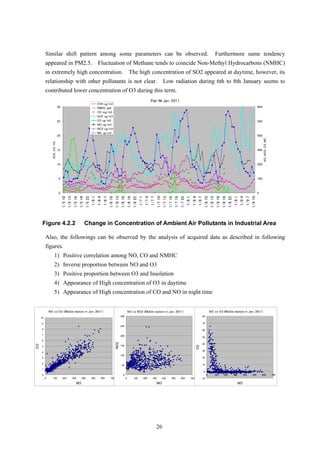
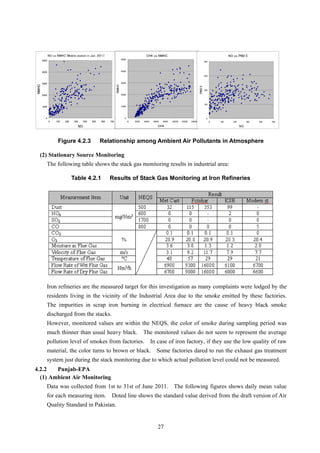
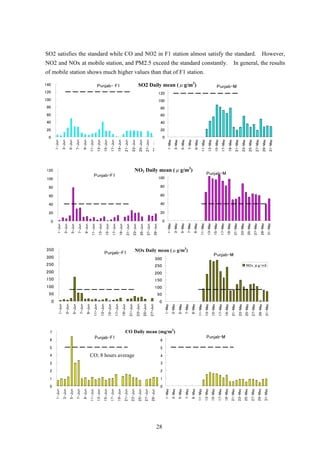
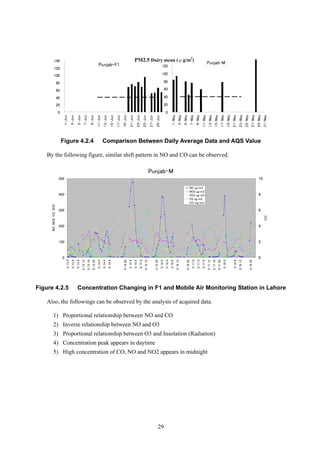
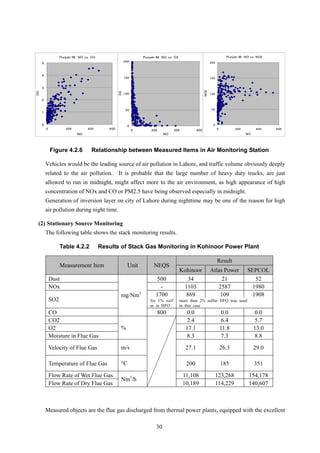
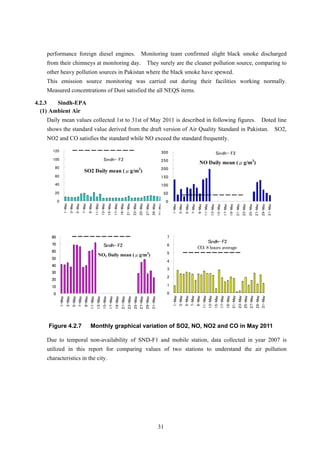
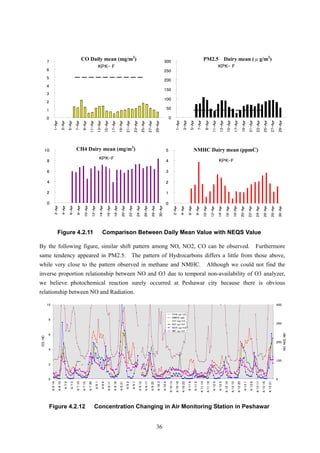
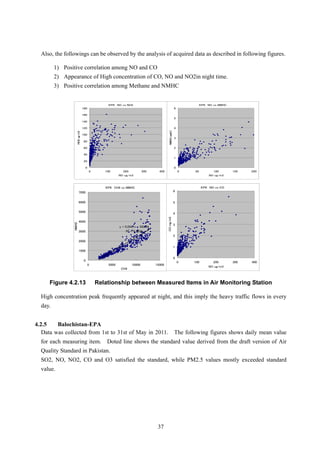
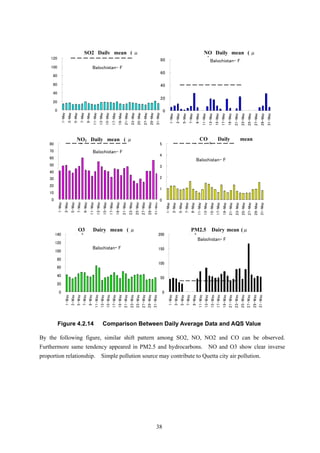
The document is a comprehensive environmental monitoring report detailing the findings from water and air quality assessments in selected pilot areas of Pakistan, conducted by various environmental protection agencies. It outlines key issues concerning water use, pollution, and the overarching goal of reinforcing the country's environmental monitoring capabilities through international cooperation. The report highlights the urgent need for effective management practices to address deteriorating environmental conditions, particularly regarding water scarcity and air pollution.


![CHAPTER 2 WATER IN PAKISTAN AND THE PILOT AREAS
2.1 Water Use
In Pakistan, water is mainly used for industrial, agricultural and domestic purposes. The following shows
its percentage consumption for every use.
Table 2.1.1 Water Consumption
Purpose Percentage (%)
Agriculture 69
Industry 23
Domestic uses 8
2.2 Agriculture
Pakistan has the largest contiguous irrigation system in the world. Irrigated land provides about 80 % of
agricultural output, contributes 25 % of GDP, employs over 50 % of the rural labor force, and provides 60
– 70 % of exports.
The water shortage in the agriculture sector is another serious issue. As per SOE 2005, the shortage has
been estimated at 29% for the year 2010 and 33% for 2025. In addition, uncontrolled harvesting of
groundwater for irrigation purposes has also led to severe environmental problems.
Irrigation water does not satisfy the quality standard which leads to contamination of vegetables
cultivated in certain regions further increasing the risk of human health.(SOE 2005)
It is estimated that 40 million residents depend on irrigation water for their domestic use, especially in
areas where the groundwater is brackish. The associated health risks are grave, as bacteriological
contamination of irrigation water often exceeds FAO limits even for irrigation.
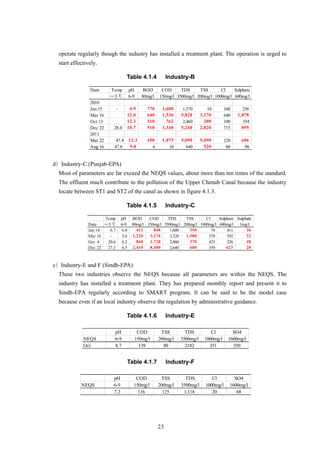
2.3 Industry
Industrial wastewater contains toxic chemicals. It is alarming that most industries have been started
without proper planning and waste treatment plants. They just dispose of untreated toxic waste into
nearby drains, canals or rivers. Lahore, Faisalabad, Karachi, Sialkot contribute major pollution loads into
their water bodies.
According to an EPD source, 9000 million gallons of wastewater having 20,000 tons of BOD5 loading
are daily discharged into water bodies from the industrial sector. [Proceedings of International
Symposium by CEWR in 1993, Paper by M.A. Saleemi].
2.4 Drinking Water
Only 80 percent of the urban and 45 percent of the rural population is estimated to have access to clean
water in Pakistan, and migration to the city is putting pressure on inadequate urban water and sanitation
facility. Pollution has led to the spread of water-related infections: more than 40 percent of the hospital
beds in Pakistan are occupied by patients with water-related diseases.
3](https://image.slidesharecdn.com/tcp-ems2011-151022123023-lva1-app6891/85/Comprehensive-Environmental-Monitoring-Report-7-320.jpg)