
Recommended
More Related Content
What's hot
What's hot (15)
Similar to Comparison market implied volatilities with implied volatilities computed by newton
Similar to Comparison market implied volatilities with implied volatilities computed by newton (20)
Recently uploaded
Recently uploaded (20)
Comparison market implied volatilities with implied volatilities computed by newton
- 1. Comparison market implied volatilities with implied volatilities computed by Newton’s analytical method. This code is implemented by VBA to compare those difference between a real implied and a calculated so that to find whether there is an arbitrage opportunity. Market focus on Forex GBP/USD market, by price model will apply black-choles formula to calculate the option price which is below: 𝑐 = 𝑆0 𝑒−𝑟 𝑓 𝑇 𝑁(𝑑1) − 𝐾𝑒−𝑟 𝑑 𝑇 𝑁(𝑑2) Where: 𝑑1 = ln( 𝑆0 𝐾 )+(𝑟 𝑑+𝑟 𝑓− 𝜎2 2 )𝑇 𝜎√𝑇 𝑑2 = 𝑑1 − 𝜎√𝑇 𝑆0 𝑖𝑠 𝑡ℎ𝑒 𝑐𝑢𝑟𝑟𝑒𝑛𝑡 𝑠𝑝𝑜𝑡 𝑟𝑎𝑡𝑒 𝐾 is the strike price N(x) is the cumulative normal distribution function 𝑟𝑑 is domestic risk free simple interest rate 𝑟𝑓 is foreign risk free simple interest rate T is the time to maturity (calculated according to the appropriate day count convention) 𝜎 𝑖𝑠 𝑡ℎ𝑒 𝑖𝑚𝑝𝑙𝑖𝑒𝑑 𝑣𝑜𝑙𝑎𝑡𝑖𝑙𝑖𝑡𝑦 𝑜𝑓 𝑡ℎ𝑒 𝐹𝑋 𝑟𝑎𝑡𝑒 Code below is to compute the implied volatilities by inputting the option price, time to maturity, spot FX rate, risk free rate in British and US (assumed), strike FX rate ====================================================================== Sub forex() Worksheets("GBPUSD").Select Dim S As Integer S = Sheets("GBPUSD").Cells(Rows.Count, "A").End(xlUp).Row Dim rate As Range Set rate = Range(Range("C2"), Range("C" & S)) 'MsgBox s Range("B" & S + 3).value = "mean" Range("B" & S + 4).value = "std" Range("c" & S + 3) = WorksheetFunction.Average(rate) Range("c" & S + 4) = WorksheetFunction.StDev_S(rate) Dim histstd() As Double
- 2. ReDim histstd(S - 3) As Double Range("D1").value = "Date" Range("E1").value = "HISTORIC STD" Range("f1").value = "Historic volatility" For i = 0 To S - 3 histstd(i) = WorksheetFunction.StDev_P(Range(Range("c" & S - 1 - i), Range("c" & S))) Next i MsgBox i j = 1 For Each element In histstd j = j + 1 'MsgBox " 12" & element Range("D" & j).value = Range("a" & 265 - j).value Range("E" & j).value = element Range("f" & j).value = Range("e" & j).value * Sqr(360) Next End Sub ====================================================================== Function optionprice(ByVal spot As Double, strike As Double, maturity As Double, ByVal rf1 As Double, ByVal rf2 As Double, vol As Double) As Double Dim a, b As Double a = WorksheetFunction.Ln(spot / strike) + (rf1 - rf2 + vol * vol * 0.5) * maturity b = a - vol * Sqr(maturity) optionprice = spot * Exp(-rf2 * maturity) * WorksheetFunction.NormSDist(Arg1:=a) - strike * Exp(-rf1 * maturity) * WorksheetFunction.NormSDist(Arg1:=b) End Function ====================================================================== Function ImpliedVolatility(ByVal spot As Double, strike As Double, maturity As Double, ByVal rf1 As Double, ByVal rf2 As Double, ByVal OptionValue As Double) Dim epsilon As Double, dVol As Double, vol_1 As Double Dim i As Integer, maxIter As Integer, Value_1 As Double, vol_2 As Double Dim Value_2 As Double, dx As Double dVol = 1E-05 epsilon = 1E-05 maxIter = 1000
- 3. Do Value_1 = optionprice(spot, strike, maturity, rf1, rf2, vol_1) vol_2 = vol_1 - dVol Value_2 = optionprice(spot, strike, maturity, rf1, rf2, vol_2) dx = (Value_1 - Value_2) / dVol If Abs(dx) < epsilon Or i = maxIter Then Exit Do vol_1 = vol_1 + (OptionValue - Value_1) / dx i = i + 1 Loop ImpliedVolatility = vol_1 End Function ====================================================================== Sub forexoption() Dim strike1(10) As Double strike1(1) = 1.294 strike1(2) = 1.296 strike1(3) = 1.298 strike1(4) = 1.3 strike1(5) = 1.302 strike1(6) = 1.304 strike1(7) = 1.306 strike1(8) = 1.308 strike1(9) = 1.31 strike1(10) = 1.312 Dim strike2(10) As Double strike2(1) = 1.288 strike2(2) = 1.291 strike2(3) = 1.294 strike2(4) = 1.297 strike2(5) = 1.3 strike2(6) = 1.303 strike2(7) = 1.306 strike2(8) = 1.309 strike2(9) = 1.312 strike2(10) = 1.315 Dim strike(10, 5) As Double Dim impexchange(10, 5) As Double For i1 = 1 To 10 For j1 = 1 To 5 Worksheets("raw data").Select strike(i1, j1) = Cells(i1, j1) impexchange(i1, j1) = Cells(i1 + 22, j1) Next j1
- 4. Next i1 Dim maturity(7) As Double maturity(1) = 1 / 52 maturity(2) = 1 / 26 maturity(3) = 1 / 12 maturity(4) = 1 / 6 maturity(5) = 1 / 4 maturity(6) = 1 / 2 maturity(7) = 1 Dim price1(10) As Double price1(1) = 0.00992 price1(2) = 0.00846 price1(3) = 0.00706 price1(4) = 0.00577 price1(5) = 0.00453 price1(6) = 0.00366 price1(7) = 0.00286 price1(8) = 0.0021 price1(9) = 0.00169 price1(10) = 0.00128 Dim price2(10) As Double price2(1) = 0.01625 price2(2) = 0.01364 price2(3) = 0.01147 price2(4) = 0.00938 price2(5) = 0.00743 price2(6) = 0.00581 price2(7) = 0.0045 price2(8) = 0.0034 price2(9) = 0.00253 price2(10) = 0.00195 Dim price(10, 5) As Double For S = 1 To 10 For T = 1 To 5 Worksheets("raw data").Select price(S, T) = Cells(11 + S, T) Next T Next S Worksheets("GBPUSD").Select
- 5. Dim domesticrf, foreignrf As Double domesticrf = 0.75 / 100 foreignrf = 1.54 / 100 spot = 1.2992 Dim impvol() As Double ReDim impvol(10) As Double For i2 = 1 To 7 a = 1 + (i2 - 1) * 13 Range("j" & a).value = "theotical option price" Range("k" & a).value = "real price" Range("l" & a).value = "implied volatility" Range("I" & a).value = "strike price" Range("M" & a).value = "implied volatility at exchange" 'Range("j14").Value = "theotical option price" 'Range("k14").Value = "real price" 'Range("l14").Value = "implied volatility" Next i2 For i = 1 To 10 Range("k" & i + 1).value = price1(i) Range("j" & i + 1).value = optionprice(spot, strike1(i), maturity(1), domesticrf, foreignrf, impvol(1)) 'Set to_value = Range("k" & i + 1) impvol(i) = ImpliedVolatility(spot, strike1(i), maturity(1), rf1, rf2, price1(i)) 're-calculate theoretical price by using the implied volatilities Range("j" & i + 1).value = optionprice(spot, strike1(i), maturity(1), domesticrf, foreignrf, impvol(i)) Range("l" & i + 1).value = impvol(i) 'maturity two weeks Range("k" & i + 14).value = price1(i) Range("j" & i + 14).value = optionprice(spot, strike2(i), maturity(2), domesticrf, foreignrf, impvol(2)) 'Set to_value = Range("k" & i + 1) impvol(i) = ImpliedVolatility(spot, strike2(i), maturity(2), rf1, rf2, price2(i)) 're-calculate theoretical price by using the implied volatilities
- 6. Range("j" & i + 14).value = optionprice(spot, strike2(i), maturity(2), domesticrf, foreignrf, impvol(i)) Range("l" & i + 14).value = impvol(i) Next i 'using for loop to calculate array of implied volatility, theoretical price with different maturity Worksheets("GBPUSD").Select For i3 = 3 To 7 For i4 = 1 To 10 b = 1 + (i3 - 1) * 13 + i4 Range("k" & b).value = price(i4, i3 - 2) Range("j" & b).value = optionprice(spot, strike(i4, i3 - 2), maturity(i3), domesticrf, foreignrf, impvol(1)) impvol(i4) = ImpliedVolatility(spot, strike(i4, i3 - 2), maturity(i3), rf1, rf2, price(i4, i3 - 2)) Range("j" & b).value = optionprice(spot, strike(i4, i3 - 2), maturity(i3), domesticrf, foreignrf, impvol(i4)) Range("l" & b).value = impvol(i4) Range("i" & b).value = strike(i4, i3 - 2) Range("m" & b).value = impexchange(i4, i3 - 2) Next i4 Next i3 End Sub ====================================================================== Sub plot_smile1() Dim sh As Worksheet Set sh = ActiveWorkbook.Worksheets("GBPUSD") sh.ChartObjects.Delete Dim xrng1 As Range Dim yrng1 As Range Range("L2:L11").Select Set yrng1 = Range("L2:L11") Range("M2:m11").Select Set yrng2 = Range("m2:m11") Range("K2:K11").Select Set xrng1 = Range("i2:i11")
- 7. Dim Chart As Chart Set Chart = sh.Shapes.AddChart.Chart With Chart .ChartType = xlXYScatter .SeriesCollection.NewSeries 'Change to what your series should be called .SeriesCollection(1).Name = "theoritical volatility smile at the maturity = one week" .SeriesCollection(1).XValues = xrng1 .SeriesCollection(1).Values = yrng1 .HasTitle = False .Axes(xlCategory, xlPrimary).HasTitle = True .Axes(xlCategory, xlPrimary).AxisTitle.Characters.Text = "Strike price" .Axes(xlValue, xlPrimary).HasTitle = True .Axes(xlValue, xlPrimary).AxisTitle.Characters.Text = "Theoritical implied vol" End With With Chart .ChartType = xlXYScatter .SeriesCollection.NewSeries 'Change to what your series should be called .SeriesCollection(2).Name = "realized volatility smile at the maturity = one week" .SeriesCollection(2).XValues = xrng1 .SeriesCollection(2).Values = yrng2 .HasTitle = False .Axes(xlCategory, xlPrimary).HasTitle = True .Axes(xlCategory, xlPrimary).AxisTitle.Characters.Text = "Strike price" .Axes(xlValue, xlPrimary).HasTitle = True .Axes(xlValue, xlPrimary).AxisTitle.Characters.Text = "realized implied vol" End With End Sub Sub plot_smile2() Dim sh As Worksheet Set sh = ActiveWorkbook.Worksheets("GBPUSD") Dim xrng2 As Range Dim yrng3, yrng4 As Range Range("L15:L24").Select Set yrng3 = Range("L15:L24") Range("M15:m24").Select Set yrng4 = Range("m15:m24") Range("K15:K24").Select Set xrng2 = Range("i15:i24")
- 8. Dim Chart As Chart Set Chart = sh.Shapes.AddChart.Chart With Chart .ChartType = xlXYScatter .SeriesCollection.NewSeries 'Change to what your series should be called .SeriesCollection(1).Name = "theoritical volatility smile at the maturity = one week" .SeriesCollection(1).XValues = xrng2 .SeriesCollection(1).Values = yrng3 .HasTitle = False .Axes(xlCategory, xlPrimary).HasTitle = True .Axes(xlCategory, xlPrimary).AxisTitle.Characters.Text = "Strike price" .Axes(xlValue, xlPrimary).HasTitle = True .Axes(xlValue, xlPrimary).AxisTitle.Characters.Text = "Theoritical implied vol" End With With Chart .ChartType = xlXYScatter .SeriesCollection.NewSeries 'Change to what your series should be called .SeriesCollection(2).Name = "realized volatility smile at the maturity = two week" .SeriesCollection(2).XValues = xrng2 .SeriesCollection(2).Values = yrng4 .HasTitle = False .Axes(xlCategory, xlPrimary).HasTitle = True .Axes(xlCategory, xlPrimary).AxisTitle.Characters.Text = "Strike price" .Axes(xlValue, xlPrimary).HasTitle = True .Axes(xlValue, xlPrimary).AxisTitle.Characters.Text = "realized implied vol" End With End Sub Sub plot_smile4() Dim sh As Worksheet Set sh = ActiveWorkbook.Worksheets("GBPUSD") Dim xrng2 As Range Dim yrng3, yrng4 As Range Range("L41:L50").Select Set yrng3 = Range("L41:L50") Range("M41:m50").Select Set yrng4 = Range("m41:m50")
- 9. Range("K41:K50").Select Set xrng2 = Range("i41:i50") Dim Chart As Chart Set Chart = sh.Shapes.AddChart.Chart With Chart .ChartType = xlXYScatter .SeriesCollection.NewSeries 'Change to what your series should be called .SeriesCollection(1).Name = "theoritical volatility smile at the maturity = one week" .SeriesCollection(1).XValues = xrng2 .SeriesCollection(1).Values = yrng3 .HasTitle = False .Axes(xlCategory, xlPrimary).HasTitle = True .Axes(xlCategory, xlPrimary).AxisTitle.Characters.Text = "Strike price" .Axes(xlValue, xlPrimary).HasTitle = True .Axes(xlValue, xlPrimary).AxisTitle.Characters.Text = "Theoritical implied vol" End With With Chart .ChartType = xlXYScatter .SeriesCollection.NewSeries 'Change to what your series should be called .SeriesCollection(2).Name = "realized volatility smile at the maturity = two week" .SeriesCollection(2).XValues = xrng2 .SeriesCollection(2).Values = yrng4 .HasTitle = False .Axes(xlCategory, xlPrimary).HasTitle = True .Axes(xlCategory, xlPrimary).AxisTitle.Characters.Text = "Strike price" .Axes(xlValue, xlPrimary).HasTitle = True .Axes(xlValue, xlPrimary).AxisTitle.Characters.Text = "realized implied vol" End With End Sub Sub plot_smile5() Dim sh As Worksheet Set sh = ActiveWorkbook.Worksheets("GBPUSD") Dim xrng2 As Range Dim yrng3, yrng4 As Range Range("L54:L63").Select Set yrng3 = Range("L54:L63") Range("M54:m63").Select
- 10. Set yrng4 = Range("m54:m63") Range("K54:K63").Select Set xrng2 = Range("i54:i63") Dim Chart As Chart Set Chart = sh.Shapes.AddChart.Chart With Chart .ChartType = xlXYScatter .SeriesCollection.NewSeries 'Change to what your series should be called .SeriesCollection(1).Name = "theoritical volatility smile at the maturity = one week" .SeriesCollection(1).XValues = xrng2 .SeriesCollection(1).Values = yrng3 .HasTitle = False .Axes(xlCategory, xlPrimary).HasTitle = True .Axes(xlCategory, xlPrimary).AxisTitle.Characters.Text = "Strike price" .Axes(xlValue, xlPrimary).HasTitle = True .Axes(xlValue, xlPrimary).AxisTitle.Characters.Text = "Theoritical implied vol" End With With Chart .ChartType = xlXYScatter .SeriesCollection.NewSeries 'Change to what your series should be called .SeriesCollection(2).Name = "realized volatility smile at the maturity = two week" .SeriesCollection(2).XValues = xrng2 .SeriesCollection(2).Values = yrng4 .HasTitle = False .Axes(xlCategory, xlPrimary).HasTitle = True .Axes(xlCategory, xlPrimary).AxisTitle.Characters.Text = "Strike price" .Axes(xlValue, xlPrimary).HasTitle = True .Axes(xlValue, xlPrimary).AxisTitle.Characters.Text = "realized implied vol" End With End Sub Sub plot_smile6() Dim sh As Worksheet Set sh = ActiveWorkbook.Worksheets("GBPUSD") Dim xrng2 As Range Dim yrng3, yrng4 As Range Range("L67:L76").Select
- 11. Set yrng3 = Range("L67:L76") Range("M67:m76").Select Set yrng4 = Range("m67:m76") Range("K67:K76").Select Set xrng2 = Range("i67:i76") Dim Chart As Chart Set Chart = sh.Shapes.AddChart.Chart With Chart .ChartType = xlXYScatter .SeriesCollection.NewSeries 'Change to what your series should be called .SeriesCollection(1).Name = "theoritical volatility smile at the maturity = one week" .SeriesCollection(1).XValues = xrng2 .SeriesCollection(1).Values = yrng3 .HasTitle = False .Axes(xlCategory, xlPrimary).HasTitle = True .Axes(xlCategory, xlPrimary).AxisTitle.Characters.Text = "Strike price" .Axes(xlValue, xlPrimary).HasTitle = True .Axes(xlValue, xlPrimary).AxisTitle.Characters.Text = "Theoritical implied vol" End With With Chart .ChartType = xlXYScatter .SeriesCollection.NewSeries 'Change to what your series should be called .SeriesCollection(2).Name = "realized volatility smile at the maturity = two week" .SeriesCollection(2).XValues = xrng2 .SeriesCollection(2).Values = yrng4 .HasTitle = False .Axes(xlCategory, xlPrimary).HasTitle = True .Axes(xlCategory, xlPrimary).AxisTitle.Characters.Text = "Strike price" .Axes(xlValue, xlPrimary).HasTitle = True .Axes(xlValue, xlPrimary).AxisTitle.Characters.Text = "realized implied vol" End With End Sub Sub plot_smile7() Dim sh As Worksheet Set sh = ActiveWorkbook.Worksheets("GBPUSD") Dim xrng2 As Range Dim yrng3, yrng4 As Range
- 12. Range("L80:L89").Select Set yrng3 = Range("L80:L89") Range("M80:m89").Select Set yrng4 = Range("m80:m89") Range("K80:K89").Select Set xrng2 = Range("i80:i89") Dim Chart As Chart Set Chart = sh.Shapes.AddChart.Chart With Chart .ChartType = xlXYScatter .SeriesCollection.NewSeries 'Change to what your series should be called .SeriesCollection(1).Name = "theoritical volatility smile at the maturity = one week" .SeriesCollection(1).XValues = xrng2 .SeriesCollection(1).Values = yrng3 .HasTitle = False .Axes(xlCategory, xlPrimary).HasTitle = True .Axes(xlCategory, xlPrimary).AxisTitle.Characters.Text = "Strike price" .Axes(xlValue, xlPrimary).HasTitle = True .Axes(xlValue, xlPrimary).AxisTitle.Characters.Text = "Theoritical implied vol" End With With Chart .ChartType = xlXYScatter .SeriesCollection.NewSeries 'Change to what your series should be called .SeriesCollection(2).Name = "realized volatility smile at the maturity = two week" .SeriesCollection(2).XValues = xrng2 .SeriesCollection(2).Values = yrng4 .HasTitle = False .Axes(xlCategory, xlPrimary).HasTitle = True .Axes(xlCategory, xlPrimary).AxisTitle.Characters.Text = "Strike price" .Axes(xlValue, xlPrimary).HasTitle = True .Axes(xlValue, xlPrimary).AxisTitle.Characters.Text = "realized implied vol" End With End Sub The dataset we’ve been using for those work: 1.275 1.275 1.275 1.25 1.25 strike price 1.28 1.28 1.28 1.26 1.26 1.285 1.285 1.285 1.27 1.27 1.29 1.29 1.29 1.28 1.28 1.295 1.295 1.295 1.29 1.29 1.3 1.3 1.3 1.3 1.3
- 13. 1.305 1.305 1.305 1.31 1.31 1.31 1.31 1.31 1.32 1.32 1.315 1.315 1.315 1.33 1.33 1.32 1.32 1.32 1.34 1.34 0.02772 0.03114 0.03469 0.06328 0.1116 price at exchange 0.02362 0.02722 0.03083 0.05524 0.10265 0.01984 0.02352 0.02731 0.04729 0.08617 0.01636 0.02012 0.02408 0.03993 0.07053 0.01314 0.01701 0.02097 0.03336 0.05653 0.01049 0.01422 0.01808 0.02764 0.04357 0.00818 0.01187 0.01541 0.02204 0.0329 0.0062 0.00972 0.01324 0.01769 0.02421 0.00472 0.00791 0.01126 0.01398 0.01751 0.00353 0.00642 0.0094 0.01084 0.01256 0.0684 0.0659 0.0644 0.0702 0.081 implied volatility at exchange 0.0675 0.0651 0.0639 0.0688 0.0796 0.0667 0.0644 0.0634 0.0675 0.077 0.0661 0.0639 0.063 0.0663 0.0745 0.0657 0.0635 0.0627 0.0653 0.0722 0.0655 0.0632 0.0625 0.0644 0.0701 0.0659 0.0632 0.0624 0.0639 0.0685 0.0666 0.0634 0.0624 0.0636 0.0677 0.0674 0.0637 0.0626 0.0637 0.0674 0.0684 0.0641 0.0628 0.0639 0.0676 After running the code we’ve got dataset and graph after running the code: strike price theotical option price real price implied volatility implied volatility at exchange 1.294 0.009819272 0.00992 0.102133381 0.0816 1.296 0.008359725 0.00846 0.095633719 0.0805 1.298 0.006960169 0.00706 0.089955134 0.0796 1.3 0.005670598 0.00577 0.085789255 0.0788 1.302 0.004431018 0.00453 0.082296248 0.0781 1.304 0.003561384 0.00366 0.083909542 0.0778 1.306 0.002761739 0.00286 0.086453441 0.0776 1.308 0.002002087 0.0021 0.089509233 0.0777 1.31 0.001592384 0.00169 0.097353626 0.078 1.312 0.001182679 0.00128 0.105141975 0.0785
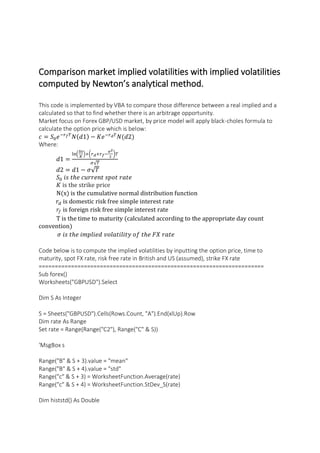
- 14. strike price theotical option price real price implied volatility implied volatility at exchange 1.294 0.016045311 0.00992 0.105292912 0.0792 1.296 0.013436797 0.00846 0.094240401 0.0785 1.298 0.011268151 0.00706 0.087529211 0.0777 1.3 0.009179481 0.00577 0.081582304 0.0771 1.302 0.00723077 0.00453 0.076984685 0.0768 1.304 0.005611959 0.00366 0.075591534 0.077 1.306 0.004303055 0.00286 0.077185806 0.0772 1.308 0.003204088 0.0021 0.080771143 0.0779 1.31 0.002335049 0.00169 0.086529724 0.0805 1.312 0.00175592 0.00128 0.095031475 0.0811 0 0.02 0.04 0.06 0.08 0.1 0.12 1.29 1.295 1.3 1.305 1.31 1.315 realizedimpliedvol Strike price theoritical volatility smile at the maturity = one week realized volatility smile at the maturity = one week Series3 0 0.02 0.04 0.06 0.08 0.1 0.12 1.29 1.295 1.3 1.305 1.31 1.315 realizedimpliedvol Strike price theoritical volatility smile at the maturity = one week realized volatility smile at the maturity = two week Series3
- 15. strike price theotical option price real price implied volatility implied volatility at exchange 1.275 0.03022236 0.03114 0.090789262 0.0659 1.28 0.026312551 0.02722 0.083956014 0.0651 1.285 0.022622448 0.02352 0.078150542 0.0644 1.29 0.019231945 0.02012 0.073742704 0.0639 1.295 0.016131055 0.01701 0.070670035 0.0635 1.3 0.013349737 0.01422 0.069059971 0.0632 1.305 0.011007829 0.01187 0.069461871 0.0632 1.31 0.008865643 0.00972 0.070728608 0.0634 1.315 0.007062989 0.00791 0.073505932 0.0637 1.32 0.005579887 0.00642 0.077685503 0.0641 strike price theotical option price real price implied volatility implied volatility at exchange 1.275 0.033308388 0.03469 0.088079928 0.0644 1.28 0.029463558 0.03083 0.082684175 0.0639 1.285 0.02595804 0.02731 0.078594177 0.0634 1.29 0.022741935 0.02408 0.075601647 0.063 1.295 0.019645582 0.02097 0.073036562 0.0627 1.3 0.01676878 0.01808 0.071280457 0.0625 1.305 0.014111525 0.01541 0.070324903 0.0624 1.31 0.011953247 0.01324 0.071234458 0.0624 1.315 0.009984565 0.01126 0.072806273 0.0626 1.32 0.008135616 0.0094 0.074767567 0.0628 0 0.01 0.02 0.03 0.04 0.05 0.06 0.07 0.08 0.09 0.1 1.27 1.28 1.29 1.3 1.31 1.32 1.33 realizedimpliedvol Strike price theoritical volatility smile at the maturity = one week realized volatility smile at the maturity = two week Series3
- 16. strike price theotical option price real price implied volatility implied volatility at exchange 1.25 0.060338522 0.06328 0.107411316 0.0702 1.26 0.052360635 0.05524 0.098835389 0.0688 1.27 0.044472327 0.04729 0.090458671 0.0675 1.28 0.037171529 0.03993 0.083663957 0.0663 1.29 0.030657419 0.03336 0.078969698 0.0653 1.3 0.024989734 0.02764 0.076497233 0.0644 1.31 0.019441487 0.02204 0.074222435 0.0639 1.32 0.015137922 0.01769 0.075186428 0.0636 1.33 0.011471515 0.01398 0.077694386 0.0637 1.34 0.008372494 0.01084 0.081532924 0.0639 0 0.01 0.02 0.03 0.04 0.05 0.06 0.07 0.08 0.09 0.1 1.27 1.28 1.29 1.3 1.31 1.32 1.33 realizedimpliedvol Strike price theoritical volatility smile at the maturity = one week realized volatility smile at the maturity = two week Series3 0 0.02 0.04 0.06 0.08 0.1 0.12 1.24 1.26 1.28 1.3 1.32 1.34 1.36 realizedimpliedvol Strike price theoritical volatility smile at the maturity = one week realized volatility smile at the maturity = two week Series3
- 17. strike price theotical option price real price implied volatility implied volatility at exchange 1.25 0.105329702 0.1116 0.172662986 0.081 1.26 0.096513507 0.10265 0.164148748 0.0796 1.27 0.080238077 0.08617 0.140725086 0.077 1.28 0.064792744 0.07053 0.119144066 0.0745 1.29 0.050970838 0.05653 0.100935968 0.0722 1.3 0.038178459 0.04357 0.084875153 0.0701 1.31 0.027655277 0.0329 0.073321094 0.0685 1.32 0.019094644 0.02421 0.065589327 0.0677 1.33 0.012506773 0.01751 0.061620384 0.0674 1.34 0.007653733 0.01256 0.060887743 0.0676 We find that the implied volatilities in market and the volatilities computed are not totally same. Besides we also would like to compare the delta in real market and these theoretical, Here, we’ve built the struct which allows us to unfasten some heavy coding work, below is the code: =================================================================== Sub calculatedelta() Dim d As Delta Set d = New Delta Dim strike(10, 5) As Double Dim impexchange(10, 5) As Double Dim price(10, 5) As Double Dim impvol() As Double 0 0.02 0.04 0.06 0.08 0.1 0.12 0.14 0.16 0.18 0.2 1.24 1.26 1.28 1.3 1.32 1.34 1.36 realizedimpliedvol Strike price theoritical volatility smile at the maturity = one week realized volatility smile at the maturity = two week Series3
- 18. ReDim impvol(10) As Double For i1 = 1 To 10 For j1 = 1 To 5 Worksheets("raw data").Select strike(i1, j1) = Cells(i1, j1) impexchange(i1, j1) = Cells(i1 + 22, j1) price(i1, j1) = Cells(i1 + 11, j1) Next j1 Next i1 Dim maturity(7) As Double maturity(1) = 1 / 52 maturity(2) = 1 / 26 maturity(3) = 1 / 12 maturity(4) = 1 / 6 maturity(5) = 1 / 4 maturity(6) = 1 / 2 maturity(7) = 1 Dim spot, rf1, rf2 As Double rf1 = 0.75 / 100 rf2 = 1.54 / 100 spot = 1.3073 Worksheets("Delta").Select Worksheets("Delta").Range("a1:f500").ClearContents For i3 = 3 To 7 For i4 = 1 To 10 b = 1 + i4 + (i3 - 3) * 12 Range("c" & b).value = price(i4, i3 - 2) Range("b" & b).value = d.optionprice(spot, strike(i4, i3 - 2), maturity(i3), rf1, rf2, impvol(1)) impvol(i4) = d.ImpliedVolatility(spot, strike(i4, i3 - 2), maturity(i3), rf1, rf2, price(i4, i3 - 2)) Range("b" & b).value = d.optionprice(spot, strike(i4, i3 - 2), maturity(i3), rf1, rf2, impvol(i4)) Range("d" & b).value = impvol(i4) Range("a" & b).value = strike(i4, i3 - 2) Range("e" & b).value = impexchange(i4, i3 - 2)
- 19. Range("f" & b).value = d.delta1(spot, strike(i4, i3 - 2), maturity(i3), rf1, rf2, impvol(i4)) Next i4 Next i3 d.strikeprice = "strike price" d.theoptionprice = "theoritical option price" d.realprice = "real price" d.impliedvol = "implied volatilities" d.realimpliedvol = "implied volatilities at exchange" d.optiondelta = "theoritical delta" d.deltaexchange = "delta at exchange" 'Debug.Print c 'Debug.Print p For i2 = 3 To 7 a = 1 + (i2 - 3) * 12 Range("a" & a).value = d.strikeprice Range("b" & a).value = d.theoptionprice Range("c" & a).value = d.realprice Range("d" & a).value = d.impliedvol Range("e" & a).value = d.realimpliedvol Range("f" & a).value = d.optiondelta Range("f" & a).Offset(0, 1).value = d.deltaexchange 'Range("j14").Value = "theotical option price" 'Range("k14").Value = "real price" 'Range("l14").Value = "implied volatility" Next i2 End Sub =================================================================== Code of Struct object construction (class) Option Explicit Private title1, title2, title3, title4, title5, title6, title7 As String Public Sub Class_initialize() Worksheets("raw data").Select End Sub =================================================================== Public Function delta1(ByVal spot As Double, ByVal strike As Double, maturity As Double, ByVal rf1 As Double, ByVal rf2 As Double, ByVal vol As Double) As Double
- 20. Dim a, b As Double a = WorksheetFunction.Ln(spot / strike) + (rf1 - rf2 + vol * vol * 0.5) * maturity b = a - vol * Sqr(maturity) delta1 = WorksheetFunction.Norm_S_Dist(a, True) End Function =================================================================== Public Function optionprice(ByVal spot As Double, ByVal strike As Double, maturity As Double, ByVal rf1 As Double, ByVal rf2 As Double, vol As Double) As Double Dim a, b As Double a = WorksheetFunction.Ln(spot / strike) + (rf1 - rf2 + vol * vol * 0.5) * maturity b = a - vol * Sqr(maturity) optionprice = spot * Exp(-rf2 * maturity) * WorksheetFunction.NormSDist(Arg1:=a) - strike * Exp(-rf1 * maturity) * WorksheetFunction.NormSDist(Arg1:=b) End Function =================================================================== Function ImpliedVolatility(ByVal spot As Double, ByVal strike As Double, ByVal maturity As Double, ByVal rf1 As Double, ByVal rf2 As Double, ByVal OptionValue As Double) As Double Dim epsilon As Double, dVol As Double, vol_1 As Double Dim i As Integer, maxIter As Integer, Value_1 As Double, vol_2 As Double Dim Value_2 As Double, dx As Double dVol = 1E-05 epsilon = 1E-05 maxIter = 1000 Do Value_1 = optionprice(spot, strike, maturity, rf1, rf2, vol_1) vol_2 = vol_1 - dVol Value_2 = optionprice(spot, strike, maturity, rf1, rf2, vol_2) dx = (Value_1 - Value_2) / dVol If Abs(dx) < epsilon Or i = maxIter Then Exit Do vol_1 = vol_1 + (OptionValue - Value_1) / dx i = i + 1 Loop ImpliedVolatility = vol_1 End Function
- 21. =================================================================== Public Property Let strikeprice(value As String) title1 = value End Property =================================================================== Public Property Get strikeprice() As String strikeprice = title1 End Property =================================================================== Public Property Let theoptionprice(value As String) title2 = value End Property =================================================================== Public Property Get theoptionprice() As String theoptionprice = title2 End Property =================================================================== Public Property Let realprice(value As String) title3 = value End Property =================================================================== Public Property Get realprice() As String realprice = title3 End Property =================================================================== Public Property Let impliedvol(value As String) title4 = value End Property =================================================================== Public Property Get impliedvol() As String impliedvol = title4 End Property =================================================================== Public Property Let realimpliedvol(value As String) title5 = value End Property
- 22. =================================================================== Public Property Get realimpliedvol() As String realimpliedvol = title5 End Property =================================================================== Public Property Let optiondelta(value As String) title6 = value End Property =================================================================== Public Property Get optiondelta() As String optiondelta = title6 End Property =================================================================== Public Property Let deltaexchange(value As String) title7 = value End Property =================================================================== Public Property Get deltaexchange() As String deltaexchange = title7 End Property =================================================================== Below is the results by using the class object and algorithm to get the delta in different circumstances: strike price theoritical option price real price implied volatilities implied volatilities at exchange theoritical delta delta at exchange 1.275 0.028 0.028 0.080 0.068 0.510 0.830 1.280 0.024 0.024 0.069 0.068 0.508 0.770 1.285 0.020 0.020 0.061 0.067 0.507 0.700 1.290 0.016 0.016 0.054 0.066 0.505 0.620 1.295 0.013 0.013 0.050 0.066 0.504 0.540 1.300 0.010 0.010 0.049 0.066 0.502 0.450 1.305 0.008 0.008 0.050 0.066 0.500 0.370 1.310 0.006 0.006 0.053 0.067 0.499 0.300 1.315 0.005 0.005 0.059 0.067 0.497 0.230 1.320 0.004 0.004 0.067 0.068 0.496 0.180 strike price theoritical option price real price implied volatilities implied volatilities at exchange theoritical delta delta at exchange 1.275 0.03114 0.03114 0.075102 0.0659 0.5096419 0.76 1.28 0.02722 0.02722 0.068398 0.0651 0.5080489 0.71 1.285 0.02352 0.02352 0.0627222 0.0644 0.5064691 0.66
- 23. 1.29 0.02012 0.02012 0.0584446 0.0639 0.5049028 0.6 1.295 0.01701 0.01701 0.0555025 0.0635 0.5033484 0.54 1.3 0.01422 0.01422 0.0540234 0.0632 0.5018057 0.48 1.305 0.01187 0.01187 0.0545569 0.0632 0.5002762 0.42 1.31 0.00972 0.00972 0.0559545 0.0634 0.4987557 0.37 1.315 0.00791 0.00791 0.0588623 0.0637 0.4972471 0.31 1.32 0.00642 0.00642 0.0631717 0.0641 0.4957506 0.27 strike price theoritical option price real price implied volatilities implied volatilities at exchange theoritical delta delta at exchange 1.275 0.03469 0.03469 0.0771224 0.0644 0.5094884 0.73 1.28 0.03083 0.03083 0.0718054 0.0639 0.5078879 0.69 1.285 0.02731 0.02731 0.0677958 0.0634 0.5063049 0.64 1.29 0.02408 0.02408 0.0648849 0.063 0.5047365 0.6 1.295 0.02097 0.02097 0.0624016 0.0627 0.5031775 0.55 1.3 0.01808 0.01808 0.0607279 0.0625 0.5016299 0.5 1.305 0.01541 0.01541 0.0598552 0.0624 0.5000932 0.45 1.31 0.01324 0.01324 0.0608495 0.0624 0.4985736 0.4 1.315 0.01126 0.01126 0.0625061 0.0626 0.4970641 0.36 1.32 0.0094 0.0094 0.0645517 0.0628 0.4955631 0.31 strike price theoritical option price real price implied volatilities implied volatilities at exchange theoritical delta delta at exchange 1.25 0.06328 0.06328 0.1036468 0.0702 0.5173709 0.78 1.26 0.05524 0.05524 0.0950645 0.0688 0.5140245 0.74 1.27 0.04729 0.04729 0.0866826 0.0675 0.5107205 0.68 1.28 0.03993 0.03993 0.0798887 0.0663 0.5074795 0.62 1.29 0.03336 0.03336 0.075203 0.0653 0.5043027 0.56 1.3 0.02764 0.02764 0.0727469 0.0644 0.5011859 0.49 1.31 0.02204 0.02204 0.0704892 0.0639 0.4980966 0.43 1.32 0.01769 0.01769 0.071481 0.0636 0.495077 0.36 1.33 0.01398 0.01398 0.0740216 0.0637 0.4921034 0.31 1.34 0.01084 0.01084 0.0778966 0.0639 0.4891746 0.25 strike price theoritical option price real price implied volatilities implied volatilities at exchange theoritical delta delta at exchange 1.25 0.1116 0.1116 0.1767065 0.081 0.520948 0.83 1.26 0.10265 0.10265 0.1680043 0.0796 0.5171751 0.78 1.27 0.08617 0.08617 0.1442731 0.077 0.5125464 0.72 1.28 0.07053 0.07053 0.1224021 0.0745 0.5082555 0.66 1.29 0.05653 0.05653 0.1039338 0.0722 0.5043176 0.58 1.3 0.04357 0.04357 0.0876325 0.0701 0.5006141 0.49
- 24. 1.31 0.0329 0.0329 0.0758764 0.0685 0.4971737 0.4 1.32 0.02421 0.02421 0.0679754 0.0677 0.4939134 0.32 1.33 0.01751 0.01751 0.0638693 0.0674 0.4907951 0.25 1.34 0.01256 0.01256 0.0630278 0.0676 0.4877865 0.19