SlideShare a Scribd company logo
Comparing the Returns of Walmart to the Returns of the
Standard & Poor 500 Index
Mia Attruia
The task at hand is to test the
hypotheses that the year over year, end
of month returns of Walmart from
January 2005 through September 2015,
is equal to the returns of S&P500 Index
over the same period.
Data
The end of month price data are taken
from Yahoo Finance and the year over
year returns are computed using:
rt = 100 * ln (Pricet / Pricet-12)
Pricet represents the end of month stock
price from either Walmart or the
S&P500 Index value at time t. Pricet-12
represents the price or index value 12
months prior. We lose the first year of
data because we are using year-over-
year returns; therefore, the data is
available from January 2006 through
September 2015 for a total of 117
observations.
Returns plotted in Figure 1
Figure 1: Year-over-year percent returns of
Walmart and the S&P500 Index from 1/2006
through 9/2015
The plots show that the two returns
move together and are positively
correlated. The simple correlation
between the returns of the two
companies is 0.10004412 and the t-value
for the two-tailed null hypothesis that
this correlation is zero is t(115) =
1.07826, with two-tailed p-value 0.2832.
We conclude that the returns are in fact,
significantly positively correlated.
Table 1: The sample means and standard
deviations for the year-over-year percent
returns of Walmart (rWalmart) and the
S&P500 Index (rSP) from 1/2006
through 9/2015.
Mean St. Dev.
rWalmart 6.93392 11.6916
rSP 5.41001 18.9238
Hypothesis Tests
The results of the t-test for the two-tailed
hypothesis:
H0 : rWalmart = 0 versus Ha : rWalmart ≠ 0
Are:
Null Hypothesis
Population
Mean
0
Sample Size n = 117
Sample Mean 6.93392
Standard
Deviation
11.6916
Test Statistic t(116) = (6.93392 - 0)/1.08089 =
6.41501
Two-Tailed P-
Value
3.176e-09
The returns of Walmart are
significantly different from zero over this
period of time. We also conclude that the
returns of the S&P500 Index are
significantly different from zero at the 5%
level over this period with a t-value of
(5.41001-0)/1.7495=3.092317805 and
Two-tailed p-value = 0.002488
Now we test the hypothesis that the
average returns of Walmart is the same
as the average returns of the S&P500
Index over this time period.
The standard deviations of the
two returns are different; therefore, we
will conduct the test assuming different
variances for each sample. We can
verify this assumption using the “2
variances” test in gretl. This “un-pooled”
test, otherwise names the Welch’s t-test,
is more general than the “pooled”
variance test reported in the Stock and
Watson textbook and the test statistic is
only approximately distributed with a t-
distribution. The degrees of freedom for
the un-pooled test statistic are given by
the Welch-Satterthwaite equation
where si
2
and ni, i= 1, 2, are the sample
variances and sample sized of the two
samples in the test.
The results of the two-tailed
hypothesis:
Ho : rWalmart = rSP versus Ha : rWalmart ≠ rSP
Or,
Ho : rWalmart – rSP = 0 versus Ha : rWalmart –
rSP ≠ 0
Null Hypothesis Difference of means =
0
Test Statistic t(193) = (6.93392 -
5.41001)/2.05647 =
0.74103
Two - Tailed 0.4596
One - Tailed 0.2298
The standard of deviation of rWalmart –
rSP is computed as follows:
= 2.056475528
In conclusion, the data shows that the
returns from Walmart are not
significantly different from the returns of
the S&P500 Index.
Summary
The year-over-year percentage
returns of the end of the month stock
price of Walmart and the Standard and
Poor 500 Index from January 2006
through September 2015 (117
Observations), has been computed. The
returns data are significantly positively
correlated. We find that the year-over-
year returns are significantly different
from zero for both portfolios. This
occurs because the volatility of year-
over-year returns is much lower than
month-over-month returns.
Neither the returns of Walmart
nor the S&P500 Index are normally
distributed over this period, also, t-tests
are only approximately correct.
Since we have so many observations in
our samples, we can appeal to the central
limit theorem and assume that our test
statistics are approximately normally
distributed. Therefore, our conclusions
should me accurate and reliable.

More Related Content

Similar to Comparing the Returns of Walmart to the Returns of the Standard & Poor 500 Index

plz finish the last four questions (10-13)write the report for tho.docx
plz finish the last four questions (10-13)write the report for tho.docxplz finish the last four questions (10-13)write the report for tho.docx
plz finish the last four questions (10-13)write the report for tho.docx
jolleybendicty
 
Chapter 04
Chapter 04Chapter 04
Chapter 04
bmcfad01
 
Chapter 16
Chapter 16Chapter 16
Chapter 16
bmcfad01
 
Project Week 71. Both graphs shows a.docx
Project Week 71. Both graphs shows a.docxProject Week 71. Both graphs shows a.docx
Project Week 71. Both graphs shows a.docx
wkyra78
 
Copyright © 2015 McGraw-Hill Education. All rights reserved. N.docx
Copyright © 2015 McGraw-Hill Education. All rights reserved. N.docxCopyright © 2015 McGraw-Hill Education. All rights reserved. N.docx
Copyright © 2015 McGraw-Hill Education. All rights reserved. N.docx
dickonsondorris
 
Economic Forecasting Final Memo
Economic Forecasting Final MemoEconomic Forecasting Final Memo
Economic Forecasting Final Memo
Hannah Badgley
 
1.After you merged both datasets as described in the Instruction.docx
1.After you merged both datasets as described in the Instruction.docx1.After you merged both datasets as described in the Instruction.docx
1.After you merged both datasets as described in the Instruction.docx
hacksoni
 
Lecture8 Applied Econometrics and Economic Modeling
Lecture8 Applied Econometrics and Economic ModelingLecture8 Applied Econometrics and Economic Modeling
Lecture8 Applied Econometrics and Economic Modeling
stone55
 
Chap 04 - Describing Data_Displaying and Exploring Data.pdf
Chap 04 - Describing Data_Displaying and Exploring Data.pdfChap 04 - Describing Data_Displaying and Exploring Data.pdf
Chap 04 - Describing Data_Displaying and Exploring Data.pdf
SouravHasan8
 

Similar to Comparing the Returns of Walmart to the Returns of the Standard & Poor 500 Index (20)

Econometics - lecture 22 and 23
Econometics - lecture 22 and 23Econometics - lecture 22 and 23
Econometics - lecture 22 and 23
 
plz finish the last four questions (10-13)write the report for tho.docx
plz finish the last four questions (10-13)write the report for tho.docxplz finish the last four questions (10-13)write the report for tho.docx
plz finish the last four questions (10-13)write the report for tho.docx
 
MomentumFinal
MomentumFinalMomentumFinal
MomentumFinal
 
Testing for the 'January Effect' under the CAPM framework
Testing for the 'January Effect' under the CAPM frameworkTesting for the 'January Effect' under the CAPM framework
Testing for the 'January Effect' under the CAPM framework
 
Chapter 04
Chapter 04Chapter 04
Chapter 04
 
Chapter 16
Chapter 16Chapter 16
Chapter 16
 
Chap013.ppt
Chap013.pptChap013.ppt
Chap013.ppt
 
Project Week 71. Both graphs shows a.docx
Project Week 71. Both graphs shows a.docxProject Week 71. Both graphs shows a.docx
Project Week 71. Both graphs shows a.docx
 
Chapter 13 (1).pdf
Chapter 13 (1).pdfChapter 13 (1).pdf
Chapter 13 (1).pdf
 
Choosing the right multiple
Choosing the right multiple Choosing the right multiple
Choosing the right multiple
 
APT_&_VaR[1]
APT_&_VaR[1]APT_&_VaR[1]
APT_&_VaR[1]
 
Copyright © 2015 McGraw-Hill Education. All rights reserved. N.docx
Copyright © 2015 McGraw-Hill Education. All rights reserved. N.docxCopyright © 2015 McGraw-Hill Education. All rights reserved. N.docx
Copyright © 2015 McGraw-Hill Education. All rights reserved. N.docx
 
Economic Forecasting Final Memo
Economic Forecasting Final MemoEconomic Forecasting Final Memo
Economic Forecasting Final Memo
 
1.After you merged both datasets as described in the Instruction.docx
1.After you merged both datasets as described in the Instruction.docx1.After you merged both datasets as described in the Instruction.docx
1.After you merged both datasets as described in the Instruction.docx
 
Statistics Review
Statistics ReviewStatistics Review
Statistics Review
 
Presentation on The Dog That Did Not Bark: A Defense of Return Predictability
Presentation on The Dog That Did Not Bark: A Defense of Return PredictabilityPresentation on The Dog That Did Not Bark: A Defense of Return Predictability
Presentation on The Dog That Did Not Bark: A Defense of Return Predictability
 
Lecture8 Applied Econometrics and Economic Modeling
Lecture8 Applied Econometrics and Economic ModelingLecture8 Applied Econometrics and Economic Modeling
Lecture8 Applied Econometrics and Economic Modeling
 
Chap 04 - Describing Data_Displaying and Exploring Data.pdf
Chap 04 - Describing Data_Displaying and Exploring Data.pdfChap 04 - Describing Data_Displaying and Exploring Data.pdf
Chap 04 - Describing Data_Displaying and Exploring Data.pdf
 
Chap013.ppt
Chap013.pptChap013.ppt
Chap013.ppt
 
Fm11 ch 05 show
Fm11 ch 05 showFm11 ch 05 show
Fm11 ch 05 show
 

Recently uploaded

Introduction to Economics II Chapter 28 Unemployment (1).pdf
Introduction to Economics II Chapter 28 Unemployment (1).pdfIntroduction to Economics II Chapter 28 Unemployment (1).pdf
Introduction to Economics II Chapter 28 Unemployment (1).pdf
Safa444074
 
PD ARRAY THEORY FOR INTERMEDIATE (1).pdf
PD ARRAY THEORY FOR INTERMEDIATE (1).pdfPD ARRAY THEORY FOR INTERMEDIATE (1).pdf
PD ARRAY THEORY FOR INTERMEDIATE (1).pdf
JerrySMaliki
 
655264371-checkpoint-science-past-papers-april-2023.pdf
655264371-checkpoint-science-past-papers-april-2023.pdf655264371-checkpoint-science-past-papers-april-2023.pdf
655264371-checkpoint-science-past-papers-april-2023.pdf
morearsh02
 
一比一原版UO毕业证渥太华大学毕业证成绩单如何办理
一比一原版UO毕业证渥太华大学毕业证成绩单如何办理一比一原版UO毕业证渥太华大学毕业证成绩单如何办理
一比一原版UO毕业证渥太华大学毕业证成绩单如何办理
yonemuk
 
what is the future of Pi Network currency.
what is the future of Pi Network currency.what is the future of Pi Network currency.
what is the future of Pi Network currency.
DOT TECH
 
一比一原版Adelaide毕业证阿德莱德大学毕业证成绩单如何办理
一比一原版Adelaide毕业证阿德莱德大学毕业证成绩单如何办理一比一原版Adelaide毕业证阿德莱德大学毕业证成绩单如何办理
一比一原版Adelaide毕业证阿德莱德大学毕业证成绩单如何办理
zsewypy
 
Monthly Economic Monitoring of Ukraine No. 232, May 2024
Monthly Economic Monitoring of Ukraine No. 232, May 2024Monthly Economic Monitoring of Ukraine No. 232, May 2024

Recently uploaded (20)

how can I sell/buy bulk pi coins securely
how can I sell/buy bulk pi coins securelyhow can I sell/buy bulk pi coins securely
how can I sell/buy bulk pi coins securely
 
Introduction to Economics II Chapter 28 Unemployment (1).pdf
Introduction to Economics II Chapter 28 Unemployment (1).pdfIntroduction to Economics II Chapter 28 Unemployment (1).pdf
Introduction to Economics II Chapter 28 Unemployment (1).pdf
 
how to sell pi coins at high rate quickly.
how to sell pi coins at high rate quickly.how to sell pi coins at high rate quickly.
how to sell pi coins at high rate quickly.
 
Greek trade a pillar of dynamic economic growth - European Business Review
Greek trade a pillar of dynamic economic growth - European Business ReviewGreek trade a pillar of dynamic economic growth - European Business Review
Greek trade a pillar of dynamic economic growth - European Business Review
 
PD ARRAY THEORY FOR INTERMEDIATE (1).pdf
PD ARRAY THEORY FOR INTERMEDIATE (1).pdfPD ARRAY THEORY FOR INTERMEDIATE (1).pdf
PD ARRAY THEORY FOR INTERMEDIATE (1).pdf
 
655264371-checkpoint-science-past-papers-april-2023.pdf
655264371-checkpoint-science-past-papers-april-2023.pdf655264371-checkpoint-science-past-papers-april-2023.pdf
655264371-checkpoint-science-past-papers-april-2023.pdf
 
what is the best method to sell pi coins in 2024
what is the best method to sell pi coins in 2024what is the best method to sell pi coins in 2024
what is the best method to sell pi coins in 2024
 
一比一原版UO毕业证渥太华大学毕业证成绩单如何办理
一比一原版UO毕业证渥太华大学毕业证成绩单如何办理一比一原版UO毕业证渥太华大学毕业证成绩单如何办理
一比一原版UO毕业证渥太华大学毕业证成绩单如何办理
 
what is the future of Pi Network currency.
what is the future of Pi Network currency.what is the future of Pi Network currency.
what is the future of Pi Network currency.
 
Summary of financial results for 1Q2024
Summary of financial  results for 1Q2024Summary of financial  results for 1Q2024
Summary of financial results for 1Q2024
 
Isios-2024-Professional-Independent-Trustee-Survey.pdf
Isios-2024-Professional-Independent-Trustee-Survey.pdfIsios-2024-Professional-Independent-Trustee-Survey.pdf
Isios-2024-Professional-Independent-Trustee-Survey.pdf
 
Introduction to Economics II Chapter 25 Production and Growth.pdf
Introduction to Economics II Chapter 25 Production and Growth.pdfIntroduction to Economics II Chapter 25 Production and Growth.pdf
Introduction to Economics II Chapter 25 Production and Growth.pdf
 
how can i use my minded pi coins I need some funds.
how can i use my minded pi coins I need some funds.how can i use my minded pi coins I need some funds.
how can i use my minded pi coins I need some funds.
 
Webinar Exploring DORA for Fintechs - Simont Braun
Webinar Exploring DORA for Fintechs - Simont BraunWebinar Exploring DORA for Fintechs - Simont Braun
Webinar Exploring DORA for Fintechs - Simont Braun
 
The new type of smart, sustainable entrepreneurship and the next day | Europe...
The new type of smart, sustainable entrepreneurship and the next day | Europe...The new type of smart, sustainable entrepreneurship and the next day | Europe...
The new type of smart, sustainable entrepreneurship and the next day | Europe...
 
how to sell pi coins on Binance exchange
how to sell pi coins on Binance exchangehow to sell pi coins on Binance exchange
how to sell pi coins on Binance exchange
 
一比一原版Adelaide毕业证阿德莱德大学毕业证成绩单如何办理
一比一原版Adelaide毕业证阿德莱德大学毕业证成绩单如何办理一比一原版Adelaide毕业证阿德莱德大学毕业证成绩单如何办理
一比一原版Adelaide毕业证阿德莱德大学毕业证成绩单如何办理
 
Monthly Economic Monitoring of Ukraine No. 232, May 2024
Monthly Economic Monitoring of Ukraine No. 232, May 2024Monthly Economic Monitoring of Ukraine No. 232, May 2024
Monthly Economic Monitoring of Ukraine No. 232, May 2024
 
how can I transfer pi coins to someone in a different country.
how can I transfer pi coins to someone in a different country.how can I transfer pi coins to someone in a different country.
how can I transfer pi coins to someone in a different country.
 
Economics and Economic reasoning Chap. 1
Economics and Economic reasoning Chap. 1Economics and Economic reasoning Chap. 1
Economics and Economic reasoning Chap. 1
 

Comparing the Returns of Walmart to the Returns of the Standard & Poor 500 Index

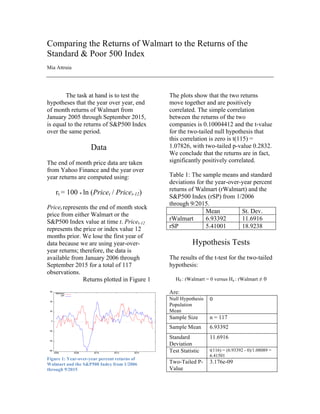
  • 1. Comparing the Returns of Walmart to the Returns of the Standard & Poor 500 Index Mia Attruia The task at hand is to test the hypotheses that the year over year, end of month returns of Walmart from January 2005 through September 2015, is equal to the returns of S&P500 Index over the same period. Data The end of month price data are taken from Yahoo Finance and the year over year returns are computed using: rt = 100 * ln (Pricet / Pricet-12) Pricet represents the end of month stock price from either Walmart or the S&P500 Index value at time t. Pricet-12 represents the price or index value 12 months prior. We lose the first year of data because we are using year-over- year returns; therefore, the data is available from January 2006 through September 2015 for a total of 117 observations. Returns plotted in Figure 1 Figure 1: Year-over-year percent returns of Walmart and the S&P500 Index from 1/2006 through 9/2015 The plots show that the two returns move together and are positively correlated. The simple correlation between the returns of the two companies is 0.10004412 and the t-value for the two-tailed null hypothesis that this correlation is zero is t(115) = 1.07826, with two-tailed p-value 0.2832. We conclude that the returns are in fact, significantly positively correlated. Table 1: The sample means and standard deviations for the year-over-year percent returns of Walmart (rWalmart) and the S&P500 Index (rSP) from 1/2006 through 9/2015. Mean St. Dev. rWalmart 6.93392 11.6916 rSP 5.41001 18.9238 Hypothesis Tests The results of the t-test for the two-tailed hypothesis: H0 : rWalmart = 0 versus Ha : rWalmart ≠ 0 Are: Null Hypothesis Population Mean 0 Sample Size n = 117 Sample Mean 6.93392 Standard Deviation 11.6916 Test Statistic t(116) = (6.93392 - 0)/1.08089 = 6.41501 Two-Tailed P- Value 3.176e-09
  • 2. The returns of Walmart are significantly different from zero over this period of time. We also conclude that the returns of the S&P500 Index are significantly different from zero at the 5% level over this period with a t-value of (5.41001-0)/1.7495=3.092317805 and Two-tailed p-value = 0.002488 Now we test the hypothesis that the average returns of Walmart is the same as the average returns of the S&P500 Index over this time period. The standard deviations of the two returns are different; therefore, we will conduct the test assuming different variances for each sample. We can verify this assumption using the “2 variances” test in gretl. This “un-pooled” test, otherwise names the Welch’s t-test, is more general than the “pooled” variance test reported in the Stock and Watson textbook and the test statistic is only approximately distributed with a t- distribution. The degrees of freedom for the un-pooled test statistic are given by the Welch-Satterthwaite equation where si 2 and ni, i= 1, 2, are the sample variances and sample sized of the two samples in the test. The results of the two-tailed hypothesis: Ho : rWalmart = rSP versus Ha : rWalmart ≠ rSP Or, Ho : rWalmart – rSP = 0 versus Ha : rWalmart – rSP ≠ 0 Null Hypothesis Difference of means = 0 Test Statistic t(193) = (6.93392 - 5.41001)/2.05647 = 0.74103 Two - Tailed 0.4596 One - Tailed 0.2298 The standard of deviation of rWalmart – rSP is computed as follows: = 2.056475528 In conclusion, the data shows that the returns from Walmart are not significantly different from the returns of the S&P500 Index. Summary The year-over-year percentage returns of the end of the month stock price of Walmart and the Standard and Poor 500 Index from January 2006 through September 2015 (117 Observations), has been computed. The returns data are significantly positively correlated. We find that the year-over- year returns are significantly different from zero for both portfolios. This occurs because the volatility of year- over-year returns is much lower than month-over-month returns. Neither the returns of Walmart nor the S&P500 Index are normally distributed over this period, also, t-tests are only approximately correct. Since we have so many observations in our samples, we can appeal to the central limit theorem and assume that our test statistics are approximately normally distributed. Therefore, our conclusions should me accurate and reliable.