Download to read offline


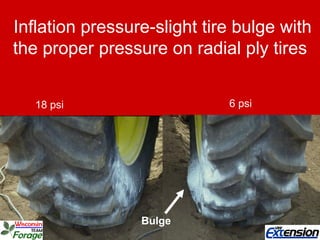


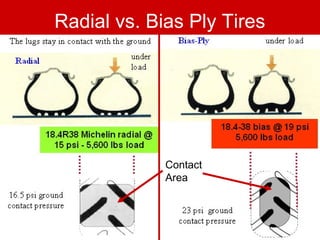

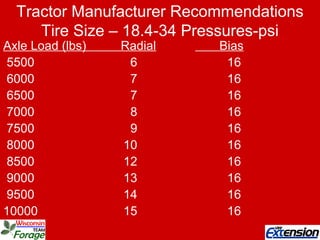


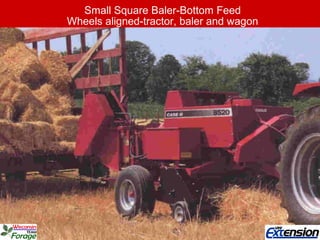


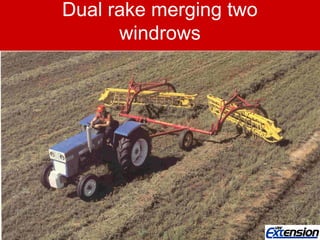
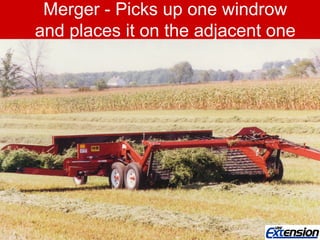


This document discusses soil compaction issues in alfalfa fields and strategies to mitigate compaction. It covers how compaction can be caused by wheel traffic, tillage, and precipitation. Key factors that influence compaction are tire size, inflation pressure, radial vs. bias ply design, avoiding wet soil during field work, proper wheel alignment of equipment, selecting lighter machinery, and distributing traffic across fields. The document provides details on measuring soil compaction and recommends best practices like using wider equipment that merges windrows to reduce wheel passes and choosing self-propelled versus pull-type machinery.


