Download as PDF, PPTX


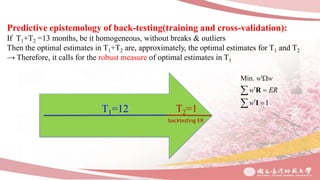


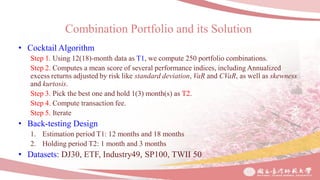
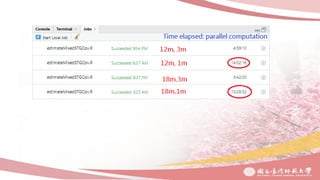
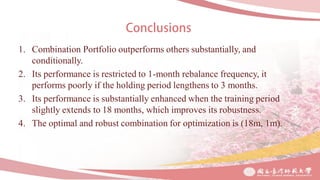

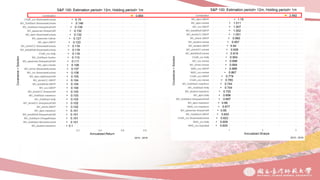
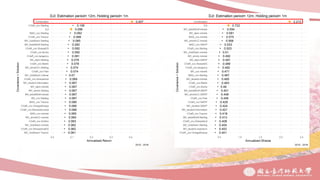
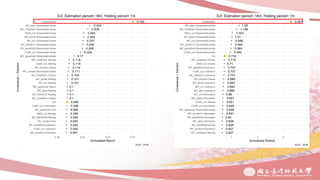
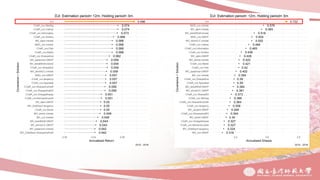

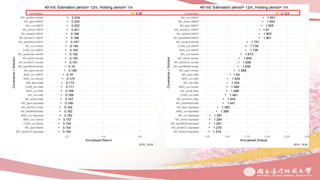


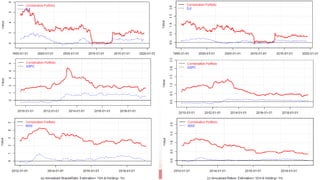

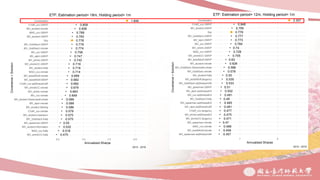
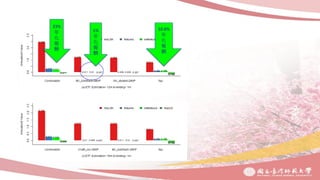
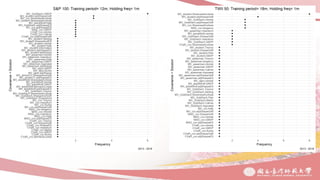
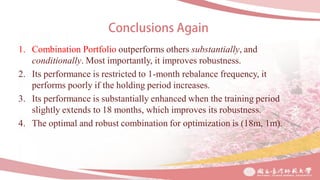

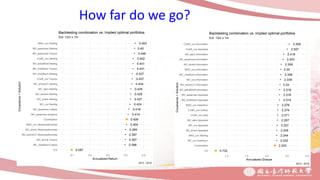
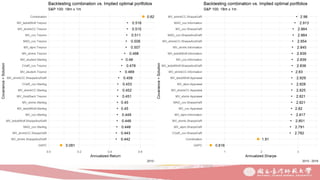
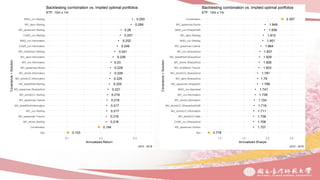


1. The document discusses combination portfolio optimization and its performance compared to other strategies through backtesting. 2. The optimal combination portfolio is found to be rebalancing every 1 month with an 18-month training period, which improves its robustness. 3. Combination portfolio is shown to outperform single strategies substantially, especially when diversifying across different asset classes and industries. However, its performance deteriorates when the holding period is extended beyond 1 month.


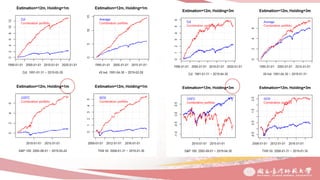
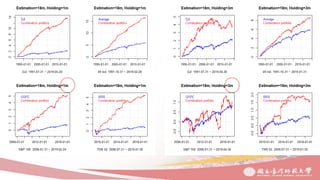
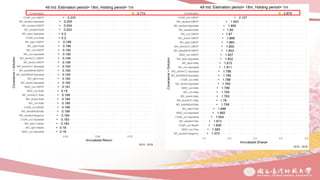
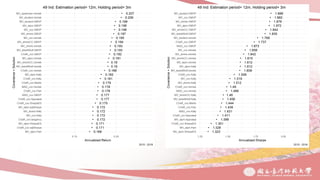
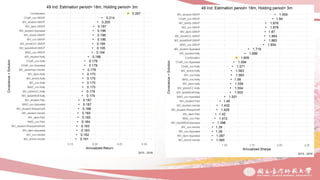
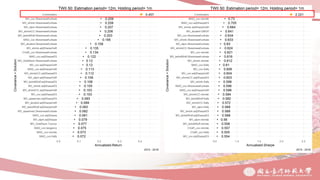
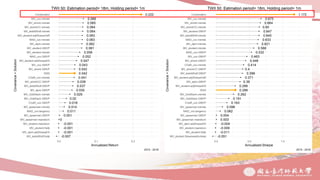
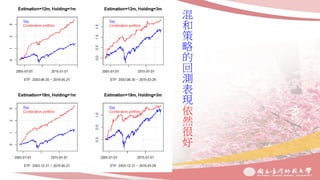
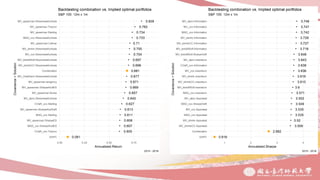
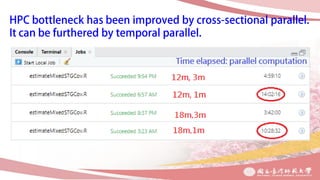
![Awareness of digital currency[1] (1).pptx](https://cdn.slidesharecdn.com/ss_thumbnails/awarenessofdigitalcurrency11-260125155504-b1badee4-thumbnail.jpg?width=640&height=640&fit=bounds)


