Download to read offline


![81Urbanization and Sustainable Development in the Mekong Region
Vietnam, and Yunnan and Guangxi provinces of China (ADB 2012).2 A
key strategy of the GMS program has been to reduce regional transport
costs, and to facilitate liberalized trade and investment between major
cities and urban areas by promoting ‘economic corridors’ (ADB 2012).
The GMS program has facilitated the construction of large-scale cross-
border infrastructure such as highways, railways, high-voltage power
transmission lines, and hydropower dams to physically interconnect urban
centers and their hinterlands. The ADB promotes a model of regional
development that in many ways emphasizes urban-led economic growth
with an intended goal of poverty reduction. Others have highlighted
the costs of economic regionalization, namely the environmental and
social impacts of resource extraction in the hinterlands, especially for
the marginalized (Guttal 2006; Cornford and Matthews 2007), including
increasingly prevalent land-grabbing across the region (Hall et al. 2011).
Oehlers points towards the risks of an “entrepôt” mode of development
emerging, “defined by increasingly complex corridors linking poles
of [urban] activity, but with very little else within or between,” where
a lack of sufficient emphasis on improving productivity risks “a low
productivity, low wage trap” for the majority (Oehlers 2006: 467, 472).
Urban poverty
In the cities of the Mekong region, a relative minority are wealthy, well-
educated, and mobile, and fully enjoy urban amenities, living near the
center, or in gated communities within well-serviced and relatively green
spaces. There is also a growing middle class in the suburbs, who enjoy
relative material abundance where services meet most needs, although
they may face other challenges, such as long commutes to work. At the
other end of the socioeconomic scale, there are the urban poor who live in
slums and squatter settlements, and survive largely within the informal
economy (Savage 2006; Seabrook 2007).
Urban poverty is multidimensional and relates not only to low levels
of income, employment, and assets, but also a lack of access to basic
services and to local political and bureaucratic systems that are unable
or unwilling to meet the needs of the urban poor (Elliott 2006; Sheng
2010). Whilst levels of poverty remain higher in rural than urban areas in
Southeast Asia (Balisacan et al. 2005), within urban areas there is also great
inequality in opportunity, wealth, and access to resources. For example,
the gini coefficients in Phnom Penh, Hanoi, Bangkok, Ho Chi Minh City,](https://image.slidesharecdn.com/a0f6efb3-827a-4044-952b-0f9153ed0ad6-160624051825/85/Climate-Risk-low-res-93-320.jpg)
![92 Climate Risks, Regional Integration and Sustainability in the Mekong Region
public actors that construct markets have socially minimalist goals
…. Replacing these ‘minimalist markets’ with ones whose rules take
livability into account is at the core of any quest for more livable cities.
The degree to which such urban and regional sustainability challenges
can be met depends, to an important extent, on the quality of urban
governance, regardless of the level of overall economic development (Ooi
2007). Democratized urban decision-making cannot be separated from
wider factors, including literacy, political rights, and civil liberties. Public
pressure, lobbying, and political competition are all important factors,
beyond economic growth alone, that determine how environmental
burdens are addressed and apportioned, and whether sustainability and
livable cities will be created (McGranahan 2007).
Conclusion: Towards sustainable urbanization
Throughout the Mekong region, the process of urbanization will continue
for the foreseeable future. If the region’s expanding urban areas are the
engines of its economic growth, they unfortunately remain at present dirty
and inefficient. Living conditions for the majority of the urban poor are
difficult; they often suffer poor quality housing, land tenure insecurity,
a lack of basic services, and unavoidably encounter a locally degraded
environment that places health at risk and reinforces poverty. There is
also, however, a growing urban consumer class who have benefited from
the economic growth that urban areas bring, and who enjoy more of the
amenities urbanism may offer; as they are able to afford access to basic
services, they are largely buffered from direct local environmental impacts.
And yet through higher levels of consumption, they are creating growing
ecological footprints that threaten long-term sustainable development.
These environmental and social challenges are produced and reproduced
by both the major decisions and small everyday decisions of business,
politicians and people—for example, how people travel to work, where
and how they shop, and how much waste is recycled (Haughton and
McGranahan 2006).
Ensuring that urbanization and urban lifestyles are sustainable is a
central challenge to ensuring sustainability in the wider Mekong region.
Urban areas and their hinterlands are connected through flows of goods,
services, investment, finance, people, and knowledge. Haughton (1999:
234) writes “[A] sustainable city cannot be achieved purely in internal](https://image.slidesharecdn.com/a0f6efb3-827a-4044-952b-0f9153ed0ad6-160624051825/85/Climate-Risk-low-res-104-320.jpg)

![100 Climate Risks, Regional Integration and Sustainability in the Mekong Region
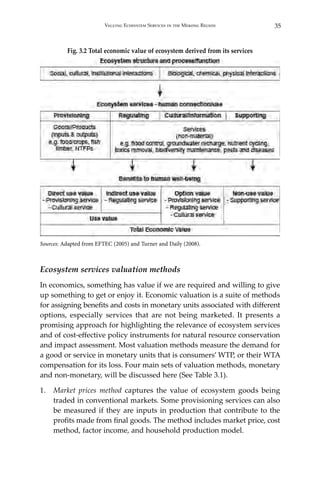
Data collection techniques
Approximately 240 households in each province were surveyed.
The villages selected for survey were based on suggestions by local
authorities (during an inception workshop), and representatives of the
areas vulnerable to floods in these provinces. Interviews were conducted
by field staff from two universities (Cantho University and the Royal
University of Phnom Penh) and by local partners. Household surveys
consisted of five sections: demographic information, livelihood assets,
flood situations and impacts, resilience and adaptive capacity measures,
and policy interventions. Key informant interviews were conducted
with 20 staff at district and provincial levels working in the field of flood
protection and mitigation. We also conducted 10 focus group discussions
in each country with each group including 7–10 household heads from
different social groups.
Constructing the LVI
Using the SLF, the vulnerability context is a major determinant of the
sustainability of livelihood assets as it directly influences livelihood
strategies, institutional processes, and livelihood outcomes of communities
(Chambers and Conway 1992; DFID 2000). The level of vulnerability under
the impact of extreme floods and climate variability in both countries
was calculated by applying the LVI. Indicators, or sub-components, of
community vulnerability to flood impacts are grouped into 10 major
components (Table 6.1). These components are classified under five
different livelihood assets of households (HHs) in the SLF. Each major
component includes several indicators or sub-components developed
based on available data collected through household surveys on flood
impacts in An Giang and Kandal provinces (Table 6.1).
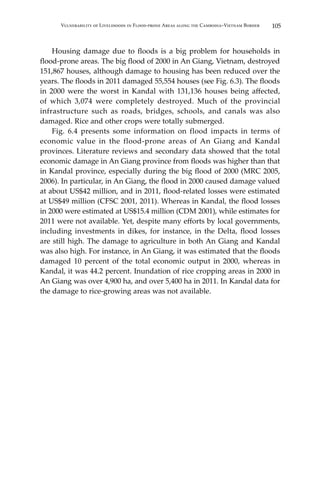
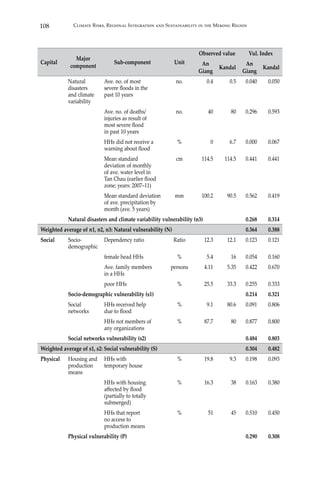
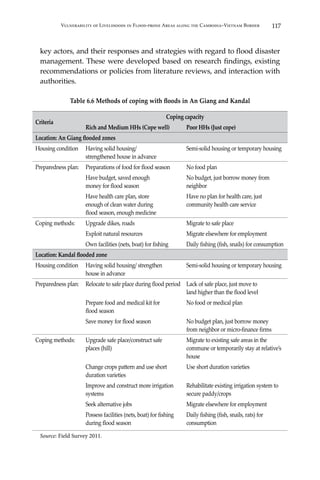
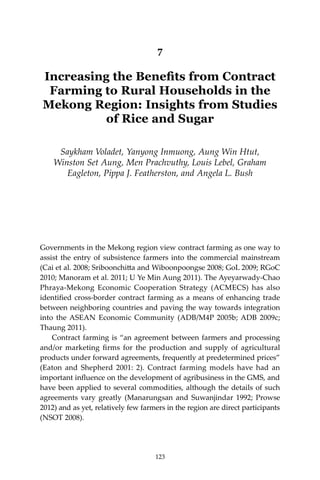
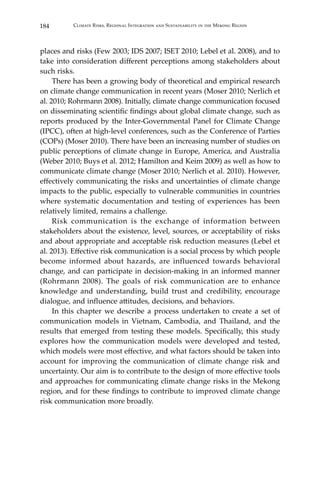
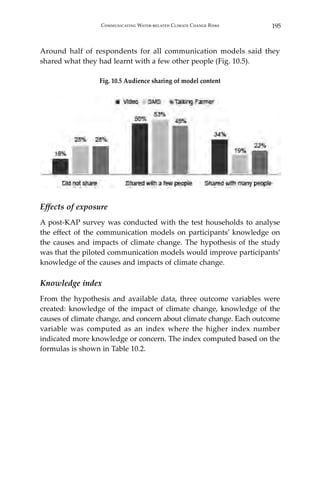
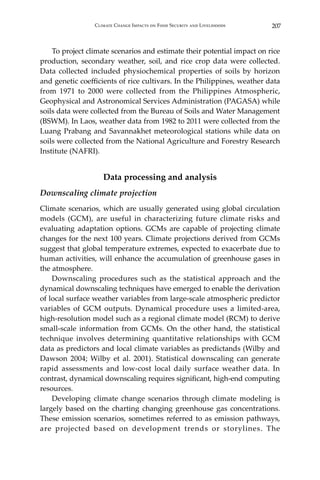
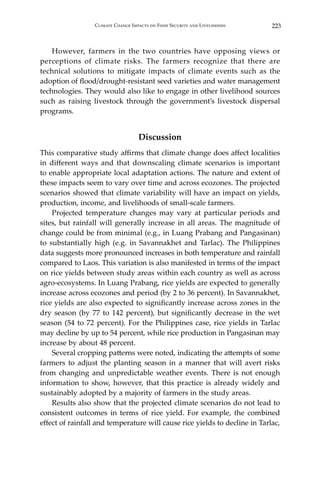
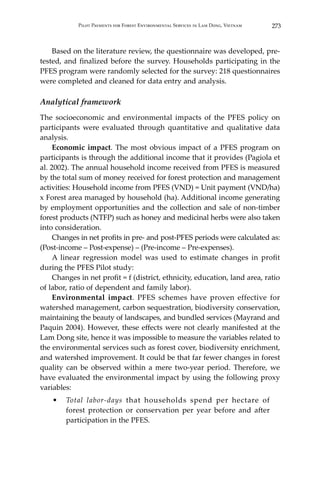
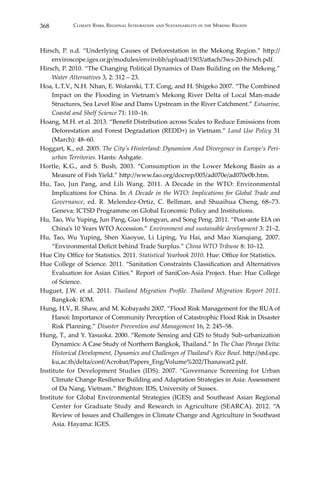
Table 6.1 Livelihood vulnerability index (LVI): Types of capital and components
Capital Major component Sub-component/ Indicator
Human Health HHs with family member with illness (%)
HHs with family member ill due to floods (%)
Livelihood strategy Ave. agri. livelihood diversification [1/
(no. of agri. livelihood activities + 1)]
HHs dependent on agri. as major
source of income (%)](https://image.slidesharecdn.com/a0f6efb3-827a-4044-952b-0f9153ed0ad6-160624051825/85/Climate-Risk-low-res-112-320.jpg)
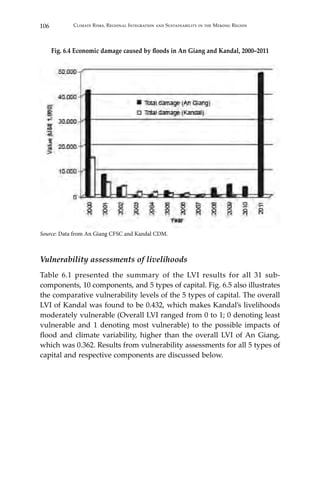
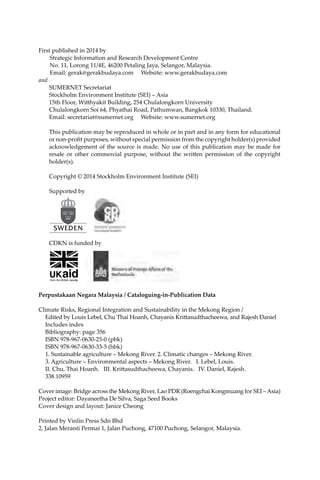
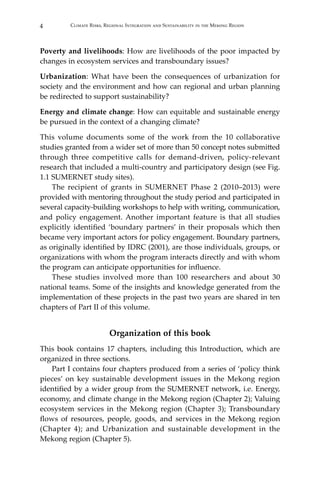
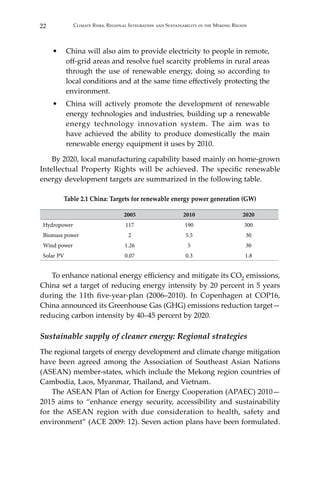
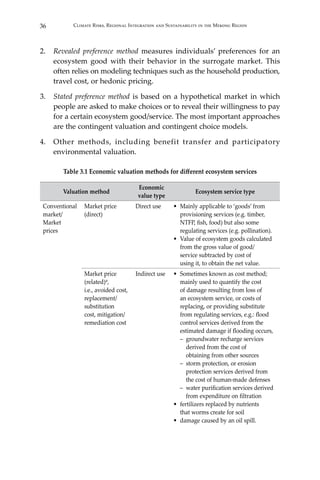
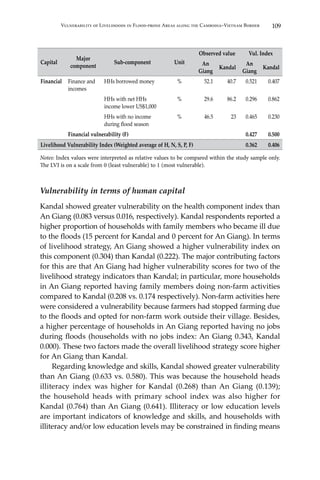
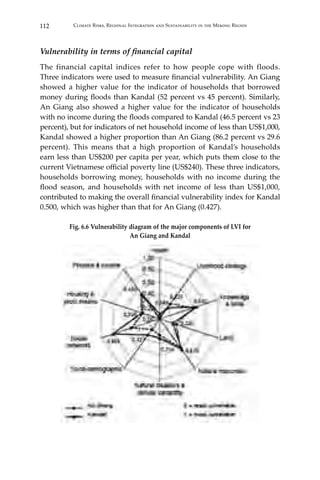
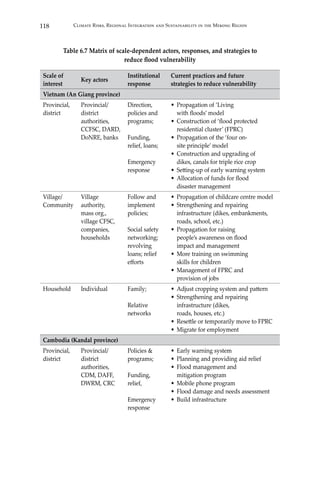
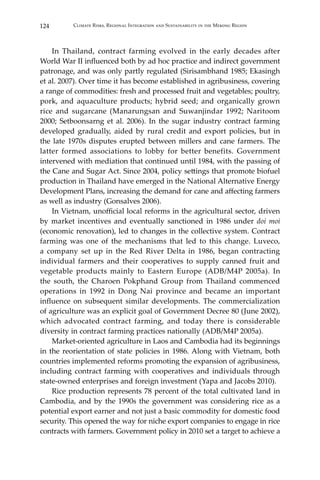
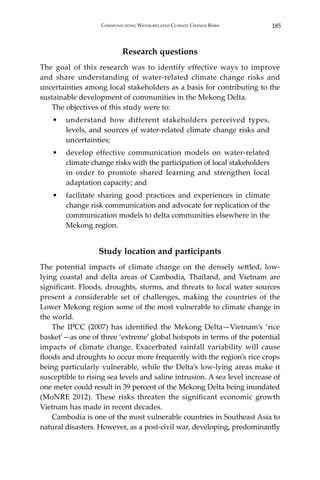
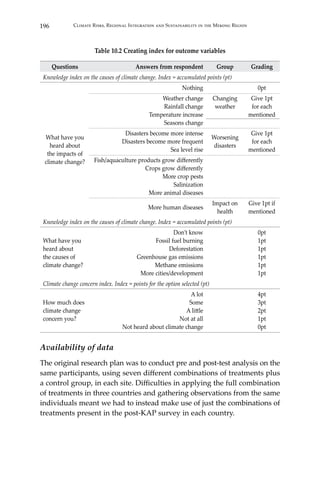
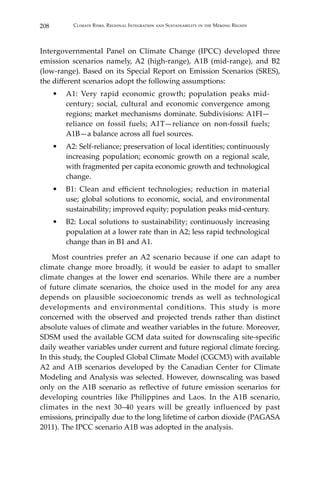
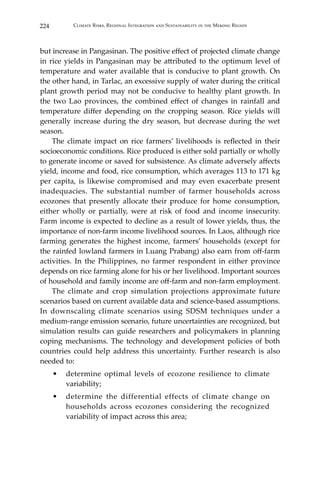
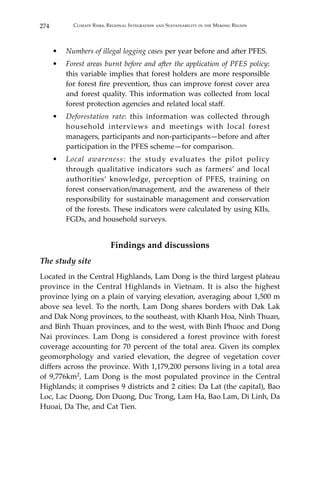
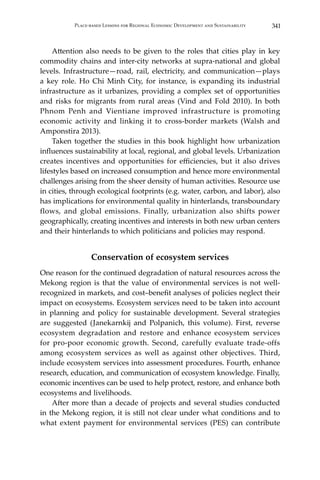
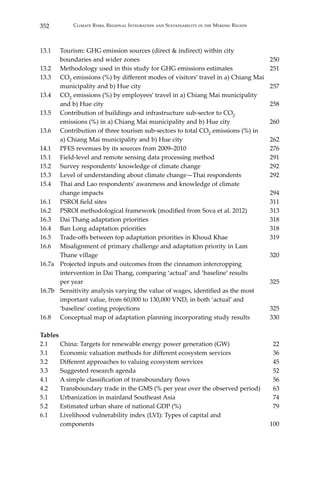
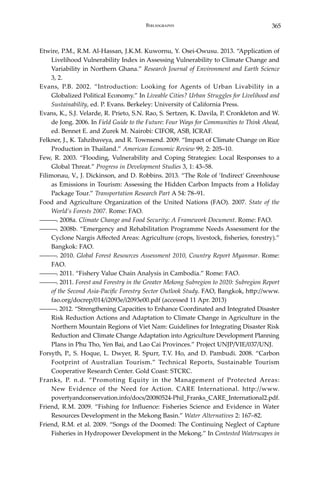
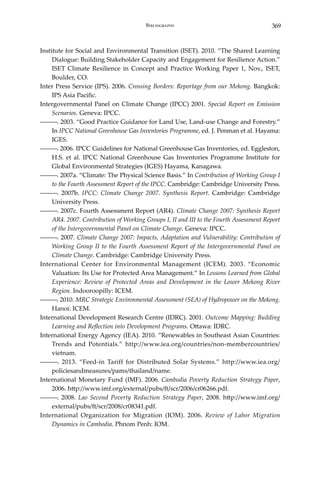
![107Vulnerability of Livelihoods in Flood-prone Areas along the Cambodia–Vietnam Border
Table 6.2 Summary LVI results for all types of capital and components,
An Giang and Kandal
Capital
Major
component
Sub-component Unit
Observed value Vul. Index
An
Giang
Kandal
An
Giang
Kandal
Human Health HHs with family
member with illness
% 3.1 1.5 0.031 0.015
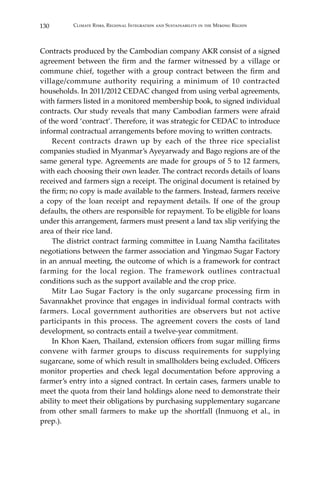
HHs with family
member ill due to floods
0 15 0.000 0.150
Health vulnerability (h1) 0.016 0.083
Livelihood
strategy
Ave. agri. livelihood
diversification [1/
(number of agri..
livelihood activities + 1)]
1/# crops 0.25 0.25 0.063 0.063
HHs dependent
on agri. as major
source of income
% 60.2 65.3 0.602 0.653
HHs with family
member doing non-
farm activities
% 20.8 17.4 0.208 0.174
HHs with no jobs
(during flood season)
% 34.3 0 0.343 0.000
Livelihood strategy vulnerability (h2) 0.304 0.222
Knowledge
& skills
HHs head unlettered % 13.9 26.8 0.139 0.268
HHs head just passed
primary school
% 64.1 76.4 0.641 0.764
HHs head no training
to cope with flood
% 95.9 86.7 0.959 0.867
Knowledge & skills vulnerability (h3) 0.580 0.633
Weighted average of h1, h2, h3: Human vulnerability (H) 0.327 0.309
Natural Land HHs who are landless % 33.2 26.9 0.332 0.269
HHs with small
land (0.1-0.5 ha)
% 23.9 18.7 0.239 0.187
Land vulnerability (n1) 0.286 0.228
Natural
resources
HHs that not cultivate
the 3rd crop
% 98.2 98 0.982 0.980
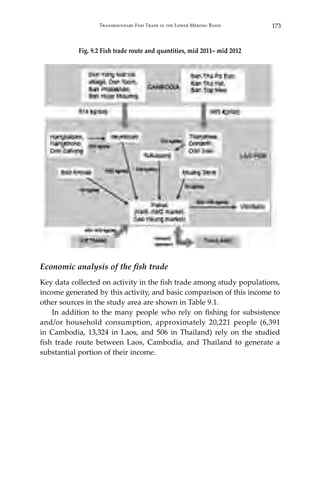
HHs that depend
on (exploit) natural
resources
% 40.9 50.7 0.409 0.507
HHs that depend on
fishing during flood
% 33.9 37 0.339 0.370
Natural resources vulnerability (n2) 0.577 0.619](https://image.slidesharecdn.com/a0f6efb3-827a-4044-952b-0f9153ed0ad6-160624051825/85/Climate-Risk-low-res-119-320.jpg)
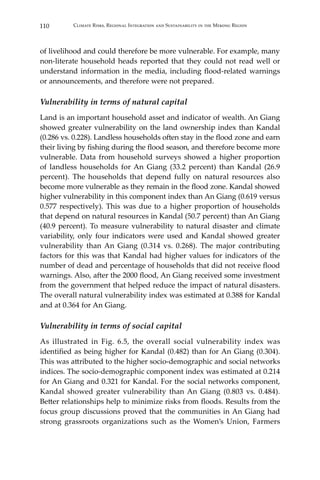
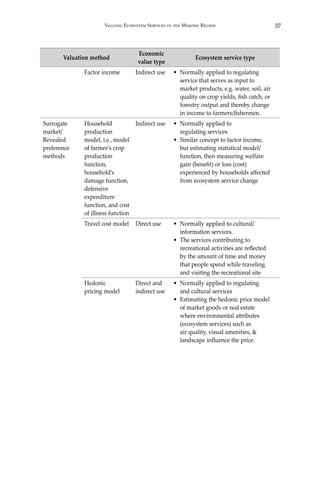
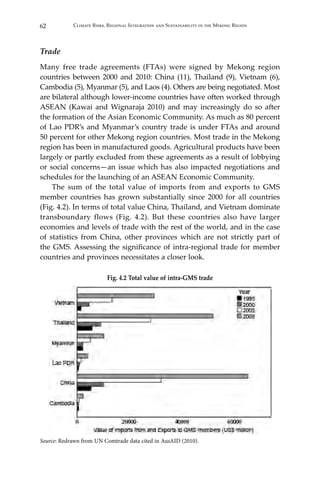
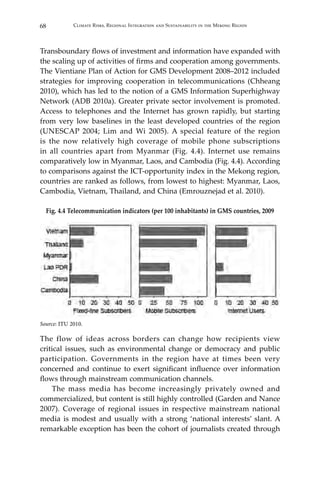
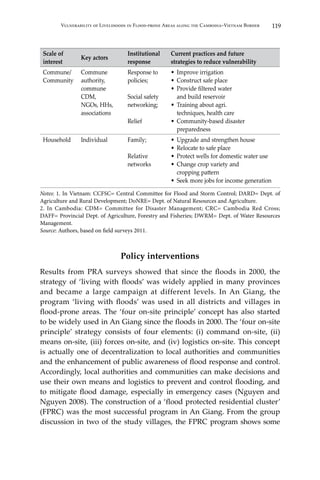
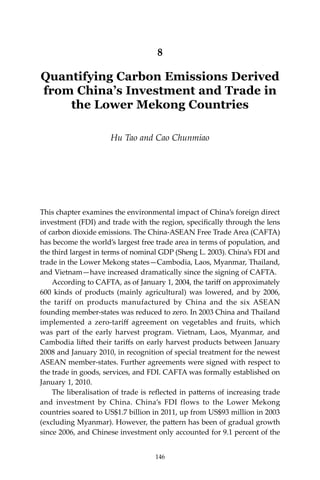
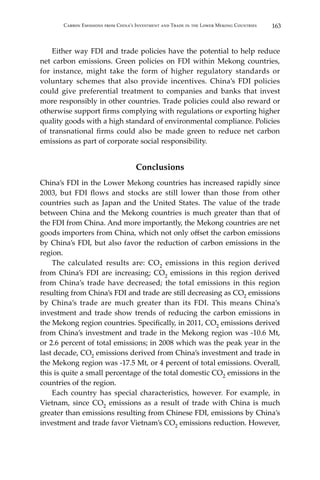
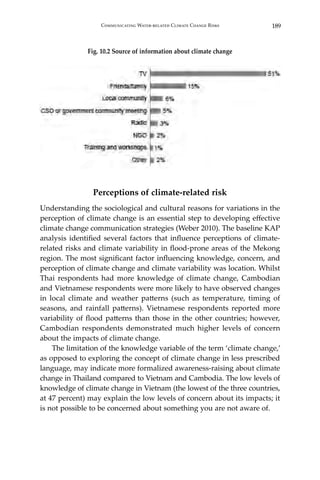
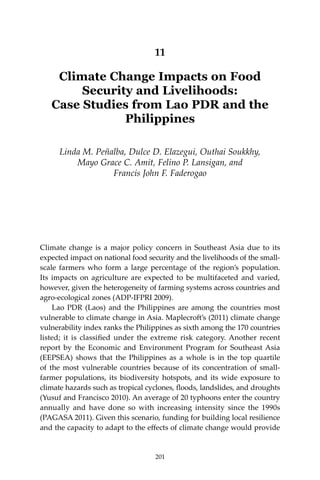
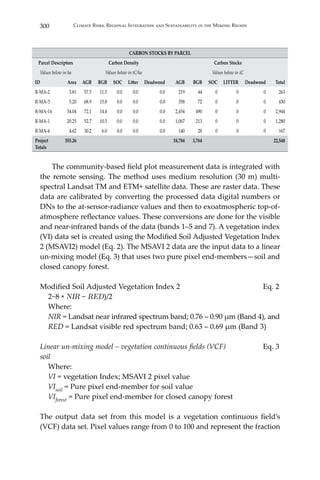
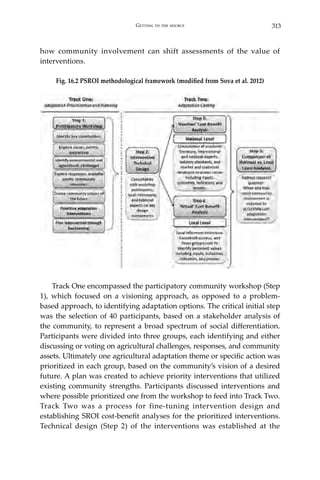
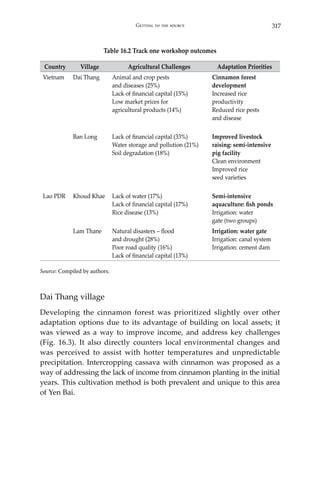
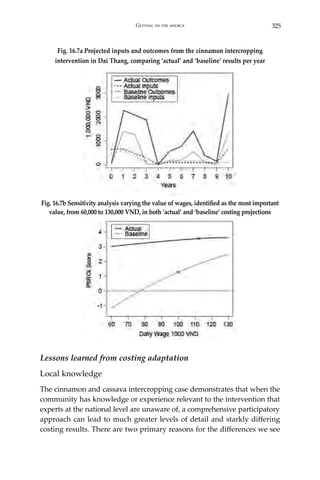
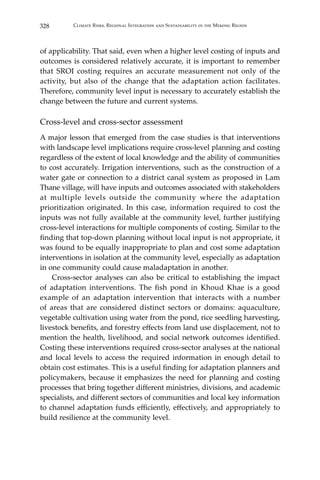
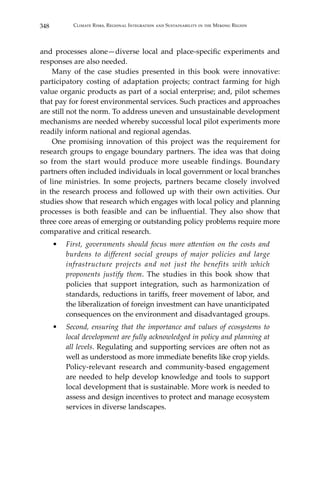
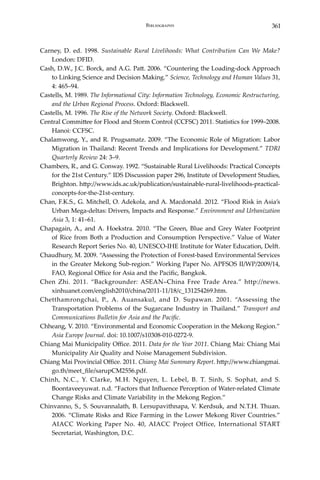
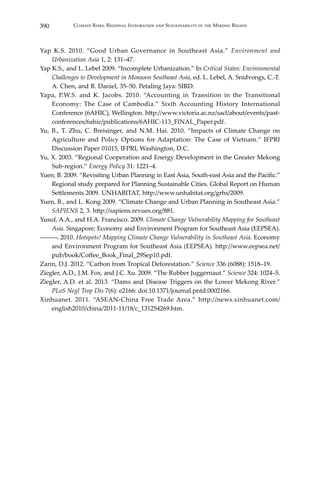
![113Vulnerability of Livelihoods in Flood-prone Areas along the Cambodia–Vietnam Border
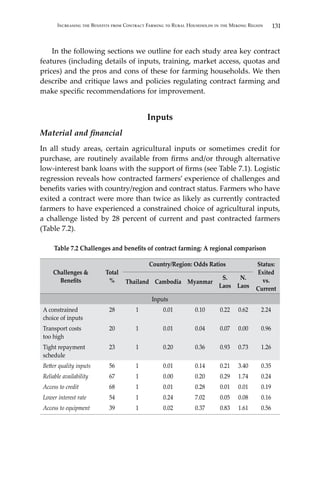
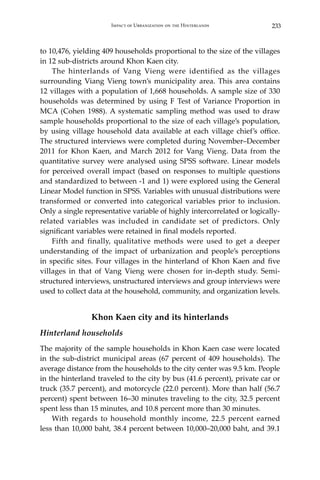
As a whole, Fig. 6.6 serves as a summary figure for all types of
vulnerabilities and the differences in vulnerability indices between the two
provinces. Kandal appears to show a higher vulnerability than An Giang
in terms of social networks, natural resources, knowledge, and skills, and
finance and income indices. All these factors indicate people’s capacity
to cope with floods; they should be taken into account when framing
strategies to reduce vulnerability to floods.
When examining LVI values for different social groups, it was apparent
that the economically poor groups were most affected by floods and the
better-off group was the least for both An Giang and Kandal (Table 6.3).
This can be explained by the better-off group experiencing outmigration,
having jobs and higher levels of knowledge and skills, while the poorer
households face financial deficits, are mostly landless, have less access to
production means, and possess lower quality physical capital (housing)
that is also more prone to damage by floods.
Table 6.3 Flood effect indicator values by household capital and social groups in
An Giang (AG) and Kandal (KD)
Household
assets
Effect index for social groups in AG Effect index for social groups in KD
Better-off Medium Poor Better-off Medium Poor
Human 0.275 0.327 0.329 0.370 0.381 0.407
Natural 0.348 0.364 0.365 0.376 0.388 0.424
Social 0.247 0.304 0.310 0.466 0.482 0.514
Physical 0.277 0.290 0.299 0.308 0.308 0.345
Financial 0.373 0.427 0.490 0.417 0.500 0.534
Overall
effect index
0.320 0.362 0.371 0.413 0.423 0.466
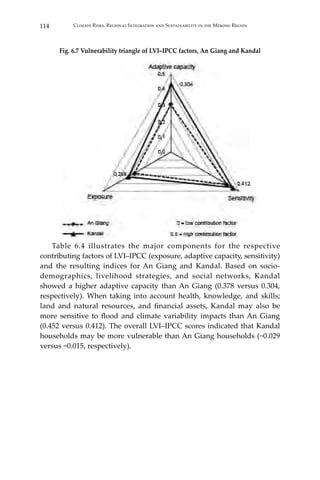
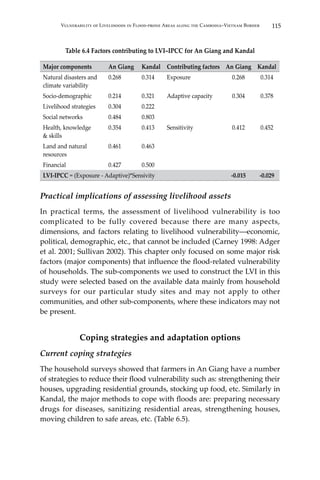
LVI-IPCC: An Giang versus Kandal
Using similar indicators, the LVI-IPCC analysis yielded consistent results
(LVI-IPCC: An Giang −0.015, Kandal −0.029) (Table 6.4). Fig. 6.7 shows
a vulnerability triangle, which plots the contributing factor scores for
exposure, adaptive capacity, and sensitivity [with the function LVI-IPCC
= (Exposure − Adaptive capacity) x Sensitivity]. The triangle indicates
that Kandal may be more exposed (0.314) to flood and climate variability
impacts than An Giang (0.268).](https://image.slidesharecdn.com/a0f6efb3-827a-4044-952b-0f9153ed0ad6-160624051825/85/Climate-Risk-low-res-125-320.jpg)
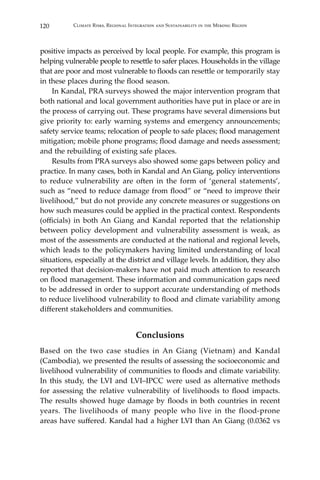
![180 Climate Risks, Regional Integration and Sustainability in the Mekong Region
Laos
The Lao research team recommends that the following steps be taken
by national and provincial government agencies in order to ensure the
continuing abundance of fish in the Lower Mekong Basin:
• The Lao research team strongly recommends that the new
Fisheries Law be implemented immediately, as their first and
foremost policy recommendation.
• Enforce the 2009 Lao Fishery Law through an implementation
decree to make it effective.
• Add articles related to the size of fish, amount of fish traded
per year per species, fishing gear specification, and number of
fishing gear permitted.
• Enforce existing fish conservation zones, and create additional
conservation zones monitored by the district officials.
• Involve the Ministry of Industry and Trade and the Ministry
of Natural Resources and Environment in overseeing the
fish trade, in addition to the Department of Fisheries from
the Ministry of Agriculture and Forestry. These ministries
should oversee the economic aspects of the fish trade, as the
Department of Fisheries focuses largely on ecological issues.
Greater coordination between these three ministries will ensure
that management decisions made by any one Ministry will be
informed by the knowledge and expertise of the other two.
Article 8 of the 2009 Fishery Law of Lao PDR states, “The Government
promotes cooperation with different countries [within] the region and
with international organizations in the work of fisheries through the
exchange of lessons, information, science, technology [and] upgrading
of the technical staff [and in] participation in and implementation of
those Agreements and International Conventions to which Lao PDR
is a party.” Accordingly, the results of this study reiterate the need for
the Government of Lao PDR to cooperate with the governments of
Cambodia and Thailand, and consult these governments and international
organizations on issues regarding shared fisheries resources.](https://image.slidesharecdn.com/a0f6efb3-827a-4044-952b-0f9153ed0ad6-160624051825/85/Climate-Risk-low-res-192-320.jpg)
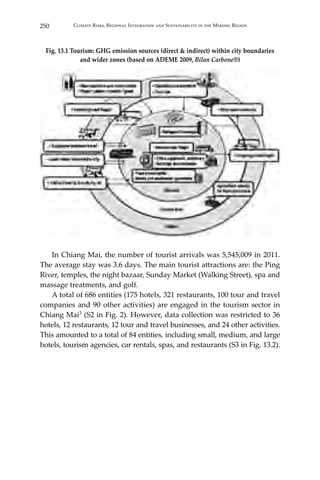
![254 Climate Risks, Regional Integration and Sustainability in the Mekong Region
• International visitors (1,864,817) to Chiang Mai were assumed
to either fly from Bangkok or to Chiang Mai. Similarly, foreign
visitors (702,000) flew from Hanoi, Ho Chi Minh City, or
Danang, and then travelled to Hue.
Box 13.1 Basis for assumptions
The assumptions used for the analysis are based on the following considerations:
If, no. of tourists in the year 2011 = T; no. of stay days per tourist = S; no. of local
people = P; no. of meals consumed per day per visitor at restaurants in the city
boundary = Fv; no. of meals consumed per day per local person at restaurants
in the city boundary = Fl; no. of days local people visit restaurants per year = DR;
and no. of days local people used fossil fuel for public transportation = DT, then
The ratio of ‘meals consumption’ per year by the visitors at the restaurants
was calculated by using the following equation, and converted into percentage:
(T x S x Fv) / [(P x DR x Fl) + (T x S x Fv)]
equation 1
The ratio of ‘fossil fuel used for public transport’ per year by the visitors was
calculated by using the following equation, and converted into percentage:
(T x S) / [(P x DT) + (T x S)]
equation 2
The ratio of ‘infrastructure and services’ used per year by the visitors was
calculated by using following equation, and converted into percentage:
(T x S) / [(P x 365 days) + (T x S)]
equation 3
The values for T were obtained from Chiang Mai municipality and Thua Thien
Hue Provincial Department of Culture, Sports and Tourism, while values for
S and P were obtained from the published literature (Chiang Mai Provincial
Office 2011; Hue City Office for Statistics 2011). The values for Fv, Fl, DR and DT
were based on a survey and from discussions with the city authorities.
City T S P a Fv Fl DR b DT
Chiang Mai municipality 5,545,009 3.6 137,793 2 1 124 62
Hue City 1,590,900 2 339,000 2 1 128 117
Notes:
a Some visitors just came for a day in Hue city (had lunch) and went to other cities (for dinner) later.
b The majority of local people (in general all Chiang Mai municipality people) used their own vehicle
to travel within the municipality.](https://image.slidesharecdn.com/a0f6efb3-827a-4044-952b-0f9153ed0ad6-160624051825/85/Climate-Risk-low-res-266-320.jpg)
![307Community-based Carbon Measurement and Monitoring in REDD+ MRV systems
REDD+ may marginalize local people, hinder their access and rights to
forests and forest resources, and negatively impact local livelihoods. These
are legitimate concerns, even in light of discussions about safeguards
working to ensure “the full and effective participation of relevant
stakeholders, in particular indigenous peoples and local communities”
(UNFCCC CP 16 2010). For a review of these concerns see Ribot and
Larson (2012), who argue that, “[t]o make forestry policy emancipatory,
strong social protections or safeguards are still needed that require REDD
and other interventions to support and work through local democratic
institutions.”
This SUMERNET project does not focus on analyzing the various
forest policies and implementation of these policies in the three countries
that can indeed impact how local people benefit or are marginalized in
such activities as REDD+. Rather, the research team targeted the practical
implementation of engaging communities in the tasks of measuring
biomass in forested areas and the collection of field data that could be
integrated with satellite remote and GIS analysis in a REDD+ MRV system.
The lessons learned from a comparative point-of-view provide insights
into the differences and similarities between (1) each country’s set of
stakeholders or participants, (2) the local communities themselves, and
(3) national aspects of governance, culture, and history.
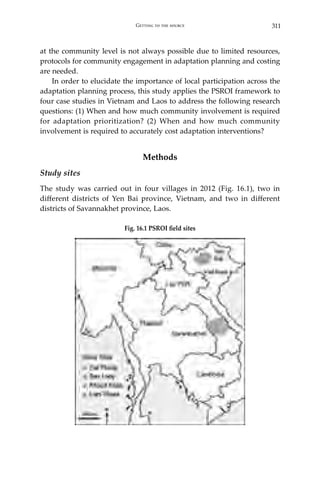
We recognize that there is no one-size-fits-all recipe to ensure
community participation in measuring and monitoring forest biomass for
REDD+. Each community is different. In the three case study areas in Laos,
Thailand, and Vietnam, there are differing levels of community cohesion,
tenure and forest access rights, and relationships with local agencies,
infrastructural development, knowledge of climate change, all embedded
in different governance structures and cultural traditions and histories.
There are, however, a number of common, general key elements to remain
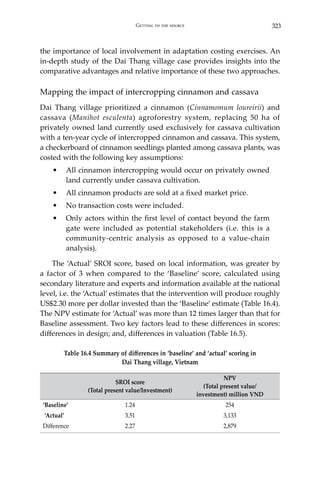
cognizant of when trying to engage local communities in REDD+ (these
are noted above in some detail in the discussion section).
Community-participation in any collaborative activity that includes
multiple stakeholders is only half or one side of a project. Equally
important are the roles of the other stakeholders (local government agency
staff, university or NGO staff, who also might be involved; even national
agency supervisors and directors who often set the agenda for local
agency staff). The importance of the relationships between stakeholders
or project participants cannot be over-emphasized. Social capital between
community members and between local agency staff and communities is](https://image.slidesharecdn.com/a0f6efb3-827a-4044-952b-0f9153ed0ad6-160624051825/85/Climate-Risk-low-res-319-320.jpg)


![379Bibliography
Park, N.-W. 2005. “Underground Economy: Causes and Size.” Presentation to Korean
Institute of Public Finance.
Parnwell, M., and L. Wongsuphasawat. 1997. “Between the Global and the Local:
Extended Metropolitanisation and Industrial Location Decision Making in
Thailand.” Third World Planning Review 19, 2: 119–38.
PEI-Lao PDR. 2011. “Assessment of Economic, Social and Environmental Costs and
Benefits of Mitr Lao Sugar Plantation and Factory: Case Study in Savannakhet
Province.” Vientiane: IUCN Lao PDR and National Economic Research Institute
(NERI), Ministry of Planning and Investment of Lao PDR. http://www.unpei.org/
sites/default/files/dmdocuments/SVK%20Sugarcane%20Report_Final%20Apr%20
2011.pdf.
Peñalba, L.M. et al. 2012. “Climate Change Implications to Food Security and Livelihood
of Small-Scale farmers.” Center for Strategic Planning and Policy Studies, College of
Public Affairs and Development, University of the Philippines Los Baños.
Perez, R.T., L.A. Amadore, and R.B. Feir. 1999. “Climate Change Impacts And
Responses in The Philippines Coastal Sector.” Climate Research 2: 97–107.
Pham K.N., and Tran V.H.S. n.d. “Recreational Value of the Coral Surrounding the Hon
Mun Islands in Vietnam: A Travel Cost and Contingent Valuation.” In Economic
Valuation and Policy Priorities for Sustainable Management of Coral Reefs, ed. M.
Ahmed, Chiew K.C., and H. Cesar. Penang: WorldFish Center.
Philippines Atmospheric, Geophysical and Astronomical Services Administration
(PAGASA). 2011. Climate Change in the Philippines. Funded under the MDGF-
1656 “Strenghthening the Philippines Institutional Capacity to Adapt to Climate
Change.” Manila: PAGASA.
Pholphirul, P., and P. Rukumnuaykit. 2010. “Economic Contribution of Migrant Workers
to Thailand.” International Migration 48: 174–202.
Pholsena, V., and R. Banomyong. 2006. Laos: From Buffer State to Crossroads? Chiang
Mai: Mekong Press.
Phongpaichit, P., and P. Benyaapikul. 2013. “Political Economy Dimension of a Middle
Income Trap: Challenges and Opportunities for Policy Reform: Thailand.” Bangkok:
Faculty of Economics, Chulalongkorn University.
Phonvisay, A., and S. Bush. 2001. “Baseline Study of Fish Trade from the Siphandone
Fishery, Champassak Province.” Living Aquatic Resources Research Centre
(LARReC) Research Paper No. 4, LARReC, Vientiane.
Plungsricharoensuk, P. 2009. “Male Transnational Labour Returnees and Contested
Meanings of ‘khon pai klai’” [in Thai]. Social Science Journal of the Faculty of Social
Sciences, Chiang Mai University 21: 59–100.
Pollution Control Department (PCD). 2002. Domestic Wastewater and Treatment Systems.
Bangkok: PCD.
Poncet, S. 2006. “Economic Integration of Yunnan with the Greater Mekong Subregion.”
Asian Economic Journal 20: 303–17.
Pongyelar, S. 2007. “Thailand’s Foreign Policy-making towards Myanmar since 1988:
The Reflection from the Business Sector’s Roles.” Kasetsart J. Soc. Sci. 28: 127–40.](https://image.slidesharecdn.com/a0f6efb3-827a-4044-952b-0f9153ed0ad6-160624051825/85/Climate-Risk-low-res-391-320.jpg)


This document is an introduction to a book that discusses climate risks, regional integration, and sustainability in the Mekong region. It provides background on the publisher, the Strategic Information and Research Development Centre (SIRD), which focuses on Southeast Asian studies. The book was edited by Louis Lebel, Chu Thai Hoanh, Chayanis Krittasudthacheewa, and Rajesh Daniel. It contains 16 chapters that report on collaborative research projects in the Mekong region related to climate risks, regional integration, and sustainability. The research was supported by organizations such as the Swedish and UK governments, Netherlands Directorate for International Cooperation, and Climate and Development Knowledge Network.


