1. Clifton Star Resources Inc.
Metals & Mining March 9, 2009
TSX-V: CFO C$2.10
Frankfurt Exchange: C3T €1.37
Recommendation: Speculative Buy
12-Month Target Price: C$5.35
RONALD WORTEL MBA, P.ENG.
Ron@mineralfields.com
(416) 306-5797
JONATHAN DWEK, ASSOCIATE ANALYST
jonathan@mineralfields.com
(416) 665-9339 x 252
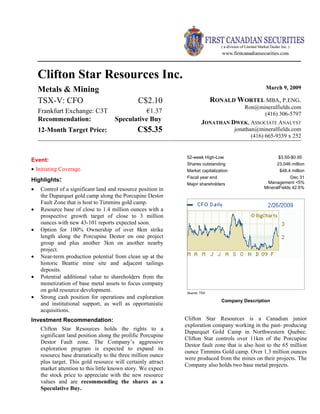
52-week High-Low $3.50-$0.95
Shares outstanding 23,046 million
Market capitalization $48.4 million
Fiscal year end Dec 31
Major shareholders Management <5%
MineralFields 42.6%
Source: TSX
Company Description
Clifton Star Resources is a Canadian junior
exploration company working in the past- producing
Duparquet Gold Camp in Northwestern Quebec.
Clifton Star controls over 11km of the Porcupine
Destor fault zone that is also host to the 65 million
ounce Timmins Gold camp. Over 1.3 million ounces
were produced from the mines on their projects. The
Company also holds two base metal projects.
Event:
• Initiating Coverage.
Highlights:
• Control of a significant land and resource position in
the Duparquet gold camp along the Porcupine Destor
Fault Zone that is host to Timmins gold camp.
• Resource base of close to 1.4 million ounces with a
prospective growth target of close to 3 million
ounces with new 43-101 reports expected soon.
• Option for 100% Ownership of over 8km strike
length along the Porcupine Destor on one project
group and plus another 3km on another nearby
project.
• Near-term production potential from clean up at the
historic Beattie mine site and adjacent tailings
deposits.
• Potential additional value to shareholders from the
monetization of base metal assets to focus company
on gold resource development.
• Strong cash position for operations and exploration
and institutional support, as well as opportunistic
acquisitions.
Investment Recommendation:
Clifton Star Resources holds the rights to a
significant land position along the prolific Porcupine
Destor Fault zone. The Company’s aggressive
exploration program is expected to expand its
resource base dramatically to the three million ounce
plus target. This gold resource will certainly attract
market attention to this little known story. We expect
the stock price to appreciate with the new resource
values and are recommending the shares as a
Speculative Buy.
2. Clifton Star Resources March 2009
Ronald Wortel First Canadian Securities 2
The Company
Focused on a major
Canadian Gold Camp
Clifton Star is a Canadian junior mining exploration Company listed on the TSX-Venture
Exchange trading under the symbol CFO and Frankfurt under C3T. The exploration of its gold
assets in the Duparquet gold camp of NW Quebec remains the prime focus for the Company.
The management’s long term commitment to this past producing camp allowed the Company to
build a strategic and significant asset base along the prolific gold producing Porcupine-Destor
fault zone.
In past two years the Company completed significant actions that we expect to add
resources and value to the Company in 2009 including:
• Secured the ownership and 100% options on significant gold resources in NW Quebec;
• Raised $10.8 Million in funding and conducted exploration to confirm and expand
resources;
• Enlarged the property package to cover prospective geology and acquire adjacent
historical resources; and
• Conducted studies to define the value of the assets.
The plans for 2009 include the release of new and enlarged resource estimates for Beattie-
Donchester and Duquesne Projects; the economic and operational evaluation of mill clean up
and tailings reprocessing for gold recovery; continued drilling for resource expansion on all gold
projects – five drills turning on the projects currently; the commissioning of a scoping study for
target definition and project economics; the monetization of the value in the base metal projects;
building the board of directors to complement development of the assets; the renegotiation of
purchase agreements to reflect market conditions and allow for project advancement; and the
marketing of the Company to institutional clients in Toronto, New York, Europe and Middle
East to expand the shareholder base, improve liquidity and see that the value added to the
Company by these actions is reflected in the share price.
Projects
Clifton Star’s projects
are located 35km north
of the major Noranda
mining camp.
The Beattie, Donchester, Central Duparquet, Dumico and Duquesne projects lie along the
Porcupine-Destor Fault system where mineralization is associated with splay-faults offset or
paralleling the main system (see figure 1). Over 85 million ounces of gold have been produced
from similar occurrences associated with the Porcupine-Destor Fault between Timmins, Ontario
and Val D’or, Quebec with a majority lying along the northern contact.
In 2008 the Company accomplished the following:
• Drilled 69,117m on four gold projects (Beattie, Donchester, Dumico, Duquesne) at an
average direct cost of $122 per m;
• Added 887.0 ha on the Duquesne project through staking and acquisition;
• Bulk sample tested the mill and mine tailings;
• Optioned the Central Duparquet project with historic resources in excess of 90,000
ounces of gold and added 4000m of prospective strike along the intrusive contact;
• Transformed the Beattie mine site creating a working project site for exploration and
analysis.
3. Clifton Star Resources March 2009
Projects located along
one of the most
productive gold belts in
the world.
The ore body is
characterized by thick
widths allowing for bulk
mining
Figure 1: Location of the Clifton Star Projects along the Porcupine Destor Fault
Source: Company Reports
Beattie Mine Property
At the Beattie Mine approximately 9,257,321 tons averaging 0.124 oz/t gold (4.04 g/t gold)
were mined and milled on-site between 1933 and 1956 from the Beattie deposit. The main ore
body, along the north contact of the fault system and a syenite intrusion, was 352 metres in
length and mined down to a depth of 381 metres and to widths of up to 35 metres. The workings
exist to below 600 meters depth with projected 3,520 tons per vertical foot for the historic ore
body below the 9th level. A total of 928,000 oz of gold was mined from this deposit. The ore is
associated with the contact area of an ovoid-shaped syenite porphyry intrusive. Since 1987,
similar mineralized structures were traced for some 8400 meters strike length around this
structure. This exploration also located many other parallel gold-bearing zones associated with
fault structures within the intrusive body.
Generally the gold is found with pyrite (from hydrothermal fluid deposition within both
disseminations and fracture-fillings). Current drilling defined a series of easterly plunging zones
that are controlled by crosscutting fault structures and are offset to the north of the Porcupine-
Destor Fault.
During more recent drilling a new zone within the south contact intersected values of 11.89
g/t gold over a width of 11.05 metres. These grades are nearly three times historic mining
values. The project hosts a July 2008 compliant, hard rock resource of 638,859 oz.
Tailings from the past production of the site contain an additional 220,042 oz of gold of which
approximately 88.8% is estimated to be recoverable based on references presented by P. Bevan
Ronald Wortel First Canadian Securities 3
4. Clifton Star Resources March 2009
The Beattie -
Donchester Property
contains additional
exploration targets
along its 8+ km strike
length. These will see
work in the summer of
2009.
in the July 2008 43-101 report. Recent studies by CFO’s consultants, Genivar, suggest that site
reclamation from the mill complex clean up will yield additional gold for potential near term
recovery.
Donchester Mine Property
At the Donchester Mine approximately 1,350,000 tons averaging 0.136 oz/ton (4.35 g/t gold)
was mined between 1946 and 1956 and processed at the Beattie mill located less than 2km to the
west. The mines are connected on two levels of the underground workings. The main ore body,
developed over a strike length of approximately 1000 metres down to a depth of 381 metres, lies
along the southern contact of the same syenite porphyry as the Beattie deposit. (see figure 3)
A total of 1,116,869 oz of gold and 260,000 oz of silver was mined from the both the Beattie
and Donchester mines from 10,714,871 tons processed. Recoveries averaged 83.82%.
Figure 2: Beattie – Donchester Location Map
Source: Company Reports
Exploration on the Beattie–Donchester projects is advancing exploration along 3 zones, North,
South, and RW covering over 8000m of strike along the contact of the intrusive. The North
Zone is drill delineate for 2,200m of strike length and remains open. The RW Zone is drill
delineated for 700 m and open, and South Zone for 2,250 m and remains open ended. There
remains over 4100m of strike/contact still open on both North and South zones to test on the
property. The recent drilling uncovered several areas with extraordinary width of 134.10 m
grading 2.91 g/t; results such as these were not recorded in the historic drilling on the
projects. Four such “blow out” zones are now identified along the contact area tested so far by
Clifton Star. Currently the best assay and intercept results are coming from the South Zone
between the Beattie and Donchester mines, in an area never before mined or explored. The
extensive drilling and extent of the zones is shown on Figure 3 along with the main intercepts on
each hole.
Ronald Wortel First Canadian Securities 4
5. Clifton Star Resources March 2009
Figure 3: Drill hole and Zone Locations of the Beattie-Donchester Projects
Source: Company Reports
Ronald Wortel First Canadian Securities 5
6. Clifton Star Resources March 2009
Figure 4: Drill hole and Zone Locations of the Central Duparquet and Dumico Projects
Source: Company Reports
(original: http://www.cliftonstarresources.com/CrossSections/BeattieDonchester-DDH-Plan.PDF)
Ronald Wortel First Canadian Securities 6
7. Clifton Star Resources March 2009
Ronald Wortel First Canadian Securities 7
Added 4,000m of strike
length
New resource value
coming Q2 2009
Dumico Mine Property
The Dumico was a small past producer with approximately 7,100 tons averaging 3.20 g/t gold
mined up to 1944. This zone to the east of the Beattie – Donchester was discovered when a drill
hole in 1933 (DH33-55) returned 69.94 g/t Au over width of 1.53 meters (see figure 4). The
mineralized unit consists of silicified syenite porphyry and lies along the same fault structure as
the Donchester Mine on the south side of the same syenite porphyry intrusive. Historic
metallurgical studies indicate recoveries of 90% by flotation and 92% by cyanidation for the
rock mined at this location. Two shafts were sunk, one to 305 metres depth, and the zones traced
for some 700 metres strike length by 84 drill holes. Historic and recent drilling indicates that the
average grades are approximately 10.70 g/t (ranging 3.73 to 21.46 g/t gold) over a width of
approximately 2.3 metres. Minor molybdenite and silver are associated with the gold bearing
zones on the Dumico project.
Central Duparquet Mine Property
The Central Duparquet is a new land acquisition in the camp between the Donchester and
Dumico mines and extends east of the Dumico property. The claims encompass 293 ha of land
and 4000m of prospective strike/contact. An historic resource of 567,000 t at 5.11 g/t for over
93,000 ounces from over 33,000m of drilling in 283 holes remains to be confirmed and
expanded by drilling in 2009. The remaining land is largely unexplored. The surface rights to
this property are held though Clifton Stars’ option on the Dumico land holding.
Duquesne Mine Property
The Duquesne Mine is held 100% by Clifton Star and is located several km to the east of the
Duparquet land package and along the Porcupine Destor Fault zone. At the Duquesne mine
193,095 tonnes of ore averaging 10.81 g/t were produced from 1946 to 1952 and 1988 to 1992
totaling 67,100 ounces of gold. The area of the historic mine workings is approximately 200
metres width and to 381 metres depth.
Since 2007, Clifton Star drilled some 55 drill holes over west extensions and to depth outlining
four parallel gold-bearing veins, three of which are the same as those previously mined. The
veins were extended for some 1,250 meters laterally and down to depths of 932 metres vertically
by recent drilling on 50 to 100 metre centres. Metallurgical studies show the gold is 96%
recoverable through cyanidation and flotation methods.
The gold-mineralized zones occur within fault related structures lying between the footwall of a
gabbro intrusive and the hanging wall of an ultramafic unit. The mineralized zone lies
immediately north of the Porcupine-Destor Fault and appears to parallel the main fault. Vein 10
and Vein 20 are the most promising gold-bearing systems with a third, Vein 74, associated with
the north contact of the Porcupine Destor Fault. The property covers over 3,000m of
favourable strike length along this gold bearing deformation zone.
A mineral resource estimate by P. Bevan (all categories and using Kilborn Engineering, AMS,
and several other independent estimates) indicates some 1,859,052 tonnes averaging 7.58 g/t Au
(453,115 oz gold). Approximately one-half of the assay results from the present drill program
are being awaited a new and significantly larger resource is expected in Q2 2009.
Two properties immediately to the west of the Duquesne property, the Globex Duquesne West
and the Normabec Pitt, are encountering similar grades and structures associated with
mineralized systems immediately north of the Porcupine-Destor Fault. Grades and tonnages
from both properties are published. To the east of the Duquesne property, Radisson Mining
recently worked on their adjacent Destor project that is host to two known gold zones. Results
from this drilling were not encouraging and Radisson could be looking to option this project.
8. Clifton Star Resources March 2009
Ronald Wortel First Canadian Securities 8
Clifton Star’s base
metal projects are not
core assets and could
be sold or spun out to
provide value to the
Company and
shareholders
Copper Mine
Copper and Nickel
Mine
Management secured a
100% option with no
NSR on five properties
Base Metal Projects
Hunter Mine Property
The Hunter Mine lies less than 10km to the northeast of the Beattie – Donchester mine properties
and is road accessible. The mineralized zones occur along the contacts between felsic volcanic tuffs
and rhyolites; at least 3 parallel structures have been observed. Some 391,000 tons averaging 1.09%
copper was mined up until 1957. A total of 329,000 tons of historic resources at the same grade
exists down to the 4th level. The shaft was developed on the 2nd, 3rd and 4th levels. There are zinc
and silver associated with the copper zones but grades are not reported. The Company is in talks
with previous owners to acquire these records and those of the neighbouring properties.
The Lyndhurst (Globex) property is in line of strike and immediately east of the Hunter Property.
An open-pit operation for silver and silica is presently being undertaken on the Lyndhurst property.
Cat Lake Mine Property
The Cat Lake Mine property consists of mining leases located northeast of Winnipeg and along the
border between Manitoba and Ontario. Roads access to the site is maintained and rail is located
within 50 miles of the site.
During the past mining operation ore was stockpiled from four levels up until 1957. A 1,000-t/day
concentrator was installed on the property but never operational at time of closing in 1957. This
asset is no longer on the property. The ore body, averaging 3.6 to 27.4 metres in width, is associated
with a gabbro complex. A 1971 historic resource and economic study (Manitoba Dept. of Mines)
estimated 2,000,000 tons at 0.33% Nickel and 0.75% Copper ($169.63 value per tonne and NSR
value $77.63 per tonne after mining/milling/transport deductions). A 1976 estimate (Manitoba Dept.
of Mines) of the historic resource gave 585,860 tonnes averaging 0.20% Ni and 0.53% Cu ($119.64
value per tonne and NSR value $27.64 per tonne after mining/milling/transport deductions). The
deposit remains under-explored with the property covering several other prospects. Additional lands
in the region could be added to the project from other companies active in the region.
Project Acquisition Agreement
Clifton Star entered in to an acquisition agreement for a 100% interest in the Beattie-Donchester,
Dumico, and Hunter and Cat Lake mine properties. The agreement calls for a Purchase Price of all
assets C$50 million with no NSR. An option for due diligence for 3 months for $1.0 million,
included in overall purchase, was completed in 2008. The next step includes the exercise of the
option, acceptance of the agreement, and satisfactory due diligence at the end of which $9 million is
due in July 2009. The balance of $40million is due 12 months after exercise of option. The
agreement also calls for an additional $3 per ounce of gold for total resources defined over 4 million
ounces on the Beattie – Donchester and Dumico properties. There are ongoing discussions covering
use of assets during the option phase of the agreement and potential early gold production from mill
clean up and or tailings reclamation. As well the Company is looking at restructuring the payments
to coincide with standard milestones in the development of this project.
9. Clifton Star Resources March 2009
Ronald Wortel First Canadian Securities 9
Directors and Management
Finance: Harry Miller, President – raised over $100 Million for projects in North America
Project Management: Dean Rogers, Director - senior geologist with over 30 years in region,
contacts to the local mining industry
Project Geologist: Fred Archibald, VP Exploration -- continuously managed these projects
for owners for several decades providing intimate knowledge of the deposits, data, regional
considerations
Financial Position
Management is building a
strategic land position in
an underexplored gold
camp
The Company’s shares outstanding total 23,046,016 with 34,511,085 fully diluted. The cash
position stands at close to $7 million, these funds are sufficient for basic operations and
exploration on their Quebec gold properties in 2009. The 2009 exploration budget is
estimated at $9 million. Warrants and Options total 11,465,069 and fully diluted cash totals
$ 26.2 million which could come in at share prices in excess of $3.50.We expect the
Company to look for additional financing in the range of $10-20 million to cover upcoming
option payments and continue exploration, with an improved share price and continued
strong gold price markets.
The Company’s major investor is the MineralFields Group who holds 42.6% of the shares
outstanding, reflecting their confidence in the Company.
Sufficient cash for
exploration and operations
Valuation
Clifton Star is a junior gold exploration company with projects in Quebec. In order to value
the company we look at the value the market is paying for resources in the ground in the
current market. Our analysis of this market includes 83 juniors with gold resources as
shown on figure 5 with a focus on Canadian gold plays. This group yields and average
enterprise value (EV) to adjusted total resource base of US$ 45.58 per ounce in the ground.
In this same chart we can see that Clifton Star is trading at US$41.93 per ounce and is about
in the middle of the group for its current resource. These initial values suggest that based on
current resources Clifton star is trading at a slight discount to the group average and could
appreciate by 8% to reach market average prices. We are expecting the Company to report
new resource values for both the Beattie – Donchester and Duquesne projects in the near
term. The Company completed over $7.7 million in exploration on these projects producing
new results for the new resource reports expected next quarter.
10. Clifton Star Resources March 2009
Ronald Wortel First Canadian Securities 10
Table 1: Resources and Expansion Potential
Project
Existing
Resource
CFO
Projected
Resource
CFOa₁
Projected
Resource
CFOb₂
Projected
Resource
CFOc₃
Duquesne 453,115 1,077,940 1,257,270 1,984,450
Beattie ‐ Donchester 638,859 1,732,580 2,046,480 3,312,875
Beattie Tailings 220,042 230,000 240,000 240,000
Central Duparquet 93,175 93,175 93,175 93,175
Total Resource 1,405,191 3,133,695 3,636,925 5,630,500
Source: Company Reports and FCS estimates
1
CFOa – expected Q2/09 total resources based on 2008 expenditure of $7.74M and FCS estimated $4.50/oz
finding costs
2
CFOb – Expected Q2/09 total resources based on 2008 drilling expenditures and $3.50/oz historic finding costs
3
CFOc – Expected Q2/10 total resources based on 2009 $9 million budget and FCS estimated finding costs of
$4.50/oz.
Historic and current finding costs per ounce on the projects are estimated at $3.50. This
could equate to an additional 2.2 million ounces on the projects in the new reports (see table
1). These potential additional ounces on the projects should add significant market value to
the stock based on the ounces in the ground analysis. Based on a slightly higher finding cost
of $4.50 per ounce our expectations for the reported total resource come in at 3.13 million
ounces. Looking further ahead into 2010 we estimate the 2009 $9 million budget could add
a further 2 million ounces in all categories.
We also look at comparables in the junior gold in the direct region to see where Clifton Star
stands as an investment alternative. From this analysis we can see that CFO is trading at an
enterprise value [EV] of US27.52/oz based on a total resource base. This compares to the
regional group average of US$31.99/oz. Clifton Star continues to looks inexpensive on this
basis for its current resource base (See figures 7 and 8). We expect this metric to be
improved in the near term as the Company publishes its updated resource values for the
projects as outlined above. As well we expect the current drilling to continue to add ounces
at the five gold projects along the Porcupine Destor fault zone.
11. Clifton Star Resources March 2009
Figure 5: Junior Gold Explorers Comparables – Adjusted Resource Basis
• See Table 1 for explanation of CFO, CFOa, CFOb, CFOc
Source: FCS estimates
Ronald Wortel First Canadian Securities 11
12. Clifton Star Resources March 2009
Figure 6: Junior Gold Explorers Comparables – Total Resource Basis
• See Table 1 for explanation of CFO, CFOa, CFOb, CFOc
Source: FCS estimates
Ronald Wortel First Canadian Securities 12
13. Clifton Star Resources March 2009
Figures 7 and 8: Regional Junior Gold Explorers Comparables – Resource Basis
• See Table 1 for explanation of CFO, CFOa, CFOb, CFOc
Source: FCS estimates
Ronald Wortel First Canadian Securities 13
14. Clifton Star Resources March 2009
On a resource basis we also look at what the market is paying for in terms of size of
resource to see if there is a trend. From this we can see that the market is paying a bit more
for some of Clifton Star’s closest comparables, Apollo Gold, Kirkland Lake Gold and
Queenston Mining. It may be the market is starting to prefer ounces in stable counties like
Canada.
Figure 9: Canadian Junior Gold Comparables– Resource Size Basis
• See Table 1 for explanation of CFO, CFOa, CFOb, CFOc
Source: FCS estimates
Ronald Wortel First Canadian Securities 14
15. Clifton Star Resources March 2009
Ronald Wortel First Canadian Securities 15
Clifton Star does not own all of its exploration projects at this time as explained above and
in the Risks section below. In order for the Company to meet this commitment the Company
must raise or pay an additional $49 million prior to July 2010. Exercise of warrants and
options brings in $26.2 million and the balance could be issued or raised assuming a price of
$5 per share, bringing the Company’s enterprise value to $197 million. Assuming success in
the 2009 exploration program we estimate a total resource of approximately 4.79 million
ounces on all the projects. This equates to an EV to total resources of US$ 27.25 per ounce
and $53.46/oz on an adjusted basis. These numbers are similar to the current valuation
assuming 100% ownership. This indicates there is value in completing the purchase should
the exploration continue to yield ounces at our projected rates of success. The Canadian
junior group average EV/oz is US$45.58 on an adjusted basis and US$26.86 on a total
resource basis. This illustrates that for the Canadian group as a whole a share price of $5 can
be justified for CFO with the valuation falling close to the group average.
On a regional group comparison these companies are trading at an average EV/ total
resource ounce of US$31.99 and US$49.67 on an adjusted basis. This smaller group is
showing that the market is paying significantly more for resources in this region. If we value
CFO at the regional average per adjusted resource ounce on a 100% fully diluted and
ownership basis we can estimate a share price potential of $4.65 (see table 3) Several of the
regional comparison companies are further advanced on their projects and include
producers, these facts could push up the value of their resource ounces. But we believe that
any resources discovered by Clifton Star should receive a premium over the total group due
to the proximity to infrastructure, Quebec’s attractive fiscal and operating regime, and the
potential for near term production. Our target price for the stock based on this analysis is
$5.35.
Table 2: Summary of Average EV/Resource Ounce for Canadian Junior Gold
Comparables
EV /Total
Resource [$/oz]
EV/Adjusted
Resources [$/oz]
Canadian Exploration Companies 26.86 45.58
Companies exploring the same region as
Clifton Star Resources 31.99 49.67
CFO 22.52 41.93
CFO A* 10.43 20.86
CFO B* 9.02 17.52
CFO C* 27.25 53.46
* See table 1 for explanation of the various resource estimates
Source: FCS estimates
16. Clifton Star Resources March 2009
Ronald Wortel First Canadian Securities 16
Table 3: Resource Expansion and Company Valuation.
Potential Share Valuation Based on
Average Market Trading Multiples
Total Resource
($/share)
Adjusted
Resources
($/Share)
CFO vs. Canadian Junior Exploration Group 2.53 2.30
CFO vs. Regional Junior Exploration Group 3.10 2.50
CFO A* vs. Canadian Junior Exploration
Group 5.45 4.60
CFO A* Regional Junior Exploration Group 6.50 5.05
CFO B* vs. Canadian Junior Exploration
Group 6.30 5.50
CFO B* vs. Regional Junior Exploration
Group 7.50 6.00
CFO C* vs. Canadian Junior Exploration
Group 4.95 4.25
CFO C* vs. Regional Junior Exploration
Group 5.85 4.65
* See table 1 for explanation of the various resource estimates
Source: FCS estimates
RISK FACTORS
Clifton Star Resources is a junior exploration and development Company and is subject to
several risks associated with this business and the market within which it operates. Its projects
are still at the exploration stage and contain an initial estimated resource. This resource, when
recovered, could show variation in grade and tonnage. As well, metallurgical recovery work is
at an early stage and published results are for a limited sample. We expect recoveries to be
improved from these preliminary values; however they could still be different from our
estimates. Discovering a mineral resource and realizing its value in production takes
significant capital and time and is subject to many risks during this process.
Clifton Star is also subject to project financing risk. The purchase agreement for the main
projects under exploration by the Company calls for a $9 million payment in July of 2009.
Cash balances are currently less than this amount. As well, a further $40 million is due 12
months after this date. The Company needs to raise this capital in the markets or it could
lose the option for ownership on its main projects where many millions of dollars in
exploration were spent. Or the Company could renegotiate the terms of the agreement to
include the potential for the payments to be made in shares of the Company, which is
dilutive, or to change the structure and timing of the payments.
17. Clifton Star Resources March 2009
Ronald Wortel First Canadian Securities 17
CONCLUSION
Substantial resource
growth anticipated
Clifton Star Resources is a Canadian junior gold exploration company with a growing
resource base. The current resource base totals over 1.4 million ounces on four projects
in NW Quebec. The Company holds the Duquesne project 100% with an option to
acquire 100% of the remaining projects. Since obtaining the projects the Company
expended over $8 million in exploration and completed close to 70,000m in drilling.
The work should translate into an expanded gold resource base. Our estimates
suggest the total resource base could more than double to 3.1 million ounces based
on conservative finding costs of $4.50 per ounce. Using long term finding costs
resources could expand to over 3.6 million ounces. New 43-101 reports covering the
bulk of these resource zones are expected during Q2 2009.
We expect the market value of the Company to increase proportionately with these
new resource values. As well, exploration continues on the projects in 2009 with a
budget of $9 million. This exploration should also add substantially to the resource
over the next year.
The Company needs to complete its acquisition of several key assets over the next
14 months requiring financing of close to $50 million. The purchase agreement may
be modified to include a portion of the purchase to include the issuance of stock or the
payment out of cash flow generated from gold sales. The recent increase in the
Canadian dollar gold price to over $1,200 per ounce is making financing for the near
term and nearby gold companies possible. We could see Clifton Star access these
markets once the expanded resource values are confirmed and the share price reacts
positively.
We believe Clifton Star represents an excellent investment for those looking for
market exposure to a gold exploration company with a rapidly expanding
resource base in a stable jurisdiction. This expanding and significant resource base
could also attract the major gold producers. Based on our analysis Clifton Star is
trading at a discount to the Canadian and regional gold exploration company
comparables.
We are recommending Clifton Star as a Speculative Buy with a 12-month target
of $5.35.
18. Clifton Star Resources March 2009
Investment Opinion Definition
STRONG
BUY:
The share price is expected to appreciate 30% or more over the next 12 months.
BUY: The share price is expected to appreciate 10% to 30% over the next 12 months.
HOLD:
The share price is expected to appreciate substantially over the next 12 months, but with a high level of
inherent risk
SELL: The share price is expected to have a negative rate of return over the next 12 months.
SPECULATIVE
BUY:
NOT RATED:
The share price is expected to appreciate substantially over the next 12 months, but with a high level of
inherent risk
Insufficient work completed so far to make an investment recommendation.
Note: Percentages are approximate and ratings are at the analyst’s discretion.
Analyst Certification
All of the views expressed in this report accurately reflect the personal views of the responsible analyst about any and all of
the subject securities or issuers. No part of the compensation of the responsible analyst named herein is, or will be, directly
or indirectly, related to the specific recommendations or views expressed by the responsible analyst in this report. The
analyst directly owns shares of Clifton Star Resources Inc.
Dissemination of Research
First Canadian Securities ® endeavours to make all reasonable efforts to provide research simultaneously to all eligible
clients via email. Sales personnel via email, fax or regular mail may do additional distribution.
Material Disclosures
The analyst responsible for preparing this research report received compensation that is based upon various factors,
including financing revenues of First Canadian Securities ®
Within the past 12 months, First Canadian Securities ® received compensation associated with financing Clifton Star
Resources Inc.
The analyst responsible for preparation of this report, Ron Wortel, visited the Quebec assets of Clifton Star in July 2008 and
September 2008.
First Canadian Securities ® and its affiliates collectively beneficially own 46.2 % or more of the equity securities of Clifton
Star Resources.
Ronald Wortel First Canadian Securities 18