SlideShare a Scribd company logo
1 of 15
Download to read offline
CC Media Holdings, Inc. Reports Second Quarter 2008 Results


                                             ----------------
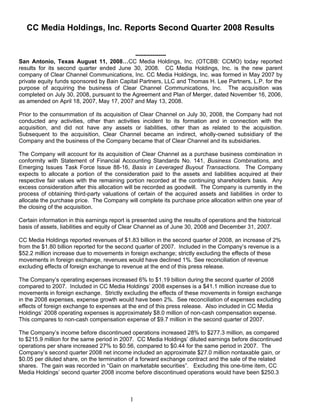
San Antonio, Texas August 11, 2008…CC Media Holdings, Inc. (OTCBB: CCMO) today reported
results for its second quarter ended June 30, 2008. CC Media Holdings, Inc. is the new parent
company of Clear Channel Communications, Inc. CC Media Holdings, Inc. was formed in May 2007 by
private equity funds sponsored by Bain Capital Partners, LLC and Thomas H. Lee Partners, L.P. for the
purpose of acquiring the business of Clear Channel Communications, Inc. The acquisition was
completed on July 30, 2008, pursuant to the Agreement and Plan of Merger, dated November 16, 2006,
as amended on April 18, 2007, May 17, 2007 and May 13, 2008.

Prior to the consummation of its acquisition of Clear Channel on July 30, 2008, the Company had not
conducted any activities, other than activities incident to its formation and in connection with the
acquisition, and did not have any assets or liabilities, other than as related to the acquisition.
Subsequent to the acquisition, Clear Channel became an indirect, wholly-owned subsidiary of the
Company and the business of the Company became that of Clear Channel and its subsidiaries.

The Company will account for its acquisition of Clear Channel as a purchase business combination in
conformity with Statement of Financial Accounting Standards No. 141, Business Combinations, and
Emerging Issues Task Force Issue 88-16, Basis in Leveraged Buyout Transactions. The Company
expects to allocate a portion of the consideration paid to the assets and liabilities acquired at their
respective fair values with the remaining portion recorded at the continuing shareholders basis. Any
excess consideration after this allocation will be recorded as goodwill. The Company is currently in the
process of obtaining third-party valuations of certain of the acquired assets and liabilities in order to
allocate the purchase price. The Company will complete its purchase price allocation within one year of
the closing of the acquisition.

Certain information in this earnings report is presented using the results of operations and the historical
basis of assets, liabilities and equity of Clear Channel as of June 30, 2008 and December 31, 2007.

CC Media Holdings reported revenues of $1.83 billion in the second quarter of 2008, an increase of 2%
from the $1.80 billion reported for the second quarter of 2007. Included in the Company‘s revenue is a
$52.2 million increase due to movements in foreign exchange; strictly excluding the effects of these
movements in foreign exchange, revenues would have declined 1%. See reconciliation of revenue
excluding effects of foreign exchange to revenue at the end of this press release.

The Company‘s operating expenses increased 6% to $1.19 billion during the second quarter of 2008
compared to 2007. Included in CC Media Holdings‘ 2008 expenses is a $41.1 million increase due to
movements in foreign exchange. Strictly excluding the effects of these movements in foreign exchange
in the 2008 expenses, expense growth would have been 2%. See reconciliation of expenses excluding
effects of foreign exchange to expenses at the end of this press release. Also included in CC Media
Holdings‘ 2008 operating expenses is approximately $8.0 million of non-cash compensation expense.
This compares to non-cash compensation expense of $9.7 million in the second quarter of 2007.

The Company‘s income before discontinued operations increased 28% to $277.3 million, as compared
to $215.9 million for the same period in 2007. CC Media Holdings‘ diluted earnings before discontinued
operations per share increased 27% to $0.56, compared to $0.44 for the same period in 2007. The
Company‘s second quarter 2008 net income included an approximate $27.0 million nontaxable gain, or
$0.05 per diluted share, on the termination of a forward exchange contract and the sale of the related
shares. The gain was recorded in ―Gain on marketable securities‖. Excluding this one-time item, CC
Media Holdings‘ second quarter 2008 income before discontinued operations would have been $250.3


                                             1
million, or $0.51 per diluted share. See reconciliation of net income and diluted earnings per share at
the end of this press release.

CC Media Holdings‘ OIBDAN (defined as Operating Income before Depreciation & amortization, Non-
cash compensation expense, Merger costs and Gain on disposition of assets – net) was $604.7 million
in the second quarter of 2008, a 7% decrease from 2007. See reconciliation of OIBDAN to net income
at the end of this press release.

Mark P. Mays, Chief Executive Officer of CC Media Holdings, commented, ――Results for the first half
and second quarter of 2008 were impressive in the context of this challenging economic and
advertising climate. We reported higher revenue and earnings per share for the second quarter and
continued to outperform many in the media arena. Strong relative performance in both Outdoor and
Radio are a testament to the wisdom of continuing to do what we do best. We exert strict cost
discipline and invest in the growth drivers of our core businesses. As we enter the second half of the
year with our merger closed, we are hopeful that our streamlined operations coupled with a
concentration on growth and execution will enable us to continue to perform well, despite a difficult
economic environment.‖


Merger Update

Clear Channel held a special meeting of its shareholders on July 24, 2008, at which the proposed
merger, as amended, was approved. The merger closed on July 30, 2008.

Under the terms of the Merger Agreement, as amended, Clear Channel‘s shareholders received $36.00
in cash for each share they own. As an alternative to receiving the $36.00 per share cash
consideration, Clear Channel‘s shareholders were offered the opportunity on a purely voluntary basis to
exchange some or all of their shares of Clear Channel common stock on a one-for-one basis for shares
of Class A common stock in the Company. Approximately 23.6 million shares were exchanged.

Radio Divestitures

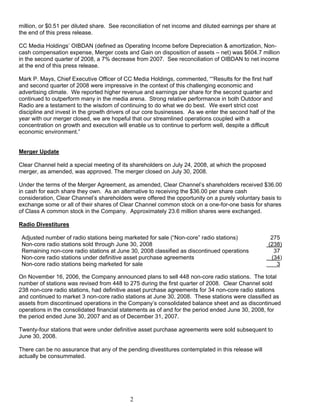
 Adjusted number of radio stations being marketed for sale (―Non-core‖ radio stations)               275
 Non-core radio stations sold through June 30, 2008                                                 (238)
 Remaining non-core radio stations at June 30, 2008 classified as discontinued operations             37
 Non-core radio stations under definitive asset purchase agreements                                  (34)
 Non-core radio stations being marketed for sale                                                       3

On November 16, 2006, the Company announced plans to sell 448 non-core radio stations. The total
number of stations was revised from 448 to 275 during the first quarter of 2008. Clear Channel sold
238 non-core radio stations, had definitive asset purchase agreements for 34 non-core radio stations
and continued to market 3 non-core radio stations at June 30, 2008. These stations were classified as
assets from discontinued operations in the Company‘s consolidated balance sheet and as discontinued
operations in the consolidated financial statements as of and for the period ended June 30, 2008, for
the period ended June 30, 2007 and as of December 31, 2007.

Twenty-four stations that were under definitive asset purchase agreements were sold subsequent to
June 30, 2008.

There can be no assurance that any of the pending divestitures contemplated in this release will
actually be consummated.


                                            2
Revenue, Direct Operating and SG&A Expenses, and OIBDAN by Division

                                                Three Months Ended         %
(In thousands)
                                                      June 30,           Change
                                                 2008         2007
Revenue
 Radio Broadcasting                            $ 891,483 $ 945,963        (6%)
 Outdoor Advertising                              914,808    836,713       9%
 Other                                             52,381     52,514      (0%)
 Eliminations                                     (27,594)   (32,998)
Consolidated revenue                           $1,831,078 $1,802,192       2%

CC Media Holdings‘ second quarter 2008 revenue increased from foreign exchange movements of
approximately $52.2 million as compared to the same period of 2007.

Direct Operating and SG&A Expenses by Division
  Radio Broadcasting                      $ 531,291 $ 548,639
  Less: Non-cash compensation expense          (4,506)  (6,676)
                                             526,785   541,963            (3%)

 Outdoor Advertising                             641,278      563,700
 Less: Non-cash compensation expense              (3,450)      (2,995)
                                                 637,828      560,705     14%

 Other                                            44,244       44,104
                                                      —            —
 Less: Non-cash compensation expense
                                                  44,244       44,104      0%

 Eliminations                                    (27,594)     (32,998)

 Plus: Non-cash compensation expense               7,956        9,671
Consolidated divisional operating
 expenses                                      $1,189,219   $1,123,445     6%

CC Media Holdings‘ second quarter 2008 direct operating and SG&A expenses increased from foreign
exchange movements of approximately $41.1 million as compared to the same period of 2007.

OIBDAN
 Radio Broadcasting                            $ 364,698 $ 404,000        (10%)
 Outdoor Advertising                             276,980   276,008          0%
 Other                                             8,137     8,410         (3%)
 Corporate                                       (45,138)  (39,376)
Consolidated OIBDAN                            $ 604,677 $ 649,042        (7%)

See reconciliation of OIBDAN to net income at the end of this press release.


Radio Broadcasting

The Company‘s radio broadcasting revenue declined approximately $54.5 million in the second quarter
of 2008 compared to the same period of the prior year. Decreases in local and national revenues were
partially offset by increases in traffic and on-line revenues. Local and national revenues were down as
a result of overall weakness in advertising. The Company‘s radio revenue experienced declines across
all different sized markets and advertising categories including automotive, retail and consumer


                                           3
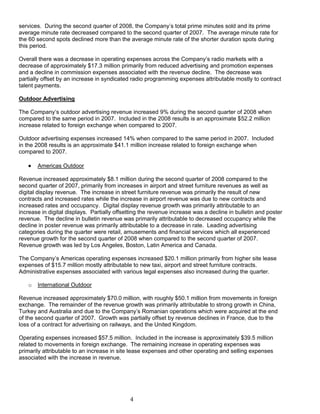
services. During the second quarter of 2008, the Company‘s total prime minutes sold and its prime
average minute rate decreased compared to the second quarter of 2007. The average minute rate for
the 60 second spots declined more than the average minute rate of the shorter duration spots during
this period.

Overall there was a decrease in operating expenses across the Company‘s radio markets with a
decrease of approximately $17.3 million primarily from reduced advertising and promotion expenses
and a decline in commission expenses associated with the revenue decline. The decrease was
partially offset by an increase in syndicated radio programming expenses attributable mostly to contract
talent payments.

Outdoor Advertising

The Company‗s outdoor advertising revenue increased 9% during the second quarter of 2008 when
compared to the same period in 2007. Included in the 2008 results is an approximate $52.2 million
increase related to foreign exchange when compared to 2007.

Outdoor advertising expenses increased 14% when compared to the same period in 2007. Included
in the 2008 results is an approximate $41.1 million increase related to foreign exchange when
compared to 2007.

       Americas Outdoor

Revenue increased approximately $8.1 million during the second quarter of 2008 compared to the
second quarter of 2007, primarily from increases in airport and street furniture revenues as well as
digital display revenue. The increase in street furniture revenue was primarily the result of new
contracts and increased rates while the increase in airport revenue was due to new contracts and
increased rates and occupancy. Digital display revenue growth was primarily attributable to an
increase in digital displays. Partially offsetting the revenue increase was a decline in bulletin and poster
revenue. The decline in bulletin revenue was primarily attributable to decreased occupancy while the
decline in poster revenue was primarily attributable to a decrease in rate. Leading advertising
categories during the quarter were retail, amusements and financial services which all experienced
revenue growth for the second quarter of 2008 when compared to the second quarter of 2007.
Revenue growth was led by Los Angeles, Boston, Latin America and Canada.

The Company‘s Americas operating expenses increased $20.1 million primarily from higher site lease
expenses of $15.7 million mostly attributable to new taxi, airport and street furniture contracts.
Administrative expenses associated with various legal expenses also increased during the quarter.

   o   International Outdoor

Revenue increased approximately $70.0 million, with roughly $50.1 million from movements in foreign
exchange. The remainder of the revenue growth was primarily attributable to strong growth in China,
Turkey and Australia and due to the Company‘s Romanian operations which were acquired at the end
of the second quarter of 2007. Growth was partially offset by revenue declines in France, due to the
loss of a contract for advertising on railways, and the United Kingdom.

Operating expenses increased $57.5 million. Included in the increase is approximately $39.5 million
related to movements in foreign exchange. The remaining increase in operating expenses was
primarily attributable to an increase in site lease expenses and other operating and selling expenses
associated with the increase in revenue.


                                             4
FAS No. 123 (R): Share-Based Payment (“FAS 123(R)”)

The following table details non-cash compensation expense, which represents employee compensation
costs related to stock option grants and restricted stock awards, for the second quarter of 2008 and
2007:

                                                  Three Months Ended
(In thousands)
                                                        June 30,
                                                   2008         2007
Direct operating expense                        $    4,583 $      5,172
SG&A                                                 3,373        4,499
Corporate                                            2,836        3,668
Total non-cash compensation                     $ 10,792 $ 13,339


Current Information and Expectations

The Company has previously provided information regarding its revenue pacings and certain
expectations related to 2008 operating results. That information was last provided on May 9, 2008 and
has not been updated. The Company is not providing such information in this release and does not
anticipate providing this information in the future. The Company will not update or revise any previously
disclosed information. Investors are cautioned to no longer rely on such prior information given the
passage of time and other reasons discussed in the Company‘s reports filed with the SEC. Future
results could differ materially than the forward-looking information previously disclosed.

The Company periodically reviews its disclosure practices in the ordinary course of its business and
management determined to cease providing this information after taking into consideration a number of
factors. There should be nothing read into the timing of this change in policy, nor should any inferences
be drawn relative to internal or external economic factors.


                                            5
TABLE 1 - Financial Highlights of CC Media Holdings, Inc. and Subsidiaries - Unaudited

                                                          Three Months Ended
                                                                June 30,               %
(In thousands, except per share data)
                                                           2008        2007          Change

Revenue                                               $1,831,078 $1,802,192           2%
Direct operating expenses                               743,485    676,255
Selling, general and administrative expenses            445,734    447,190
Corporate expenses                                        47,974     43,044
Merger costs                                               7,456      2,684
Depreciation and amortization                           142,188    141,309
Gain on disposition of assets – net                       17,354      3,996
Operating Income                                        461,595    495,706            (7%)

Interest expense                                            82,175        116,422
Gain (loss) on marketable securities                        27,736           (410)
Equity in earnings of nonconsolidated affiliates             8,990         11,435
Other income (expense) – net                                (6,086)           340
Income before income taxes, minority interest and
  discontinued operations                                  410,060        390,649
Income tax expense:
  Current                                                  101,047        122,071
  Deferred                                                  24,090         37,715
Income tax expense                                         125,137        159,786
Minority interest expense, net of tax                        7,628         14,970
Income before discontinued operations                      277,295        215,893     28%
Income from discontinued operations                          5,032         20,097

Net income                                            $ 282,327 $ 235,990             20%

Diluted earnings per share:

Diluted earnings before discontinued operations per
 share                                                $       .56     $       .44     27%
                                                      $       .57     $       .48     19%
Diluted earnings per share
Weighted average shares outstanding – Diluted              496,887        495,688


Income Taxes
The Company‘s effective tax rate for the three months ended June 30, 2008 was 30.5% as
compared to 40.9% for the same period of the prior year. The decline was primarily due to the
release of the valuation allowance on the capital loss carryforwards that were used to offset
the taxable gain from the disposition of the Company‘s America Tower Corporation shares.


                                          6
TABLE 2 - Selected Balance Sheet Information - Unaudited

Selected balance sheet information for 2008 and 2007 was:

                                                                           June 30,      December 31,
                                                                             2008           2007
(In millions)

Cash                                                                   $         668.1   $       145.1
Total Current Assets                                                   $       2,908.9   $     2,294.6
Net Property, Plant and Equipment                                      $       3,081.5   $     3,050.4
Total Assets                                                           $      19,078.4   $    18,805.5
Current Liabilities (excluding current portion of long-term debt)      $       1,429.0   $     1,453.1
Long-Term Debt (including current portion of long-term debt)*          $       5,772.3   $     6,575.2
Shareholders‘ Equity                                                   $       9,876.0   $     8,797.5

* See Table 4 for a discussion of debt incurred in conjunction with the merger.

TABLE 3 - Capital Expenditures - Unaudited

Capital expenditures for the six months ended June 30, 2008 and 2007 were:

                                         June 30, 2008              June 30, 2007
(In millions)

Non-revenue producing                       $     81.8                $     77.7
Revenue producing                                129.9                      75.3
  Total capital expenditures                $    211.7                $    153.0

The Company defines non-revenue producing capital expenditures as those expenditures that are
required on a recurring basis. Revenue producing capital expenditures are discretionary capital
investments for new revenue streams, similar to an acquisition.


                                             7
TABLE 4 – Post Merger Capital Structure - Unaudited

In connection with the merger, the Company terminated its $1.75 billion multi-currency revolving credit
facility and incurred new amounts of debt, including amounts outstanding under the Company‘s new
senior secured credit facilities, its new receivables based credit facility and the new senior cash pay
and senior toggle notes. Additionally, the Company repurchased $639.2 million aggregate principal
amount of the AMFM Operating, Inc. 8% Senior Notes due 2008 pursuant to a tender offer and consent
solicitation. On August 7, 2008, the Company announced that it commenced a cash tender offer and
consent solicitation for its outstanding $750.0 million principal amount of 7.65% senior notes due 2010
on the terms and conditions set forth in the Offer to Purchase and Consent Solicitation Statement dated
August 7, 2008.

Immediately following the closing of the transaction, the Company has aggregate principal amount of
debt outstanding of approximately $20.8 billion (and available and undrawn facilities of approximately
$1.7 billion), the components of which are:

        (In thousands)
                                                                Amount
        Term Loan A                                          $ 1,331,500
        Term Loan B                                           10,700,000
        Term Loan C                                              695,879
                                                                      —
        Delayed Draw Facility
        Receivables Based Facility                               533,500
        Revolving Credit Facility                                 80,000
        Senior Cash Pay Notes                                    980,000
        Senior Toggle Notes                                    1,330,000
        Existing Clear Channel Senior Notes                    5,025,000
        Existing Clear Channel Subsidiary Debt                   111,929
          Total Indebtedness                                 $20,787,808

In connection with the merger, the Company issued approximately 23.6 million shares of Class A
common stock, approximately 0.6 million shares of Class B common stock and approximately 59.0
million shares of Class C common stock for a total of approximately 83.2 million shares. Every holder
of shares of Class A common stock is entitled to one vote for each share of Class A common stock.
Every holder of shares of Class B common stock is entitled to a number of votes per share equal to the
number obtained by dividing (a) the sum of the total number of shares of Class B common stock
outstanding as of the record date for such vote and the number of Class C common stock outstanding
as of the record date for such vote by (b) the number of shares of Class B common stock outstanding
as of the record date for such vote. Except as otherwise required by law, the holders of outstanding
shares of Class C common stock are not entitled to any votes upon any questions presented to its
stockholders.

Except with respect to voting as described above, and as otherwise required by law, all shares of Class
A common stock, Class B common stock and Class C common stock have the same powers,
privileges, preferences and relative participating, optional or other special rights, and the qualifications,
limitations or restrictions thereof, and will be identical to each other in all respects.

Liquidity and Financial Position

For the six months ended June 30, 2008, cash flow from operating activities was $686.0 million, cash
flow used by investing activities was $178.1 million, cash flow used by financing activities was $998.7
million, and net cash provided by discontinued operations was $1.0 billion for a net increase in cash of
$522.9 million.


                                              8
As of August 8, 2008, the Company had approximately $1.7 billion available on its bank revolving credit
facility. The Company may utilize existing capacity under its bank revolving credit facility and other
available funds for general working capital purposes including funding capital expenditures, acquisitions
and the refinancing of certain public debt securities.


                                            9
Supplemental Disclosure Regarding Non-GAAP Financial Information

Operating Income before Depreciation and Amortization (D&A), Non-cash Compensation
Expense and Gain on Disposition of Assets – Net (OIBDAN)

The following tables set forth the Company‘s OIBDAN for the three months ended June 30, 2008 and
2007. The Company defines OIBDAN as net income adjusted to exclude non-cash compensation
expense and the following line items presented in its Statement of Operations: Discontinued operations;
Minority interest, net of tax; Income tax benefit (expense); Other income (expense) - net; Equity in
earnings of nonconsolidated affiliates; Gain (loss) on marketable securities; Interest expense; Gain on
disposition of assets - net D&A; and merger costs.

The Company uses OIBDAN, among other things, to evaluate the Company's operating performance.
This measure is among the primary measures used by management for planning and forecasting of
future periods, as well as for measuring performance for compensation of executives and other
members of management. This measure is an important indicator of the Company's operational
strength and performance of its business because it provides a link between profitability and cash flows
from operating activities. It is also a primary measure used by management in evaluating companies
as potential acquisition targets.

The Company believes the presentation of this measure is relevant and useful for investors because it
allows investors to view performance in a manner similar to the method used by the Company's
management. It helps improve investors‘ ability to understand the Company's operating performance
and makes it easier to compare the Company's results with other companies that have different capital
structures, stock option structures or tax rates. In addition, this measure is also among the primary
measures used externally by the Company's investors, analysts and peers in its industry for purposes
of valuation and comparing the operating performance of the Company to other companies in its
industry. Additionally, the Company‘s bank credit facilities use this measure for compliance with
leverage covenants.

Since OIBDAN is not a measure calculated in accordance with GAAP, it should not be considered in
isolation of, or as a substitute for, net income as an indicator of operating performance and may not be
comparable to similarly titled measures employed by other companies. OIBDAN is not necessarily a
measure of the Company's ability to fund its cash needs. As it excludes certain financial information
compared with operating income and net income (loss), the most directly comparable GAAP financial
measures, users of this financial information should consider the types of events and transactions,
which are excluded.

In addition, because a significant portion of the Company‘s advertising operations are conducted in
foreign markets, principally France and the United Kingdom, management reviews the operating results
from its foreign operations on a constant dollar basis. A constant dollar basis (i.e. a foreign currency
adjustment is made to the 2008 actual foreign revenues and expenses at average 2007 foreign
exchange rates) allows for comparison of operations independent of foreign exchange movements.

As required by the SEC, the Company provides reconciliations below to the most directly comparable
amounts reported under GAAP, including (i) OIBDAN for each segment to consolidated operating
income; (ii) Revenue excluding foreign exchange effects to revenue; (iii) Expense excluding foreign
exchange effects to expenses; (iv) OIBDAN to net income; and (v) Net income and diluted earnings per
share excluding certain items discussed earlier.


                                           10
Gain on
                                                                     disposition of
(In thousands)
                                                                     assets – net
                                         Non-cash     Depreciation
                         Operating     compensation      and             and
                       income (loss)     expense      amortization   Merger costs         OIBDAN

Three Months Ended June 30, 2008
                                                                              —
Radio Broadcasting     $ 339,177        $    4,506     $    21,015   $                $     364,698
                                                                              —
Outdoor                   168,766            3,450         104,764                          276,980
                                                —                             —
Other                       (4,613)                         12,750                            8,137
Gain on disposition of
 assets – net                                   —             —                                  —
                            17,354                                     (17,354)
                                                —             —                                  —
Merger costs                (7,456)                                      7,456
                                                                            —
Corporate                  (51,633)          2,836         3,659                            (45,138)
 Consolidated          $ 461,595        $   10,792     $ 142,188     $  (9,898)       $     604,677

Three Months Ended June 30, 2007
                                                                              —
Radio Broadcasting     $ 369,075        $    6,676     $    28,249   $                $     404,000
                                                                              —
Outdoor                   174,860            2,995          98,153                          276,008
                                                —                             —
Other                       (2,407)                         10,817                            8,410
Gain on disposition of
 assets – net                                   —             —                                  —
                             3,996                                       (3,996)
                                                —             —                                  —
Merger costs                (2,684)                                       2,684
                                                                             —
Corporate                  (47,134)          3,668         4,090                            (39,376)
 Consolidated          $ 495,706        $   13,339     $ 141,309     $   (1,312)      $     649,042


                                       11
Reconciliation of Revenue excluding Foreign Exchange Effects to Revenue

                                                 Three Months Ended      %
(In thousands)
                                                       June 30,        Change
                                                  2008         2007

Revenue                                      $1,831,078 $1,802,192      2%
                                                                —
Less: Foreign exchange increase                 (52,224)
Revenue excluding effects of foreign
 exchange                                    $1,778,854   $1,802,192    (1%)

Outdoor revenue                              $ 914,808 $ 836,713        9%
                                                              —
Less: Foreign exchange increase                (52,224)
Outdoor revenue excluding effects of
 foreign exchange                            $ 862,584    $ 836,713     3%

International Outdoor revenue                $ 529,830 $ 459,870        15%
                                                              —
Less: Foreign exchange increase                (50,078)
International Outdoor revenue excluding
  effects of foreign exchange                $ 479,752    $ 459,870     4%

Reconciliation of Expense (Direct Operating and SG&A Expenses)
excluding Foreign Exchange Effects to Expense

                                                 Three Months Ended      %
(In thousands)
                                                       June 30,        Change
                                                  2008         2007

Consolidated expense                         $1,189,219 $1,123,445      6%
                                                                —
Less: Foreign exchange increase                 (41,095)
Consolidated expense excluding effects of
 foreign exchange                            $1,148,124   $1,123,445    2%

Outdoor expense                              $ 641,278 $ 563,700        14%
                                                              —
Less: Foreign exchange increase                (41,095)
Outdoor expense excluding effects of
 foreign exchange                            $ 600,183    $ 563,700     6%

International Outdoor expense                $ 420,201 $ 362,690        16%
                                                              —
Less: Foreign exchange increase                (39,427)
International Outdoor expense excluding
  effects of foreign exchange                $ 380,774    $ 362,690     5%


                                            12
Reconciliation of OIBDAN to Net income

                                                Three Months Ended             %
(In thousands)
                                                      June 30,               Change
                                                 2008          2007

OIBDAN                                        $ 604,677      $    649,042        (7%)
Non-cash compensation expense                    10,792            13,339
Depreciation & amortization                     142,188           141,309
Merger costs                                      7,456             2,684
Gain on disposition of assets – net              17,354             3,996
Operating Income                                461,595           495,706        (7%)

Interest expense                                   82,175         116,422
Gain (loss) on marketable securities               27,736            (410)
Equity in earnings of nonconsolidated
    affiliates                                      8,990          11,435
Other income (expense) – net                       (6,086)            340
Income before income taxes, minority
    interest and discontinued operations        410,060           390,649
Income tax expense:
    Current                                     101,047           122,071
    Deferred                                     24,090            37,715
Income tax expense                              125,137           159,786
Minority interest expense, net of tax             7,628            14,970
Income before discontinued operations           277,295           215,893
Income from discontinued operations               5,032            20,097

Net income                                    $ 282,327      $    235,990


Reconciliation of Net Income and Diluted Earnings per Share (“EPS”)

                                          Three Months Ended                   Three Months Ended
(In millions, except per share data)
                                              June 30, 2008                        June 30, 2007
                                       Net Income         EPS               Net Income         EPS
Reported Amounts                       $ 282.3          $    .57            $ 236.0          $    .48
Discontinued operations                       (5.0)         (.01)                 (20.1)         (.04)
                                                                                     —             —
Less: Gain on sale of shares                 (27.0)         (.05)


Amounts excluding certain items        $   250.3        $        .51         $     215.9    $     .44


2007 Quarterly Information
On May 30, 2008, Clear Channel Communications filed on Form 8-K revised financial statements. The
financial statements were revised to reflect, for each of the quarters for the year ended December 31,
2007, the reclassification of the revenues and operating expenses of certain radio markets from
discontinued operations to continuing operations in accordance with Statement of Financial Accounting
Standards No. 144, Accounting for the Impairment or Disposal of Long-lived Assets (―Statement 144‖).
The following table provides full year 2007 revenues, expenses and non-cash compensation by
business segment and by quarter.

                                           13
Fiscal Year 2007
  (in $000s)

  Net Revenue
                           1Q 2007       2Q 2007      3Q 2007        4Q 2007        FY 2007
  Radio                     $799,201      $945,963     $909,643       $903,727      $3,558,534
  Outdoor                    690,856       836,713      817,541        936,726       3,281,836
                               45,674                      55,352        54,164        207,704
  Other                                      52,514
                             (30,654)      (32,998)      (31,371)       (31,849)     (126,872)
  Eliminations
                          $1,505,077    $1,802,192    $1,751,165     $1,862,768     $6,921,202
  Consolidated


  Direct and SG&A
  Expenses (Includes
  Non-Cash
  Compensation)
                           1Q 2007       2Q 2007      3Q 2007        4Q 2007        FY 2007
  Radio                     $511,211      $548,639      $542,729       $570,470     $2,173,049
  Outdoor                    521,738       563,700       565,700        621,701      2,272,839
                               41,903        44,104        43,989         45,931       175,927
  Other
                             (30,654)      (32,998)      (31,371)       (31,849)     (126,872)
  Eliminations
                          $1,044,198    $1,123,445    $1,121,047     $1,206,253     $4,494,943
  Consolidated


Non-Cash
Compensation
(Included in Direct and
SG&A Expenses)
                          1Q 2007       2Q 2007       3Q 2007        4Q 2007        FY 2007
Radio                        $4,464        $6,676        $5,610          $5,476       $22,226
Outdoor                       1,367         2,995         2,257           3,014          9,633
                               ------       -------        -------         ------       --------
Other
                             $5,831        $9,671        $7,867          $8,490       $31,859
Consolidated


                                        14
About CC Media Holdings, Inc.
CC Media Holdings, the new parent company of Clear Channel Communications, is a global media and
entertainment company specializing in mobile and on-demand entertainment and information services
for local communities and premiere opportunities for advertisers. The company's businesses include
radio and outdoor displays. More information is available at www.clearchannel.com.

For further information contact:
Investors – Randy Palmer, Senior Vice President of Investor Relations, (210) 832-3315 or
Media – Lisa Dollinger, Chief Communications Officer, (210) 832-3474
or visit the Company‘s web-site at http://www.clearchannel.com.

Certain statements in this document constitute “forward-looking statements” within the meaning of the
Private Securities Litigation Reform Act of 1995. Such forward-looking statements involve known and
unknown risks, uncertainties and other factors which may cause the actual results, performance or
achievements of Clear Channel Communications to be materially different from any future results,
performance or achievements expressed or implied by such forward-looking statements. The words or
phrases “guidance,” “believe,” “expect,” “anticipate,” “estimates” and “forecast” and similar words or
expressions are intended to identify such forward-looking statements. In addition, any statements that
refer to expectations or other characterizations of future events or circumstances are forward-looking
statements.

Various risks that could cause future results to differ from those expressed by the forward-looking
statements included in this document include, but are not limited to: changes in business, political and
economic conditions in the U.S. and in other countries in which Clear Channel Communications currently
does business (both general and relative to the advertising industry); fluctuations in interest rates;
changes in operating performance; shifts in population and other demographics; changes in the level of
competition for advertising dollars; fluctuations in operating costs; technological changes and
innovations; changes in labor conditions; changes in governmental regulations and policies and actions
of regulatory bodies; fluctuations in exchange rates and currency values; changes in tax rates; and
changes in capital expenditure requirements; access to capital markets and changes in credit ratings.
Other unknown or unpredictable factors also could have material adverse effects on Clear Channel
Communications’ future results, performance or achievements. In light of these risks, uncertainties,
assumptions and factors, the forward-looking events discussed in this document may not occur. You are
cautioned not to place undue reliance on these forward-looking statements, which speak only as of the
date stated, or if no date is stated, as of the date of this document. Other key risks are described in Clear
Channel Communications’ reports filed with the U.S. Securities and Exchange Commission, including in
the section entitled “Item 1A. Risk Factors” of Clear Channel’s Annual Report on Form 10-K for the year
ended December 31, 2007. Except as otherwise stated in this document, Clear Channel Communications
does not undertake any obligation to publicly update or revise any forward-looking statements because
of new information, future events or otherwise.


                                             15

More Related Content

What's hot

hsbc Cover of 2008 Interim Results slide presentation Download 2008 Interi...
hsbc Cover of 2008 Interim Results slide presentation 	  Download 2008 Interi...hsbc Cover of 2008 Interim Results slide presentation 	  Download 2008 Interi...
hsbc Cover of 2008 Interim Results slide presentation Download 2008 Interi...QuarterlyEarningsReports2
 
duke energy 1Q 07_Slides
duke energy 1Q 07_Slidesduke energy 1Q 07_Slides
duke energy 1Q 07_Slidesfinance21
 
aon 2Q 08 Earnings Release
aon  2Q 08 Earnings Releaseaon  2Q 08 Earnings Release
aon 2Q 08 Earnings Releasefinance27
 
el paso 08_072QEarnings
el paso  08_072QEarningsel paso  08_072QEarnings
el paso 08_072QEarningsfinance49
 
progress energy Q2 2005 earnings release
progress energy Q2 2005 earnings releaseprogress energy Q2 2005 earnings release
progress energy Q2 2005 earnings releasefinance25
 
clearchannel 35
clearchannel 35clearchannel 35
clearchannel 35finance31
 
northrop grumman Earnings Announcement 2007 4th
northrop grumman Earnings Announcement 2007 4th northrop grumman Earnings Announcement 2007 4th
northrop grumman Earnings Announcement 2007 4th finance8
 
energyfutureholdings TXUQ3_02
energyfutureholdings TXUQ3_02energyfutureholdings TXUQ3_02
energyfutureholdings TXUQ3_02finance29
 
walt disney Quarter 2008 3rd
walt disney   Quarter 2008 3rdwalt disney   Quarter 2008 3rd
walt disney Quarter 2008 3rdfinance7
 
20/06/050201f
20/06/050201f20/06/050201f
20/06/050201ffinance21
 
dover news_72507_earnings
dover news_72507_earningsdover news_72507_earnings
dover news_72507_earningsfinance30
 
walt disney Quarter 2007 1st
walt disney   Quarter 2007 1stwalt disney   Quarter 2007 1st
walt disney Quarter 2007 1stfinance7
 
allstate Quarterly Investor Information 2002 2nd
allstate Quarterly Investor Information 2002 2nd allstate Quarterly Investor Information 2002 2nd
allstate Quarterly Investor Information 2002 2nd finance7
 
caterpillar Quarterly Releases1Q08 Cat Financial Results
caterpillar Quarterly Releases1Q08 Cat Financial Resultscaterpillar Quarterly Releases1Q08 Cat Financial Results
caterpillar Quarterly Releases1Q08 Cat Financial Resultsfinance5
 
quest diagnostics 99annualreport
quest diagnostics 99annualreportquest diagnostics 99annualreport
quest diagnostics 99annualreportfinance34
 
news corp 2nd Qtr - FY09 - December 31, 2008 - US Dollars
news corp 2nd Qtr - FY09 - December 31, 2008 - US Dollarsnews corp 2nd Qtr - FY09 - December 31, 2008 - US Dollars
news corp 2nd Qtr - FY09 - December 31, 2008 - US Dollarsfinance9
 
4 q08 presentation
4 q08 presentation4 q08 presentation
4 q08 presentationEquatorial
 

What's hot (17)

hsbc Cover of 2008 Interim Results slide presentation Download 2008 Interi...
hsbc Cover of 2008 Interim Results slide presentation 	  Download 2008 Interi...hsbc Cover of 2008 Interim Results slide presentation 	  Download 2008 Interi...
hsbc Cover of 2008 Interim Results slide presentation Download 2008 Interi...
 
duke energy 1Q 07_Slides
duke energy 1Q 07_Slidesduke energy 1Q 07_Slides
duke energy 1Q 07_Slides
 
aon 2Q 08 Earnings Release
aon  2Q 08 Earnings Releaseaon  2Q 08 Earnings Release
aon 2Q 08 Earnings Release
 
el paso 08_072QEarnings
el paso  08_072QEarningsel paso  08_072QEarnings
el paso 08_072QEarnings
 
progress energy Q2 2005 earnings release
progress energy Q2 2005 earnings releaseprogress energy Q2 2005 earnings release
progress energy Q2 2005 earnings release
 
clearchannel 35
clearchannel 35clearchannel 35
clearchannel 35
 
northrop grumman Earnings Announcement 2007 4th
northrop grumman Earnings Announcement 2007 4th northrop grumman Earnings Announcement 2007 4th
northrop grumman Earnings Announcement 2007 4th
 
energyfutureholdings TXUQ3_02
energyfutureholdings TXUQ3_02energyfutureholdings TXUQ3_02
energyfutureholdings TXUQ3_02
 
walt disney Quarter 2008 3rd
walt disney   Quarter 2008 3rdwalt disney   Quarter 2008 3rd
walt disney Quarter 2008 3rd
 
20/06/050201f
20/06/050201f20/06/050201f
20/06/050201f
 
dover news_72507_earnings
dover news_72507_earningsdover news_72507_earnings
dover news_72507_earnings
 
walt disney Quarter 2007 1st
walt disney   Quarter 2007 1stwalt disney   Quarter 2007 1st
walt disney Quarter 2007 1st
 
allstate Quarterly Investor Information 2002 2nd
allstate Quarterly Investor Information 2002 2nd allstate Quarterly Investor Information 2002 2nd
allstate Quarterly Investor Information 2002 2nd
 
caterpillar Quarterly Releases1Q08 Cat Financial Results
caterpillar Quarterly Releases1Q08 Cat Financial Resultscaterpillar Quarterly Releases1Q08 Cat Financial Results
caterpillar Quarterly Releases1Q08 Cat Financial Results
 
quest diagnostics 99annualreport
quest diagnostics 99annualreportquest diagnostics 99annualreport
quest diagnostics 99annualreport
 
news corp 2nd Qtr - FY09 - December 31, 2008 - US Dollars
news corp 2nd Qtr - FY09 - December 31, 2008 - US Dollarsnews corp 2nd Qtr - FY09 - December 31, 2008 - US Dollars
news corp 2nd Qtr - FY09 - December 31, 2008 - US Dollars
 
4 q08 presentation
4 q08 presentation4 q08 presentation
4 q08 presentation
 

Viewers also liked

162 clearchanne
162  clearchanne162  clearchanne
162 clearchannefinance31
 
166 clearchanne
166  clearchanne166  clearchanne
166 clearchannefinance31
 
257 clearchanne
257  clearchanne257  clearchanne
257 clearchannefinance31
 
170 clearchanne
170  clearchanne170  clearchanne
170 clearchannefinance31
 
clearchannel 229
clearchannel  229clearchannel  229
clearchannel 229finance31
 

Viewers also liked (6)

162 clearchanne
162  clearchanne162  clearchanne
162 clearchanne
 
VF2003AR
VF2003ARVF2003AR
VF2003AR
 
166 clearchanne
166  clearchanne166  clearchanne
166 clearchanne
 
257 clearchanne
257  clearchanne257  clearchanne
257 clearchanne
 
170 clearchanne
170  clearchanne170  clearchanne
170 clearchanne
 
clearchannel 229
clearchannel  229clearchannel  229
clearchannel 229
 

Similar to clearchannel 298

2Q 2008 Earnings Release
2Q 2008 Earnings Release2Q 2008 Earnings Release
2Q 2008 Earnings Releasefinance19
 
2Q 2008 Earnings Release
2Q  2008 Earnings Release2Q  2008 Earnings Release
2Q 2008 Earnings Releasefinance19
 
The blackstone group quarterly reports
The blackstone group quarterly reportsThe blackstone group quarterly reports
The blackstone group quarterly reportsrynbouc
 
CBS 3Q 2008 Earnings Release
CBS 3Q 2008 Earnings ReleaseCBS 3Q 2008 Earnings Release
CBS 3Q 2008 Earnings Releasefinance19
 
raytheon Q4 Earnings Presentation
raytheon Q4 Earnings Presentationraytheon Q4 Earnings Presentation
raytheon Q4 Earnings Presentationfinance12
 
merck 3Q08 Earnings Release
merck  	3Q08 Earnings Release merck  	3Q08 Earnings Release
merck 3Q08 Earnings Release finance11
 
merck 3Q08 Earnings Announcement
merck 3Q08 Earnings Announcementmerck 3Q08 Earnings Announcement
merck 3Q08 Earnings Announcementfinance11
 
ameriprise 2Q07_Release
ameriprise 2Q07_Releaseameriprise 2Q07_Release
ameriprise 2Q07_Releasefinance43
 
northrop grumman Earnings Announcement 2007 2nd
northrop grumman Earnings Announcement 2007 2ndnorthrop grumman Earnings Announcement 2007 2nd
northrop grumman Earnings Announcement 2007 2ndfinance8
 
clearchannel 22
clearchannel 22clearchannel 22
clearchannel 22finance31
 
raytheon Q4 Earnings Presentation
raytheon Q4 Earnings Presentationraytheon Q4 Earnings Presentation
raytheon Q4 Earnings Presentationfinance12
 
time warner Q3 2008 Earnings
time warner Q3 2008 Earningstime warner Q3 2008 Earnings
time warner Q3 2008 Earningsfinance5
 
Q4 2007 Earnings Press Release and Financial Tables
Q4 2007 Earnings Press Release and Financial TablesQ4 2007 Earnings Press Release and Financial Tables
Q4 2007 Earnings Press Release and Financial Tablesfinance7
 
news corp 4th Qtr - FY04 - June 30, 2004
news corp 4th Qtr - FY04 - June 30, 2004 news corp 4th Qtr - FY04 - June 30, 2004
news corp 4th Qtr - FY04 - June 30, 2004 finance9
 
raytheon Q4 Earnings Presentation
raytheon Q4 Earnings Presentationraytheon Q4 Earnings Presentation
raytheon Q4 Earnings Presentationfinance12
 
cit 2002%20Q3%20Fiscal%20year%20end
cit 2002%20Q3%20Fiscal%20year%20endcit 2002%20Q3%20Fiscal%20year%20end
cit 2002%20Q3%20Fiscal%20year%20endfinance28
 
el paso 08_072QEarnings
el paso  08_072QEarningsel paso  08_072QEarnings
el paso 08_072QEarningsfinance49
 
clearchannel 253
clearchannel 253clearchannel 253
clearchannel 253finance31
 

Similar to clearchannel 298 (20)

2Q 2008 Earnings Release
2Q 2008 Earnings Release2Q 2008 Earnings Release
2Q 2008 Earnings Release
 
2Q 2008 Earnings Release
2Q  2008 Earnings Release2Q  2008 Earnings Release
2Q 2008 Earnings Release
 
The blackstone group quarterly reports
The blackstone group quarterly reportsThe blackstone group quarterly reports
The blackstone group quarterly reports
 
CBS 3Q 2008 Earnings Release
CBS 3Q 2008 Earnings ReleaseCBS 3Q 2008 Earnings Release
CBS 3Q 2008 Earnings Release
 
raytheon Q4 Earnings Presentation
raytheon Q4 Earnings Presentationraytheon Q4 Earnings Presentation
raytheon Q4 Earnings Presentation
 
HSBC 2008 Interim Results media Release
HSBC   2008 Interim Results media ReleaseHSBC   2008 Interim Results media Release
HSBC 2008 Interim Results media Release
 
merck 3Q08 Earnings Release
merck  	3Q08 Earnings Release merck  	3Q08 Earnings Release
merck 3Q08 Earnings Release
 
merck 3Q08 Earnings Announcement
merck 3Q08 Earnings Announcementmerck 3Q08 Earnings Announcement
merck 3Q08 Earnings Announcement
 
ameriprise 2Q07_Release
ameriprise 2Q07_Releaseameriprise 2Q07_Release
ameriprise 2Q07_Release
 
northrop grumman Earnings Announcement 2007 2nd
northrop grumman Earnings Announcement 2007 2ndnorthrop grumman Earnings Announcement 2007 2nd
northrop grumman Earnings Announcement 2007 2nd
 
Q1 2009 Earning Report of Qlt Inc.
Q1 2009 Earning Report of Qlt Inc.Q1 2009 Earning Report of Qlt Inc.
Q1 2009 Earning Report of Qlt Inc.
 
clearchannel 22
clearchannel 22clearchannel 22
clearchannel 22
 
raytheon Q4 Earnings Presentation
raytheon Q4 Earnings Presentationraytheon Q4 Earnings Presentation
raytheon Q4 Earnings Presentation
 
time warner Q3 2008 Earnings
time warner Q3 2008 Earningstime warner Q3 2008 Earnings
time warner Q3 2008 Earnings
 
Q4 2007 Earnings Press Release and Financial Tables
Q4 2007 Earnings Press Release and Financial TablesQ4 2007 Earnings Press Release and Financial Tables
Q4 2007 Earnings Press Release and Financial Tables
 
news corp 4th Qtr - FY04 - June 30, 2004
news corp 4th Qtr - FY04 - June 30, 2004 news corp 4th Qtr - FY04 - June 30, 2004
news corp 4th Qtr - FY04 - June 30, 2004
 
raytheon Q4 Earnings Presentation
raytheon Q4 Earnings Presentationraytheon Q4 Earnings Presentation
raytheon Q4 Earnings Presentation
 
cit 2002%20Q3%20Fiscal%20year%20end
cit 2002%20Q3%20Fiscal%20year%20endcit 2002%20Q3%20Fiscal%20year%20end
cit 2002%20Q3%20Fiscal%20year%20end
 
el paso 08_072QEarnings
el paso  08_072QEarningsel paso  08_072QEarnings
el paso 08_072QEarnings
 
clearchannel 253
clearchannel 253clearchannel 253
clearchannel 253
 

More from finance31

western resources AReport
western resources AReportwestern resources AReport
western resources AReportfinance31
 
western resources a_ar2006final
western resources a_ar2006finalwestern resources a_ar2006final
western resources a_ar2006finalfinance31
 
western resources _ar2007
western resources _ar2007western resources _ar2007
western resources _ar2007finance31
 
c.h. robinson worldwide_ar07a
c.h. robinson worldwide_ar07ac.h. robinson worldwide_ar07a
c.h. robinson worldwide_ar07afinance31
 
c.h. robinson worldwide10K_2007
c.h. robinson worldwide10K_2007c.h. robinson worldwide10K_2007
c.h. robinson worldwide10K_2007finance31
 
c.h. robinson worldwideproxy_2008
c.h. robinson worldwideproxy_2008c.h. robinson worldwideproxy_2008
c.h. robinson worldwideproxy_2008finance31
 
KBHOME_q103_10q
KBHOME_q103_10qKBHOME_q103_10q
KBHOME_q103_10qfinance31
 
KBHOME_DRSBOOKLET_2005Version
KBHOME_DRSBOOKLET_2005VersionKBHOME_DRSBOOKLET_2005Version
KBHOME_DRSBOOKLET_2005Versionfinance31
 
KBHOME_letter
KBHOME_letterKBHOME_letter
KBHOME_letterfinance31
 
KB_Home_Milestones_0808
KB_Home_Milestones_0808KB_Home_Milestones_0808
KB_Home_Milestones_0808finance31
 
KBHOME_q103_10q
KBHOME_q103_10qKBHOME_q103_10q
KBHOME_q103_10qfinance31
 
KBHOME_q203_10q
KBHOME_q203_10qKBHOME_q203_10q
KBHOME_q203_10qfinance31
 
KBHOME_q203_10q
KBHOME_q203_10qKBHOME_q203_10q
KBHOME_q203_10qfinance31
 
KBHOME_q303_10q
KBHOME_q303_10qKBHOME_q303_10q
KBHOME_q303_10qfinance31
 
KBHOME_q303_10q
KBHOME_q303_10qKBHOME_q303_10q
KBHOME_q303_10qfinance31
 
KBHOME_q20410q
KBHOME_q20410qKBHOME_q20410q
KBHOME_q20410qfinance31
 

More from finance31 (20)

western resources AReport
western resources AReportwestern resources AReport
western resources AReport
 
western resources a_ar2006final
western resources a_ar2006finalwestern resources a_ar2006final
western resources a_ar2006final
 
western resources _ar2007
western resources _ar2007western resources _ar2007
western resources _ar2007
 
c.h. robinson worldwide_ar07a
c.h. robinson worldwide_ar07ac.h. robinson worldwide_ar07a
c.h. robinson worldwide_ar07a
 
c.h. robinson worldwide10K_2007
c.h. robinson worldwide10K_2007c.h. robinson worldwide10K_2007
c.h. robinson worldwide10K_2007
 
c.h. robinson worldwideproxy_2008
c.h. robinson worldwideproxy_2008c.h. robinson worldwideproxy_2008
c.h. robinson worldwideproxy_2008
 
chrw ar07a
chrw ar07achrw ar07a
chrw ar07a
 
chrw ar07a
chrw ar07achrw ar07a
chrw ar07a
 
KBHOME_q103_10q
KBHOME_q103_10qKBHOME_q103_10q
KBHOME_q103_10q
 
KBHOME_DRSBOOKLET_2005Version
KBHOME_DRSBOOKLET_2005VersionKBHOME_DRSBOOKLET_2005Version
KBHOME_DRSBOOKLET_2005Version
 
KBHOME_letter
KBHOME_letterKBHOME_letter
KBHOME_letter
 
KB_Home_Milestones_0808
KB_Home_Milestones_0808KB_Home_Milestones_0808
KB_Home_Milestones_0808
 
KBHOME_q103_10q
KBHOME_q103_10qKBHOME_q103_10q
KBHOME_q103_10q
 
KBHOME_q203_10q
KBHOME_q203_10qKBHOME_q203_10q
KBHOME_q203_10q
 
KBHOME_q203_10q
KBHOME_q203_10qKBHOME_q203_10q
KBHOME_q203_10q
 
KBHOME_q303_10q
KBHOME_q303_10qKBHOME_q303_10q
KBHOME_q303_10q
 
KBHOME_q303_10q
KBHOME_q303_10qKBHOME_q303_10q
KBHOME_q303_10q
 
KB10Q
KB10QKB10Q
KB10Q
 
KBHOME_q20410q
KBHOME_q20410qKBHOME_q20410q
KBHOME_q20410q
 
KB10Q
KB10QKB10Q
KB10Q
 

Recently uploaded

Independent Call Girl Number in Kurla Mumbai📲 Pooja Nehwal 9892124323 💞 Full ...
Independent Call Girl Number in Kurla Mumbai📲 Pooja Nehwal 9892124323 💞 Full ...Independent Call Girl Number in Kurla Mumbai📲 Pooja Nehwal 9892124323 💞 Full ...
Independent Call Girl Number in Kurla Mumbai📲 Pooja Nehwal 9892124323 💞 Full ...Pooja Nehwal
 
00_Main ppt_MeetupDORA&CyberSecurity.pptx
00_Main ppt_MeetupDORA&CyberSecurity.pptx00_Main ppt_MeetupDORA&CyberSecurity.pptx
00_Main ppt_MeetupDORA&CyberSecurity.pptxFinTech Belgium
 
VIP Call Girls Service Dilsukhnagar Hyderabad Call +91-8250192130
VIP Call Girls Service Dilsukhnagar Hyderabad Call +91-8250192130VIP Call Girls Service Dilsukhnagar Hyderabad Call +91-8250192130
VIP Call Girls Service Dilsukhnagar Hyderabad Call +91-8250192130Suhani Kapoor
 
The Economic History of the U.S. Lecture 18.pdf
The Economic History of the U.S. Lecture 18.pdfThe Economic History of the U.S. Lecture 18.pdf
The Economic History of the U.S. Lecture 18.pdfGale Pooley
 
Vip B Aizawl Call Girls #9907093804 Contact Number Escorts Service Aizawl
Vip B Aizawl Call Girls #9907093804 Contact Number Escorts Service AizawlVip B Aizawl Call Girls #9907093804 Contact Number Escorts Service Aizawl
Vip B Aizawl Call Girls #9907093804 Contact Number Escorts Service Aizawlmakika9823
 
Best VIP Call Girls Noida Sector 18 Call Me: 8448380779
Best VIP Call Girls Noida Sector 18 Call Me: 8448380779Best VIP Call Girls Noida Sector 18 Call Me: 8448380779
Best VIP Call Girls Noida Sector 18 Call Me: 8448380779Delhi Call girls
 
06_Joeri Van Speybroek_Dell_MeetupDora&Cybersecurity.pdf
06_Joeri Van Speybroek_Dell_MeetupDora&Cybersecurity.pdf06_Joeri Van Speybroek_Dell_MeetupDora&Cybersecurity.pdf
06_Joeri Van Speybroek_Dell_MeetupDora&Cybersecurity.pdfFinTech Belgium
 
Monthly Market Risk Update: April 2024 [SlideShare]
Monthly Market Risk Update: April 2024 [SlideShare]Monthly Market Risk Update: April 2024 [SlideShare]
Monthly Market Risk Update: April 2024 [SlideShare]Commonwealth
 
03_Emmanuel Ndiaye_Degroof Petercam.pptx
03_Emmanuel Ndiaye_Degroof Petercam.pptx03_Emmanuel Ndiaye_Degroof Petercam.pptx
03_Emmanuel Ndiaye_Degroof Petercam.pptxFinTech Belgium
 
Solution Manual for Principles of Corporate Finance 14th Edition by Richard B...
Solution Manual for Principles of Corporate Finance 14th Edition by Richard B...Solution Manual for Principles of Corporate Finance 14th Edition by Richard B...
Solution Manual for Principles of Corporate Finance 14th Edition by Richard B...ssifa0344
 
How Automation is Driving Efficiency Through the Last Mile of Reporting
How Automation is Driving Efficiency Through the Last Mile of ReportingHow Automation is Driving Efficiency Through the Last Mile of Reporting
How Automation is Driving Efficiency Through the Last Mile of ReportingAggregage
 
The Economic History of the U.S. Lecture 19.pdf
The Economic History of the U.S. Lecture 19.pdfThe Economic History of the U.S. Lecture 19.pdf
The Economic History of the U.S. Lecture 19.pdfGale Pooley
 
VIP Kolkata Call Girl Serampore 👉 8250192130 Available With Room
VIP Kolkata Call Girl Serampore 👉 8250192130  Available With RoomVIP Kolkata Call Girl Serampore 👉 8250192130  Available With Room
VIP Kolkata Call Girl Serampore 👉 8250192130 Available With Roomdivyansh0kumar0
 
VVIP Pune Call Girls Katraj (7001035870) Pune Escorts Nearby with Complete Sa...
VVIP Pune Call Girls Katraj (7001035870) Pune Escorts Nearby with Complete Sa...VVIP Pune Call Girls Katraj (7001035870) Pune Escorts Nearby with Complete Sa...
VVIP Pune Call Girls Katraj (7001035870) Pune Escorts Nearby with Complete Sa...Call Girls in Nagpur High Profile
 
High Class Call Girls Nagpur Grishma Call 7001035870 Meet With Nagpur Escorts
High Class Call Girls Nagpur Grishma Call 7001035870 Meet With Nagpur EscortsHigh Class Call Girls Nagpur Grishma Call 7001035870 Meet With Nagpur Escorts
High Class Call Girls Nagpur Grishma Call 7001035870 Meet With Nagpur Escortsranjana rawat
 
05_Annelore Lenoir_Docbyte_MeetupDora&Cybersecurity.pptx
05_Annelore Lenoir_Docbyte_MeetupDora&Cybersecurity.pptx05_Annelore Lenoir_Docbyte_MeetupDora&Cybersecurity.pptx
05_Annelore Lenoir_Docbyte_MeetupDora&Cybersecurity.pptxFinTech Belgium
 
Instant Issue Debit Cards - High School Spirit
Instant Issue Debit Cards - High School SpiritInstant Issue Debit Cards - High School Spirit
Instant Issue Debit Cards - High School Spiritegoetzinger
 
Booking open Available Pune Call Girls Shivane 6297143586 Call Hot Indian Gi...
Booking open Available Pune Call Girls Shivane  6297143586 Call Hot Indian Gi...Booking open Available Pune Call Girls Shivane  6297143586 Call Hot Indian Gi...
Booking open Available Pune Call Girls Shivane 6297143586 Call Hot Indian Gi...Call Girls in Nagpur High Profile
 
Russian Call Girls In Gtb Nagar (Delhi) 9711199012 💋✔💕😘 Naughty Call Girls Se...
Russian Call Girls In Gtb Nagar (Delhi) 9711199012 💋✔💕😘 Naughty Call Girls Se...Russian Call Girls In Gtb Nagar (Delhi) 9711199012 💋✔💕😘 Naughty Call Girls Se...
Russian Call Girls In Gtb Nagar (Delhi) 9711199012 💋✔💕😘 Naughty Call Girls Se...shivangimorya083
 

Recently uploaded (20)

Independent Call Girl Number in Kurla Mumbai📲 Pooja Nehwal 9892124323 💞 Full ...
Independent Call Girl Number in Kurla Mumbai📲 Pooja Nehwal 9892124323 💞 Full ...Independent Call Girl Number in Kurla Mumbai📲 Pooja Nehwal 9892124323 💞 Full ...
Independent Call Girl Number in Kurla Mumbai📲 Pooja Nehwal 9892124323 💞 Full ...
 
00_Main ppt_MeetupDORA&CyberSecurity.pptx
00_Main ppt_MeetupDORA&CyberSecurity.pptx00_Main ppt_MeetupDORA&CyberSecurity.pptx
00_Main ppt_MeetupDORA&CyberSecurity.pptx
 
VIP Call Girls Service Dilsukhnagar Hyderabad Call +91-8250192130
VIP Call Girls Service Dilsukhnagar Hyderabad Call +91-8250192130VIP Call Girls Service Dilsukhnagar Hyderabad Call +91-8250192130
VIP Call Girls Service Dilsukhnagar Hyderabad Call +91-8250192130
 
The Economic History of the U.S. Lecture 18.pdf
The Economic History of the U.S. Lecture 18.pdfThe Economic History of the U.S. Lecture 18.pdf
The Economic History of the U.S. Lecture 18.pdf
 
Vip B Aizawl Call Girls #9907093804 Contact Number Escorts Service Aizawl
Vip B Aizawl Call Girls #9907093804 Contact Number Escorts Service AizawlVip B Aizawl Call Girls #9907093804 Contact Number Escorts Service Aizawl
Vip B Aizawl Call Girls #9907093804 Contact Number Escorts Service Aizawl
 
Best VIP Call Girls Noida Sector 18 Call Me: 8448380779
Best VIP Call Girls Noida Sector 18 Call Me: 8448380779Best VIP Call Girls Noida Sector 18 Call Me: 8448380779
Best VIP Call Girls Noida Sector 18 Call Me: 8448380779
 
06_Joeri Van Speybroek_Dell_MeetupDora&Cybersecurity.pdf
06_Joeri Van Speybroek_Dell_MeetupDora&Cybersecurity.pdf06_Joeri Van Speybroek_Dell_MeetupDora&Cybersecurity.pdf
06_Joeri Van Speybroek_Dell_MeetupDora&Cybersecurity.pdf
 
Commercial Bank Economic Capsule - April 2024
Commercial Bank Economic Capsule - April 2024Commercial Bank Economic Capsule - April 2024
Commercial Bank Economic Capsule - April 2024
 
Monthly Market Risk Update: April 2024 [SlideShare]
Monthly Market Risk Update: April 2024 [SlideShare]Monthly Market Risk Update: April 2024 [SlideShare]
Monthly Market Risk Update: April 2024 [SlideShare]
 
03_Emmanuel Ndiaye_Degroof Petercam.pptx
03_Emmanuel Ndiaye_Degroof Petercam.pptx03_Emmanuel Ndiaye_Degroof Petercam.pptx
03_Emmanuel Ndiaye_Degroof Petercam.pptx
 
Solution Manual for Principles of Corporate Finance 14th Edition by Richard B...
Solution Manual for Principles of Corporate Finance 14th Edition by Richard B...Solution Manual for Principles of Corporate Finance 14th Edition by Richard B...
Solution Manual for Principles of Corporate Finance 14th Edition by Richard B...
 
How Automation is Driving Efficiency Through the Last Mile of Reporting
How Automation is Driving Efficiency Through the Last Mile of ReportingHow Automation is Driving Efficiency Through the Last Mile of Reporting
How Automation is Driving Efficiency Through the Last Mile of Reporting
 
The Economic History of the U.S. Lecture 19.pdf
The Economic History of the U.S. Lecture 19.pdfThe Economic History of the U.S. Lecture 19.pdf
The Economic History of the U.S. Lecture 19.pdf
 
VIP Kolkata Call Girl Serampore 👉 8250192130 Available With Room
VIP Kolkata Call Girl Serampore 👉 8250192130  Available With RoomVIP Kolkata Call Girl Serampore 👉 8250192130  Available With Room
VIP Kolkata Call Girl Serampore 👉 8250192130 Available With Room
 
VVIP Pune Call Girls Katraj (7001035870) Pune Escorts Nearby with Complete Sa...
VVIP Pune Call Girls Katraj (7001035870) Pune Escorts Nearby with Complete Sa...VVIP Pune Call Girls Katraj (7001035870) Pune Escorts Nearby with Complete Sa...
VVIP Pune Call Girls Katraj (7001035870) Pune Escorts Nearby with Complete Sa...
 
High Class Call Girls Nagpur Grishma Call 7001035870 Meet With Nagpur Escorts
High Class Call Girls Nagpur Grishma Call 7001035870 Meet With Nagpur EscortsHigh Class Call Girls Nagpur Grishma Call 7001035870 Meet With Nagpur Escorts
High Class Call Girls Nagpur Grishma Call 7001035870 Meet With Nagpur Escorts
 
05_Annelore Lenoir_Docbyte_MeetupDora&Cybersecurity.pptx
05_Annelore Lenoir_Docbyte_MeetupDora&Cybersecurity.pptx05_Annelore Lenoir_Docbyte_MeetupDora&Cybersecurity.pptx
05_Annelore Lenoir_Docbyte_MeetupDora&Cybersecurity.pptx
 
Instant Issue Debit Cards - High School Spirit
Instant Issue Debit Cards - High School SpiritInstant Issue Debit Cards - High School Spirit
Instant Issue Debit Cards - High School Spirit
 
Booking open Available Pune Call Girls Shivane 6297143586 Call Hot Indian Gi...
Booking open Available Pune Call Girls Shivane  6297143586 Call Hot Indian Gi...Booking open Available Pune Call Girls Shivane  6297143586 Call Hot Indian Gi...
Booking open Available Pune Call Girls Shivane 6297143586 Call Hot Indian Gi...
 
Russian Call Girls In Gtb Nagar (Delhi) 9711199012 💋✔💕😘 Naughty Call Girls Se...
Russian Call Girls In Gtb Nagar (Delhi) 9711199012 💋✔💕😘 Naughty Call Girls Se...Russian Call Girls In Gtb Nagar (Delhi) 9711199012 💋✔💕😘 Naughty Call Girls Se...
Russian Call Girls In Gtb Nagar (Delhi) 9711199012 💋✔💕😘 Naughty Call Girls Se...
 

clearchannel 298

  • 1. CC Media Holdings, Inc. Reports Second Quarter 2008 Results ---------------- San Antonio, Texas August 11, 2008…CC Media Holdings, Inc. (OTCBB: CCMO) today reported results for its second quarter ended June 30, 2008. CC Media Holdings, Inc. is the new parent company of Clear Channel Communications, Inc. CC Media Holdings, Inc. was formed in May 2007 by private equity funds sponsored by Bain Capital Partners, LLC and Thomas H. Lee Partners, L.P. for the purpose of acquiring the business of Clear Channel Communications, Inc. The acquisition was completed on July 30, 2008, pursuant to the Agreement and Plan of Merger, dated November 16, 2006, as amended on April 18, 2007, May 17, 2007 and May 13, 2008. Prior to the consummation of its acquisition of Clear Channel on July 30, 2008, the Company had not conducted any activities, other than activities incident to its formation and in connection with the acquisition, and did not have any assets or liabilities, other than as related to the acquisition. Subsequent to the acquisition, Clear Channel became an indirect, wholly-owned subsidiary of the Company and the business of the Company became that of Clear Channel and its subsidiaries. The Company will account for its acquisition of Clear Channel as a purchase business combination in conformity with Statement of Financial Accounting Standards No. 141, Business Combinations, and Emerging Issues Task Force Issue 88-16, Basis in Leveraged Buyout Transactions. The Company expects to allocate a portion of the consideration paid to the assets and liabilities acquired at their respective fair values with the remaining portion recorded at the continuing shareholders basis. Any excess consideration after this allocation will be recorded as goodwill. The Company is currently in the process of obtaining third-party valuations of certain of the acquired assets and liabilities in order to allocate the purchase price. The Company will complete its purchase price allocation within one year of the closing of the acquisition. Certain information in this earnings report is presented using the results of operations and the historical basis of assets, liabilities and equity of Clear Channel as of June 30, 2008 and December 31, 2007. CC Media Holdings reported revenues of $1.83 billion in the second quarter of 2008, an increase of 2% from the $1.80 billion reported for the second quarter of 2007. Included in the Company‘s revenue is a $52.2 million increase due to movements in foreign exchange; strictly excluding the effects of these movements in foreign exchange, revenues would have declined 1%. See reconciliation of revenue excluding effects of foreign exchange to revenue at the end of this press release. The Company‘s operating expenses increased 6% to $1.19 billion during the second quarter of 2008 compared to 2007. Included in CC Media Holdings‘ 2008 expenses is a $41.1 million increase due to movements in foreign exchange. Strictly excluding the effects of these movements in foreign exchange in the 2008 expenses, expense growth would have been 2%. See reconciliation of expenses excluding effects of foreign exchange to expenses at the end of this press release. Also included in CC Media Holdings‘ 2008 operating expenses is approximately $8.0 million of non-cash compensation expense. This compares to non-cash compensation expense of $9.7 million in the second quarter of 2007. The Company‘s income before discontinued operations increased 28% to $277.3 million, as compared to $215.9 million for the same period in 2007. CC Media Holdings‘ diluted earnings before discontinued operations per share increased 27% to $0.56, compared to $0.44 for the same period in 2007. The Company‘s second quarter 2008 net income included an approximate $27.0 million nontaxable gain, or $0.05 per diluted share, on the termination of a forward exchange contract and the sale of the related shares. The gain was recorded in ―Gain on marketable securities‖. Excluding this one-time item, CC Media Holdings‘ second quarter 2008 income before discontinued operations would have been $250.3 1
  • 2. million, or $0.51 per diluted share. See reconciliation of net income and diluted earnings per share at the end of this press release. CC Media Holdings‘ OIBDAN (defined as Operating Income before Depreciation & amortization, Non- cash compensation expense, Merger costs and Gain on disposition of assets – net) was $604.7 million in the second quarter of 2008, a 7% decrease from 2007. See reconciliation of OIBDAN to net income at the end of this press release. Mark P. Mays, Chief Executive Officer of CC Media Holdings, commented, ――Results for the first half and second quarter of 2008 were impressive in the context of this challenging economic and advertising climate. We reported higher revenue and earnings per share for the second quarter and continued to outperform many in the media arena. Strong relative performance in both Outdoor and Radio are a testament to the wisdom of continuing to do what we do best. We exert strict cost discipline and invest in the growth drivers of our core businesses. As we enter the second half of the year with our merger closed, we are hopeful that our streamlined operations coupled with a concentration on growth and execution will enable us to continue to perform well, despite a difficult economic environment.‖ Merger Update Clear Channel held a special meeting of its shareholders on July 24, 2008, at which the proposed merger, as amended, was approved. The merger closed on July 30, 2008. Under the terms of the Merger Agreement, as amended, Clear Channel‘s shareholders received $36.00 in cash for each share they own. As an alternative to receiving the $36.00 per share cash consideration, Clear Channel‘s shareholders were offered the opportunity on a purely voluntary basis to exchange some or all of their shares of Clear Channel common stock on a one-for-one basis for shares of Class A common stock in the Company. Approximately 23.6 million shares were exchanged. Radio Divestitures Adjusted number of radio stations being marketed for sale (―Non-core‖ radio stations) 275 Non-core radio stations sold through June 30, 2008 (238) Remaining non-core radio stations at June 30, 2008 classified as discontinued operations 37 Non-core radio stations under definitive asset purchase agreements (34) Non-core radio stations being marketed for sale 3 On November 16, 2006, the Company announced plans to sell 448 non-core radio stations. The total number of stations was revised from 448 to 275 during the first quarter of 2008. Clear Channel sold 238 non-core radio stations, had definitive asset purchase agreements for 34 non-core radio stations and continued to market 3 non-core radio stations at June 30, 2008. These stations were classified as assets from discontinued operations in the Company‘s consolidated balance sheet and as discontinued operations in the consolidated financial statements as of and for the period ended June 30, 2008, for the period ended June 30, 2007 and as of December 31, 2007. Twenty-four stations that were under definitive asset purchase agreements were sold subsequent to June 30, 2008. There can be no assurance that any of the pending divestitures contemplated in this release will actually be consummated. 2
  • 3. Revenue, Direct Operating and SG&A Expenses, and OIBDAN by Division Three Months Ended % (In thousands) June 30, Change 2008 2007 Revenue Radio Broadcasting $ 891,483 $ 945,963 (6%) Outdoor Advertising 914,808 836,713 9% Other 52,381 52,514 (0%) Eliminations (27,594) (32,998) Consolidated revenue $1,831,078 $1,802,192 2% CC Media Holdings‘ second quarter 2008 revenue increased from foreign exchange movements of approximately $52.2 million as compared to the same period of 2007. Direct Operating and SG&A Expenses by Division Radio Broadcasting $ 531,291 $ 548,639 Less: Non-cash compensation expense (4,506) (6,676) 526,785 541,963 (3%) Outdoor Advertising 641,278 563,700 Less: Non-cash compensation expense (3,450) (2,995) 637,828 560,705 14% Other 44,244 44,104 — — Less: Non-cash compensation expense 44,244 44,104 0% Eliminations (27,594) (32,998) Plus: Non-cash compensation expense 7,956 9,671 Consolidated divisional operating expenses $1,189,219 $1,123,445 6% CC Media Holdings‘ second quarter 2008 direct operating and SG&A expenses increased from foreign exchange movements of approximately $41.1 million as compared to the same period of 2007. OIBDAN Radio Broadcasting $ 364,698 $ 404,000 (10%) Outdoor Advertising 276,980 276,008 0% Other 8,137 8,410 (3%) Corporate (45,138) (39,376) Consolidated OIBDAN $ 604,677 $ 649,042 (7%) See reconciliation of OIBDAN to net income at the end of this press release. Radio Broadcasting The Company‘s radio broadcasting revenue declined approximately $54.5 million in the second quarter of 2008 compared to the same period of the prior year. Decreases in local and national revenues were partially offset by increases in traffic and on-line revenues. Local and national revenues were down as a result of overall weakness in advertising. The Company‘s radio revenue experienced declines across all different sized markets and advertising categories including automotive, retail and consumer 3
  • 4. services. During the second quarter of 2008, the Company‘s total prime minutes sold and its prime average minute rate decreased compared to the second quarter of 2007. The average minute rate for the 60 second spots declined more than the average minute rate of the shorter duration spots during this period. Overall there was a decrease in operating expenses across the Company‘s radio markets with a decrease of approximately $17.3 million primarily from reduced advertising and promotion expenses and a decline in commission expenses associated with the revenue decline. The decrease was partially offset by an increase in syndicated radio programming expenses attributable mostly to contract talent payments. Outdoor Advertising The Company‗s outdoor advertising revenue increased 9% during the second quarter of 2008 when compared to the same period in 2007. Included in the 2008 results is an approximate $52.2 million increase related to foreign exchange when compared to 2007. Outdoor advertising expenses increased 14% when compared to the same period in 2007. Included in the 2008 results is an approximate $41.1 million increase related to foreign exchange when compared to 2007. Americas Outdoor Revenue increased approximately $8.1 million during the second quarter of 2008 compared to the second quarter of 2007, primarily from increases in airport and street furniture revenues as well as digital display revenue. The increase in street furniture revenue was primarily the result of new contracts and increased rates while the increase in airport revenue was due to new contracts and increased rates and occupancy. Digital display revenue growth was primarily attributable to an increase in digital displays. Partially offsetting the revenue increase was a decline in bulletin and poster revenue. The decline in bulletin revenue was primarily attributable to decreased occupancy while the decline in poster revenue was primarily attributable to a decrease in rate. Leading advertising categories during the quarter were retail, amusements and financial services which all experienced revenue growth for the second quarter of 2008 when compared to the second quarter of 2007. Revenue growth was led by Los Angeles, Boston, Latin America and Canada. The Company‘s Americas operating expenses increased $20.1 million primarily from higher site lease expenses of $15.7 million mostly attributable to new taxi, airport and street furniture contracts. Administrative expenses associated with various legal expenses also increased during the quarter. o International Outdoor Revenue increased approximately $70.0 million, with roughly $50.1 million from movements in foreign exchange. The remainder of the revenue growth was primarily attributable to strong growth in China, Turkey and Australia and due to the Company‘s Romanian operations which were acquired at the end of the second quarter of 2007. Growth was partially offset by revenue declines in France, due to the loss of a contract for advertising on railways, and the United Kingdom. Operating expenses increased $57.5 million. Included in the increase is approximately $39.5 million related to movements in foreign exchange. The remaining increase in operating expenses was primarily attributable to an increase in site lease expenses and other operating and selling expenses associated with the increase in revenue. 4
  • 5. FAS No. 123 (R): Share-Based Payment (“FAS 123(R)”) The following table details non-cash compensation expense, which represents employee compensation costs related to stock option grants and restricted stock awards, for the second quarter of 2008 and 2007: Three Months Ended (In thousands) June 30, 2008 2007 Direct operating expense $ 4,583 $ 5,172 SG&A 3,373 4,499 Corporate 2,836 3,668 Total non-cash compensation $ 10,792 $ 13,339 Current Information and Expectations The Company has previously provided information regarding its revenue pacings and certain expectations related to 2008 operating results. That information was last provided on May 9, 2008 and has not been updated. The Company is not providing such information in this release and does not anticipate providing this information in the future. The Company will not update or revise any previously disclosed information. Investors are cautioned to no longer rely on such prior information given the passage of time and other reasons discussed in the Company‘s reports filed with the SEC. Future results could differ materially than the forward-looking information previously disclosed. The Company periodically reviews its disclosure practices in the ordinary course of its business and management determined to cease providing this information after taking into consideration a number of factors. There should be nothing read into the timing of this change in policy, nor should any inferences be drawn relative to internal or external economic factors. 5
  • 6. TABLE 1 - Financial Highlights of CC Media Holdings, Inc. and Subsidiaries - Unaudited Three Months Ended June 30, % (In thousands, except per share data) 2008 2007 Change Revenue $1,831,078 $1,802,192 2% Direct operating expenses 743,485 676,255 Selling, general and administrative expenses 445,734 447,190 Corporate expenses 47,974 43,044 Merger costs 7,456 2,684 Depreciation and amortization 142,188 141,309 Gain on disposition of assets – net 17,354 3,996 Operating Income 461,595 495,706 (7%) Interest expense 82,175 116,422 Gain (loss) on marketable securities 27,736 (410) Equity in earnings of nonconsolidated affiliates 8,990 11,435 Other income (expense) – net (6,086) 340 Income before income taxes, minority interest and discontinued operations 410,060 390,649 Income tax expense: Current 101,047 122,071 Deferred 24,090 37,715 Income tax expense 125,137 159,786 Minority interest expense, net of tax 7,628 14,970 Income before discontinued operations 277,295 215,893 28% Income from discontinued operations 5,032 20,097 Net income $ 282,327 $ 235,990 20% Diluted earnings per share: Diluted earnings before discontinued operations per share $ .56 $ .44 27% $ .57 $ .48 19% Diluted earnings per share Weighted average shares outstanding – Diluted 496,887 495,688 Income Taxes The Company‘s effective tax rate for the three months ended June 30, 2008 was 30.5% as compared to 40.9% for the same period of the prior year. The decline was primarily due to the release of the valuation allowance on the capital loss carryforwards that were used to offset the taxable gain from the disposition of the Company‘s America Tower Corporation shares. 6
  • 7. TABLE 2 - Selected Balance Sheet Information - Unaudited Selected balance sheet information for 2008 and 2007 was: June 30, December 31, 2008 2007 (In millions) Cash $ 668.1 $ 145.1 Total Current Assets $ 2,908.9 $ 2,294.6 Net Property, Plant and Equipment $ 3,081.5 $ 3,050.4 Total Assets $ 19,078.4 $ 18,805.5 Current Liabilities (excluding current portion of long-term debt) $ 1,429.0 $ 1,453.1 Long-Term Debt (including current portion of long-term debt)* $ 5,772.3 $ 6,575.2 Shareholders‘ Equity $ 9,876.0 $ 8,797.5 * See Table 4 for a discussion of debt incurred in conjunction with the merger. TABLE 3 - Capital Expenditures - Unaudited Capital expenditures for the six months ended June 30, 2008 and 2007 were: June 30, 2008 June 30, 2007 (In millions) Non-revenue producing $ 81.8 $ 77.7 Revenue producing 129.9 75.3 Total capital expenditures $ 211.7 $ 153.0 The Company defines non-revenue producing capital expenditures as those expenditures that are required on a recurring basis. Revenue producing capital expenditures are discretionary capital investments for new revenue streams, similar to an acquisition. 7
  • 8. TABLE 4 – Post Merger Capital Structure - Unaudited In connection with the merger, the Company terminated its $1.75 billion multi-currency revolving credit facility and incurred new amounts of debt, including amounts outstanding under the Company‘s new senior secured credit facilities, its new receivables based credit facility and the new senior cash pay and senior toggle notes. Additionally, the Company repurchased $639.2 million aggregate principal amount of the AMFM Operating, Inc. 8% Senior Notes due 2008 pursuant to a tender offer and consent solicitation. On August 7, 2008, the Company announced that it commenced a cash tender offer and consent solicitation for its outstanding $750.0 million principal amount of 7.65% senior notes due 2010 on the terms and conditions set forth in the Offer to Purchase and Consent Solicitation Statement dated August 7, 2008. Immediately following the closing of the transaction, the Company has aggregate principal amount of debt outstanding of approximately $20.8 billion (and available and undrawn facilities of approximately $1.7 billion), the components of which are: (In thousands) Amount Term Loan A $ 1,331,500 Term Loan B 10,700,000 Term Loan C 695,879 — Delayed Draw Facility Receivables Based Facility 533,500 Revolving Credit Facility 80,000 Senior Cash Pay Notes 980,000 Senior Toggle Notes 1,330,000 Existing Clear Channel Senior Notes 5,025,000 Existing Clear Channel Subsidiary Debt 111,929 Total Indebtedness $20,787,808 In connection with the merger, the Company issued approximately 23.6 million shares of Class A common stock, approximately 0.6 million shares of Class B common stock and approximately 59.0 million shares of Class C common stock for a total of approximately 83.2 million shares. Every holder of shares of Class A common stock is entitled to one vote for each share of Class A common stock. Every holder of shares of Class B common stock is entitled to a number of votes per share equal to the number obtained by dividing (a) the sum of the total number of shares of Class B common stock outstanding as of the record date for such vote and the number of Class C common stock outstanding as of the record date for such vote by (b) the number of shares of Class B common stock outstanding as of the record date for such vote. Except as otherwise required by law, the holders of outstanding shares of Class C common stock are not entitled to any votes upon any questions presented to its stockholders. Except with respect to voting as described above, and as otherwise required by law, all shares of Class A common stock, Class B common stock and Class C common stock have the same powers, privileges, preferences and relative participating, optional or other special rights, and the qualifications, limitations or restrictions thereof, and will be identical to each other in all respects. Liquidity and Financial Position For the six months ended June 30, 2008, cash flow from operating activities was $686.0 million, cash flow used by investing activities was $178.1 million, cash flow used by financing activities was $998.7 million, and net cash provided by discontinued operations was $1.0 billion for a net increase in cash of $522.9 million. 8
  • 9. As of August 8, 2008, the Company had approximately $1.7 billion available on its bank revolving credit facility. The Company may utilize existing capacity under its bank revolving credit facility and other available funds for general working capital purposes including funding capital expenditures, acquisitions and the refinancing of certain public debt securities. 9
  • 10. Supplemental Disclosure Regarding Non-GAAP Financial Information Operating Income before Depreciation and Amortization (D&A), Non-cash Compensation Expense and Gain on Disposition of Assets – Net (OIBDAN) The following tables set forth the Company‘s OIBDAN for the three months ended June 30, 2008 and 2007. The Company defines OIBDAN as net income adjusted to exclude non-cash compensation expense and the following line items presented in its Statement of Operations: Discontinued operations; Minority interest, net of tax; Income tax benefit (expense); Other income (expense) - net; Equity in earnings of nonconsolidated affiliates; Gain (loss) on marketable securities; Interest expense; Gain on disposition of assets - net D&A; and merger costs. The Company uses OIBDAN, among other things, to evaluate the Company's operating performance. This measure is among the primary measures used by management for planning and forecasting of future periods, as well as for measuring performance for compensation of executives and other members of management. This measure is an important indicator of the Company's operational strength and performance of its business because it provides a link between profitability and cash flows from operating activities. It is also a primary measure used by management in evaluating companies as potential acquisition targets. The Company believes the presentation of this measure is relevant and useful for investors because it allows investors to view performance in a manner similar to the method used by the Company's management. It helps improve investors‘ ability to understand the Company's operating performance and makes it easier to compare the Company's results with other companies that have different capital structures, stock option structures or tax rates. In addition, this measure is also among the primary measures used externally by the Company's investors, analysts and peers in its industry for purposes of valuation and comparing the operating performance of the Company to other companies in its industry. Additionally, the Company‘s bank credit facilities use this measure for compliance with leverage covenants. Since OIBDAN is not a measure calculated in accordance with GAAP, it should not be considered in isolation of, or as a substitute for, net income as an indicator of operating performance and may not be comparable to similarly titled measures employed by other companies. OIBDAN is not necessarily a measure of the Company's ability to fund its cash needs. As it excludes certain financial information compared with operating income and net income (loss), the most directly comparable GAAP financial measures, users of this financial information should consider the types of events and transactions, which are excluded. In addition, because a significant portion of the Company‘s advertising operations are conducted in foreign markets, principally France and the United Kingdom, management reviews the operating results from its foreign operations on a constant dollar basis. A constant dollar basis (i.e. a foreign currency adjustment is made to the 2008 actual foreign revenues and expenses at average 2007 foreign exchange rates) allows for comparison of operations independent of foreign exchange movements. As required by the SEC, the Company provides reconciliations below to the most directly comparable amounts reported under GAAP, including (i) OIBDAN for each segment to consolidated operating income; (ii) Revenue excluding foreign exchange effects to revenue; (iii) Expense excluding foreign exchange effects to expenses; (iv) OIBDAN to net income; and (v) Net income and diluted earnings per share excluding certain items discussed earlier. 10
  • 11. Gain on disposition of (In thousands) assets – net Non-cash Depreciation Operating compensation and and income (loss) expense amortization Merger costs OIBDAN Three Months Ended June 30, 2008 — Radio Broadcasting $ 339,177 $ 4,506 $ 21,015 $ $ 364,698 — Outdoor 168,766 3,450 104,764 276,980 — — Other (4,613) 12,750 8,137 Gain on disposition of assets – net — — — 17,354 (17,354) — — — Merger costs (7,456) 7,456 — Corporate (51,633) 2,836 3,659 (45,138) Consolidated $ 461,595 $ 10,792 $ 142,188 $ (9,898) $ 604,677 Three Months Ended June 30, 2007 — Radio Broadcasting $ 369,075 $ 6,676 $ 28,249 $ $ 404,000 — Outdoor 174,860 2,995 98,153 276,008 — — Other (2,407) 10,817 8,410 Gain on disposition of assets – net — — — 3,996 (3,996) — — — Merger costs (2,684) 2,684 — Corporate (47,134) 3,668 4,090 (39,376) Consolidated $ 495,706 $ 13,339 $ 141,309 $ (1,312) $ 649,042 11
  • 12. Reconciliation of Revenue excluding Foreign Exchange Effects to Revenue Three Months Ended % (In thousands) June 30, Change 2008 2007 Revenue $1,831,078 $1,802,192 2% — Less: Foreign exchange increase (52,224) Revenue excluding effects of foreign exchange $1,778,854 $1,802,192 (1%) Outdoor revenue $ 914,808 $ 836,713 9% — Less: Foreign exchange increase (52,224) Outdoor revenue excluding effects of foreign exchange $ 862,584 $ 836,713 3% International Outdoor revenue $ 529,830 $ 459,870 15% — Less: Foreign exchange increase (50,078) International Outdoor revenue excluding effects of foreign exchange $ 479,752 $ 459,870 4% Reconciliation of Expense (Direct Operating and SG&A Expenses) excluding Foreign Exchange Effects to Expense Three Months Ended % (In thousands) June 30, Change 2008 2007 Consolidated expense $1,189,219 $1,123,445 6% — Less: Foreign exchange increase (41,095) Consolidated expense excluding effects of foreign exchange $1,148,124 $1,123,445 2% Outdoor expense $ 641,278 $ 563,700 14% — Less: Foreign exchange increase (41,095) Outdoor expense excluding effects of foreign exchange $ 600,183 $ 563,700 6% International Outdoor expense $ 420,201 $ 362,690 16% — Less: Foreign exchange increase (39,427) International Outdoor expense excluding effects of foreign exchange $ 380,774 $ 362,690 5% 12
  • 13. Reconciliation of OIBDAN to Net income Three Months Ended % (In thousands) June 30, Change 2008 2007 OIBDAN $ 604,677 $ 649,042 (7%) Non-cash compensation expense 10,792 13,339 Depreciation & amortization 142,188 141,309 Merger costs 7,456 2,684 Gain on disposition of assets – net 17,354 3,996 Operating Income 461,595 495,706 (7%) Interest expense 82,175 116,422 Gain (loss) on marketable securities 27,736 (410) Equity in earnings of nonconsolidated affiliates 8,990 11,435 Other income (expense) – net (6,086) 340 Income before income taxes, minority interest and discontinued operations 410,060 390,649 Income tax expense: Current 101,047 122,071 Deferred 24,090 37,715 Income tax expense 125,137 159,786 Minority interest expense, net of tax 7,628 14,970 Income before discontinued operations 277,295 215,893 Income from discontinued operations 5,032 20,097 Net income $ 282,327 $ 235,990 Reconciliation of Net Income and Diluted Earnings per Share (“EPS”) Three Months Ended Three Months Ended (In millions, except per share data) June 30, 2008 June 30, 2007 Net Income EPS Net Income EPS Reported Amounts $ 282.3 $ .57 $ 236.0 $ .48 Discontinued operations (5.0) (.01) (20.1) (.04) — — Less: Gain on sale of shares (27.0) (.05) Amounts excluding certain items $ 250.3 $ .51 $ 215.9 $ .44 2007 Quarterly Information On May 30, 2008, Clear Channel Communications filed on Form 8-K revised financial statements. The financial statements were revised to reflect, for each of the quarters for the year ended December 31, 2007, the reclassification of the revenues and operating expenses of certain radio markets from discontinued operations to continuing operations in accordance with Statement of Financial Accounting Standards No. 144, Accounting for the Impairment or Disposal of Long-lived Assets (―Statement 144‖). The following table provides full year 2007 revenues, expenses and non-cash compensation by business segment and by quarter. 13
  • 14. Fiscal Year 2007 (in $000s) Net Revenue 1Q 2007 2Q 2007 3Q 2007 4Q 2007 FY 2007 Radio $799,201 $945,963 $909,643 $903,727 $3,558,534 Outdoor 690,856 836,713 817,541 936,726 3,281,836 45,674 55,352 54,164 207,704 Other 52,514 (30,654) (32,998) (31,371) (31,849) (126,872) Eliminations $1,505,077 $1,802,192 $1,751,165 $1,862,768 $6,921,202 Consolidated Direct and SG&A Expenses (Includes Non-Cash Compensation) 1Q 2007 2Q 2007 3Q 2007 4Q 2007 FY 2007 Radio $511,211 $548,639 $542,729 $570,470 $2,173,049 Outdoor 521,738 563,700 565,700 621,701 2,272,839 41,903 44,104 43,989 45,931 175,927 Other (30,654) (32,998) (31,371) (31,849) (126,872) Eliminations $1,044,198 $1,123,445 $1,121,047 $1,206,253 $4,494,943 Consolidated Non-Cash Compensation (Included in Direct and SG&A Expenses) 1Q 2007 2Q 2007 3Q 2007 4Q 2007 FY 2007 Radio $4,464 $6,676 $5,610 $5,476 $22,226 Outdoor 1,367 2,995 2,257 3,014 9,633 ------ ------- ------- ------ -------- Other $5,831 $9,671 $7,867 $8,490 $31,859 Consolidated 14
  • 15. About CC Media Holdings, Inc. CC Media Holdings, the new parent company of Clear Channel Communications, is a global media and entertainment company specializing in mobile and on-demand entertainment and information services for local communities and premiere opportunities for advertisers. The company's businesses include radio and outdoor displays. More information is available at www.clearchannel.com. For further information contact: Investors – Randy Palmer, Senior Vice President of Investor Relations, (210) 832-3315 or Media – Lisa Dollinger, Chief Communications Officer, (210) 832-3474 or visit the Company‘s web-site at http://www.clearchannel.com. Certain statements in this document constitute “forward-looking statements” within the meaning of the Private Securities Litigation Reform Act of 1995. Such forward-looking statements involve known and unknown risks, uncertainties and other factors which may cause the actual results, performance or achievements of Clear Channel Communications to be materially different from any future results, performance or achievements expressed or implied by such forward-looking statements. The words or phrases “guidance,” “believe,” “expect,” “anticipate,” “estimates” and “forecast” and similar words or expressions are intended to identify such forward-looking statements. In addition, any statements that refer to expectations or other characterizations of future events or circumstances are forward-looking statements. Various risks that could cause future results to differ from those expressed by the forward-looking statements included in this document include, but are not limited to: changes in business, political and economic conditions in the U.S. and in other countries in which Clear Channel Communications currently does business (both general and relative to the advertising industry); fluctuations in interest rates; changes in operating performance; shifts in population and other demographics; changes in the level of competition for advertising dollars; fluctuations in operating costs; technological changes and innovations; changes in labor conditions; changes in governmental regulations and policies and actions of regulatory bodies; fluctuations in exchange rates and currency values; changes in tax rates; and changes in capital expenditure requirements; access to capital markets and changes in credit ratings. Other unknown or unpredictable factors also could have material adverse effects on Clear Channel Communications’ future results, performance or achievements. In light of these risks, uncertainties, assumptions and factors, the forward-looking events discussed in this document may not occur. You are cautioned not to place undue reliance on these forward-looking statements, which speak only as of the date stated, or if no date is stated, as of the date of this document. Other key risks are described in Clear Channel Communications’ reports filed with the U.S. Securities and Exchange Commission, including in the section entitled “Item 1A. Risk Factors” of Clear Channel’s Annual Report on Form 10-K for the year ended December 31, 2007. Except as otherwise stated in this document, Clear Channel Communications does not undertake any obligation to publicly update or revise any forward-looking statements because of new information, future events or otherwise. 15