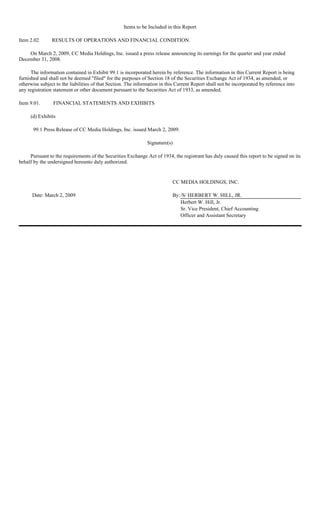
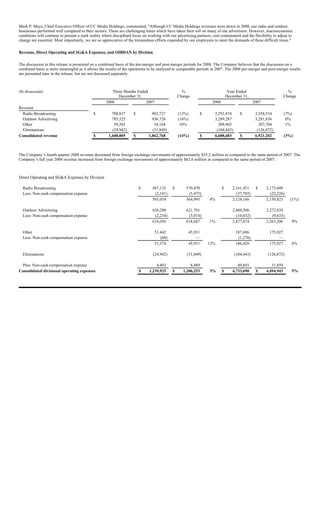
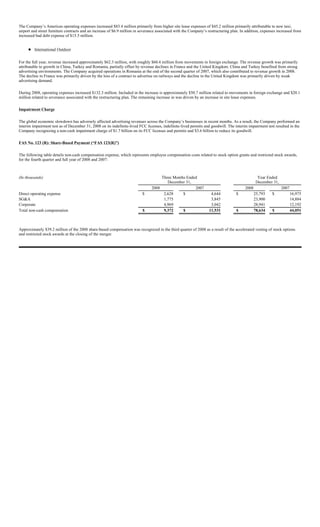
- CC Media Holdings reported financial results for Q4 2008 and full year 2008. Revenue declined 14% to $1.6 billion in Q4 2008 and 3% to $6.7 billion for the full year.
- The company recognized a non-cash impairment charge of $5.3 billion in Q4 2008, consisting of $1.7 billion for FCC licenses and permits and $3.6 billion for goodwill.
- OIBDAN (operating income before depreciation and amortization) declined 50% to $309 million in Q4 2008 and 21% to $1.8 billion for the full year, as revenues declined across most divisions and markets due to weak advertising spending
2. Elemental Economics - Mineral demand.pdfNeal Brewster
After this second you should be able to: Explain the main determinants of demand for any mineral product, and their relative importance; recognise and explain how demand for any product is likely to change with economic activity; recognise and explain the roles of technology and relative prices in influencing demand; be able to explain the differences between the rates of growth of demand for different products.
how to sell pi coins effectively (from 50 - 100k pi)DOT TECH
Anywhere in the world, including Africa, America, and Europe, you can sell Pi Network Coins online and receive cash through online payment options.
Pi has not yet been launched on any exchange because we are currently using the confined Mainnet. The planned launch date for Pi is June 28, 2026.
Reselling to investors who want to hold until the mainnet launch in 2026 is currently the sole way to sell.
Consequently, right now. All you need to do is select the right pi network provider.
Who is a pi merchant?
An individual who buys coins from miners on the pi network and resells them to investors hoping to hang onto them until the mainnet is launched is known as a pi merchant.
debuts.
I'll provide you the Telegram username
@Pi_vendor_247
The secret way to sell pi coins effortlessly.DOT TECH
Well as we all know pi isn't launched yet. But you can still sell your pi coins effortlessly because some whales in China are interested in holding massive pi coins. And they are willing to pay good money for it. If you are interested in selling I will leave a contact for you. Just telegram this number below. I sold about 3000 pi coins to him and he paid me immediately.
Telegram: @Pi_vendor_247
1. Elemental Economics - Introduction to mining.pdfNeal Brewster
After this first you should: Understand the nature of mining; have an awareness of the industry’s boundaries, corporate structure and size; appreciation the complex motivations and objectives of the industries’ various participants; know how mineral reserves are defined and estimated, and how they evolve over time.
This presentation poster infographic delves into the multifaceted impacts of globalization through the lens of Nike, a prominent global brand. It explores how globalization has reshaped Nike's supply chain, marketing strategies, and cultural influence worldwide, examining both the benefits and challenges associated with its global expansion.
PPrreesseenntteedd bbyy:: GGrroouupp 66
GGlloobbaalliizzaattiioonn
o f
PP
oo
ll
yy
ee
ss
tt
ee
rr
RR
uu
bb
bb
ee
rr
EE
tt
hh
yy
ll
ee
nn
ee
VV
ii
nn
yy
ll
AA
cc
ee
tt
aa
tt
ee
GG
ee
nn
uu
ii
nn
ee
LL
ee
aa
tt
hh
ee
rr
SS
yy
nn
tt
hh
ee
tt
ii
cc
LL
ee
aa
tt
hh
ee
rr
CC
oo
tt
tt
oo
nn
C
o
u
n
t
r
i
e
s
I
n
v
o
l
v
e
d
Ni
k
e
h
a
s
m
o
r
e
t
h
a
n
7
0
0
s
h
o
p
s
i
n
c
o
n
t
r
a
c
t
w
i
t
h
w
o
r
l
d
w
i
d
e,
w
h
e
r
e
i
n
t
h
e
i
r
offi
c
e
s
a
n
d
i
n
d
e
p
e
n
d
e
n
t
fa
c
t
o
r
y
o
u
t
l
e
t
s
a
r
e
fo
u
n
d
w
i
t
h
i
n
t
h
e
p
r
e
m
i
s
e
s
of
ap
p
r
o
x
i
m
a
t
e
l
y
4
5
c
o
u
n
t
r
i
e
s.
AAuussttrraalliiaa
China
India
IInnddoonneessiiaa
TThhaaiillaanndd
TTuurrkkeeyy
USA
VViieettnnaamm
NNiikkee SSuuppppllyy CChhaaiinn
RRuubbbbeerr,, FFaabbrriicc
aanndd ootthheerr rraaww
mmaatteerriiaallss
Shoe
MMaannuuffaaccttuurriinngg
aanndd AAsssseemmbbllyy
MMaarrkkeettiinngg
SSppoorrttiinngg ggooooddss,,
ddeevveellooppmmeenntt
aanndd SShhooee ssttoorreess
OOnnlliinnee,, CCaattaalloogg
aanndd ootthheerr rreettaaiill
NNiikkee bbrraannddeedd
shoes
PPrroodduucctt
ddeevveellooppmmeenntt
CCuussttoommeerr nneeeeddss//wwaannttss ffeeeeddbbaacckk
NNiikk
Nike Supply Chain
Globalization of Nike
Nike Manufacturing Process
Rubber Materials Nike
Ethylene Vinyl Acetate Nike
Genuine Leather Nike
Synthetic Leather Nike
Cotton in Nike Apparel
Nike Shops Worldwide
Nike Manufacturing Countries
Cold Cement Assembly Nike
3D Printing Nike Shoes
Nike Product Development
Nike Marketing Strategies
Nike Customer Feedback
Nike Distribution Centers
Automation in Nike Manufacturing
Nike Consumer Direct Acceleration
Nike Logistics and Transport
Financial Assets: Debit vs Equity Securities.pptxWrito-Finance
financial assets represent claim for future benefit or cash. Financial assets are formed by establishing contracts between participants. These financial assets are used for collection of huge amounts of money for business purposes.
Two major Types: Debt Securities and Equity Securities.
Debt Securities are Also known as fixed-income securities or instruments. The type of assets is formed by establishing contracts between investor and issuer of the asset.
• The first type of Debit securities is BONDS. Bonds are issued by corporations and government (both local and national government).
• The second important type of Debit security is NOTES. Apart from similarities associated with notes and bonds, notes have shorter term maturity.
• The 3rd important type of Debit security is TRESURY BILLS. These securities have short-term ranging from three months, six months, and one year. Issuer of such securities are governments.
• Above discussed debit securities are mostly issued by governments and corporations. CERTIFICATE OF DEPOSITS CDs are issued by Banks and Financial Institutions. Risk factor associated with CDs gets reduced when issued by reputable institutions or Banks.
Following are the risk attached with debt securities: Credit risk, interest rate risk and currency risk
There are no fixed maturity dates in such securities, and asset’s value is determined by company’s performance. There are two major types of equity securities: common stock and preferred stock.
Common Stock: These are simple equity securities and bear no complexities which the preferred stock bears. Holders of such securities or instrument have the voting rights when it comes to select the company’s board of director or the business decisions to be made.
Preferred Stock: Preferred stocks are sometime referred to as hybrid securities, because it contains elements of both debit security and equity security. Preferred stock confers ownership rights to security holder that is why it is equity instrument
<a href="https://www.writofinance.com/equity-securities-features-types-risk/" >Equity securities </a> as a whole is used for capital funding for companies. Companies have multiple expenses to cover. Potential growth of company is required in competitive market. So, these securities are used for capital generation, and then uses it for company’s growth.
Concluding remarks
Both are employed in business. Businesses are often established through debit securities, then what is the need for equity securities. Companies have to cover multiple expenses and expansion of business. They can also use equity instruments for repayment of debits. So, there are multiple uses for securities. As an investor, you need tools for analysis. Investment decisions are made by carefully analyzing the market. For better analysis of the stock market, investors often employ financial analysis of companies.
The European Unemployment Puzzle: implications from population agingGRAPE
We study the link between the evolving age structure of the working population and unemployment. We build a large new Keynesian OLG model with a realistic age structure, labor market frictions, sticky prices, and aggregate shocks. Once calibrated to the European economy, we quantify the extent to which demographic changes over the last three decades have contributed to the decline of the unemployment rate. Our findings yield important implications for the future evolution of unemployment given the anticipated further aging of the working population in Europe. We also quantify the implications for optimal monetary policy: lowering inflation volatility becomes less costly in terms of GDP and unemployment volatility, which hints that optimal monetary policy may be more hawkish in an aging society. Finally, our results also propose a partial reversal of the European-US unemployment puzzle due to the fact that the share of young workers is expected to remain robust in the US.
when will pi network coin be available on crypto exchange.DOT TECH
There is no set date for when Pi coins will enter the market.
However, the developers are working hard to get them released as soon as possible.
Once they are available, users will be able to exchange other cryptocurrencies for Pi coins on designated exchanges.
But for now the only way to sell your pi coins is through verified pi vendor.
Here is the telegram contact of my personal pi vendor
@Pi_vendor_247
when will pi network coin be available on crypto exchange.
319 clearchanne
1. UNITED STATES
SECURITIES AND EXCHANGE COMMISSION
Washington D.C., 20549
Form 8-K
Current Report
Pursuant to Section 13 or 15(d) of the Securities Exchange Act of 1934
Date of Report (Date of Earliest Event Reported): 3/2/2009
CC MEDIA HOLDINGS, INC
(Exact Name of Registrant as Specified in its Charter)
Commission File Number: 000-53354
Delaware 26-0241222
(State or Other Jurisdiction of (I.R.S. Employer
Incorporation or Organization) Identification No.)
200 E. Basse
San Antonio, TX 78209
(Address of Principal Executive Offices, Including Zip Code)
210-822-2828
(Registrant’s Telephone Number, Including Area Code)
Check the appropriate box below if the Form 8-K filing is intended to simultaneously satisfy the filing obligation of the registrant
under any of the following provisions (see General Instruction A.2. below):
[ ] Written communications pursuant to Rule 425 under the Securities Act (17 CFR 230.425)
[ ] Soliciting material pursuant to Rule 14a-12 under the Exchange Act(17CFR240.14a-12)
[ ] Pre-commencement communications pursuant to Rule 14d-2(b) under the Exchange Act(17CFR240.14d-2(b))
[ ] Pre-commencement communications pursuant to Rule 13e-4(c) under the Exchange Act(17CFR240.13e-4(c))
2. Items to be Included in this Report
Item 2.02 RESULTS OF OPERATIONS AND FINANCIAL CONDITION.
On March 2, 2009, CC Media Holdings, Inc. issued a press release announcing its earnings for the quarter and year ended
December 31, 2008.
The information contained in Exhibit 99.1 is incorporated herein by reference. The information in this Current Report is being
furnished and shall not be deemed quot;filedquot; for the purposes of Section 18 of the Securities Exchange Act of 1934, as amended, or
otherwise subject to the liabilities of that Section. The information in this Current Report shall not be incorporated by reference into
any registration statement or other document pursuant to the Securities Act of 1933, as amended.
Item 9.01. FINANCIAL STATEMENTS AND EXHIBITS
(d) Exhibits
99.1 Press Release of CC Media Holdings, Inc. issued March 2, 2009.
Signature(s)
Pursuant to the requirements of the Securities Exchange Act of 1934, the registrant has duly caused this report to be signed on its
behalf by the undersigned hereunto duly authorized.
CC MEDIA HOLDINGS, INC.
Date: March 2, 2009 By: /S/ HERBERT W. HILL, JR.
Herbert W. Hill, Jr.
Sr. Vice President, Chief Accounting
Officer and Assistant Secretary
4. Exhibit 99.1
CC Media Holdings, Inc. Reports Fourth Quarter and Full Year 2008 Results
SAN ANTONIO--(BUSINESS WIRE)--March 2, 2009--CC Media Holdings, Inc. (OTCBB: CCMO) today reported results for its fourth quarter and year ended
December 31, 2008.
Fourth Quarter 2008 Results
CC Media Holdings reported revenues of $1.6 billion in the fourth quarter of 2008, a decrease of 14% from the $1.9 billion reported for the fourth quarter of 2007.
Included in the Company’s revenue is a $55.2 million decrease due to movements in foreign exchange; strictly excluding the effects of these movements in foreign
exchange, revenues would have declined 11%. See reconciliation of revenue excluding effects of foreign exchange to revenue at the end of this press release.
The Company’s operating expenses increased 3% to $1.2 billion during the fourth quarter of 2008 compared to 2007. Included in CC Media Holdings’ fourth quarter
2008 expenses is a $47.6 million decrease due to movements in foreign exchange. Strictly excluding the effects of these movements in foreign exchange in the 2008
expenses, expense growth would have been 7%. See reconciliation of expenses excluding effects of foreign exchange to expenses at the end of this press release. Also
included in CC Media Holdings’ fourth quarter 2008 operating expenses are approximately $4.4 million of non-cash compensation expense. This compares to non-cash
compensation expense of $8.5 million in the fourth quarter of 2007.
The Company’s income (loss) before discontinued operations decreased to a loss of $4.99 billion, primarily attributable to a pre-tax impairment charge of
approximately $5.3 billion, as compared to income of $228.3 million for the same period in 2007. The Company’s fourth quarter 2008 net loss also included
approximately $124.5 million of pre-tax aggregate gains on bond tenders.
CC Media Holdings’ OIBDAN (defined as Operating Income before Depreciation & amortization, Non-cash compensation expense, Merger costs, Other operating
income – net and impairment charges) was $309 million in the fourth quarter of 2008, a 50% decrease from 2007. See reconciliation of OIBDAN to net income (loss) at
the end of this press release.
Full Year 2008 Results
For the full year, the Company reported revenues of $6.7 billion, a decrease of 3% when compared to revenues of $6.9 billion for the same period in 2007. Included in
the Company’s revenue is a $62.6 million increase due to movements in foreign exchange. The Company’s expenses increased 5% to $4.7 billion during the year
compared to 2007. Included in the Company’s expenses is approximately $49.7 million of non-cash compensation expense and a $52.1 million increase due to
movements in foreign exchange.
Income before discontinued operations was a loss of $4.6 billion as compared to income before discontinued operations of $793 million in 2007. The Company’s full
year 2008 net loss included pre-tax impairment charges of $5.3 billion, approximately $94.7 million of pre-tax aggregate gains related to bond tenders, an $82.3 million
pre-tax loss on marketable securities and a $75.8 million aggregate gain on the disposition of equity investments.
CC Media Holdings’ OIBDAN was $1.8 billion in 2008, a 21% decrease from 2007. See reconciliation of OIBDAN to net income at the end of this press release.
5. Mark P. Mays, Chief Executive Officer of CC Media Holdings, commented, quot;Although CC Media Holdings revenues were down in 2008, our radio and outdoor
businesses performed well compared to their sectors. These are challenging times which have taken their toll on many of our advertisers. However, macroeconomic
conditions will continue to present a stark reality where disciplined focus on working with our advertising partners, cost containment and the flexibility to adjust to
change are essential. Most importantly, we are so appreciative of the tremendous efforts expended by our employees to meet the demands of these difficult times.quot;
Revenue, Direct Operating and SG&A Expenses, and OIBDAN by Division
The discussion in this release is presented on a combined basis of the pre-merger and post-merger periods for 2008. The Company believes that the discussion on a
combined basis is more meaningful as it allows the results of the operations to be analyzed to comparable periods in 2007. The 2008 pre-merger and post-merger results
are presented later in the release, but are not discussed separately.
(In thousands) Three Months Ended % Year Ended %
December 31, Change December 31, Change
2008 2007 2008 2007
Revenue
Radio Broadcasting $ 788,837 $ 903,727 (13%) $ 3,293,874 $ 3,558,534 (7%)
Outdoor Advertising 785,525 936,726 (16%) 3,289,287 3,281,836 0%
Other 59,385 54,164 10% 209,965 207,704 1%
Eliminations (24,942) (31,849) (104,443) (126,872)
Consolidated revenue $ 1,608,805 $ 1,862,768 (14%) $ 6,688,683 $ 6,921,202 (3%)
The Company’s fourth quarter 2008 revenue decreased from foreign exchange movements of approximately $55.2 million as compared to the same period of 2007. The
Company’s full year 2008 revenue increased from foreign exchange movements of approximately $62.6 million as compared to the same period of 2007.
Direct Operating and SG&A Expenses by Division
Radio Broadcasting $ 587,135 $ 570,470 $ 2,161,931 $ 2,173,049
Less: Non-cash compensation expense (2,101) (5,475) (37,785) (22,226)
585,034 564,995 4% 2,124,146 2,150,823 (1%)
Outdoor Advertising 626,290 621,701 2,488,506 2,272,839
Less: Non-cash compensation expense (2,234) (3,014) (10,632) (9,633)
624,056 618,687 1% 2,477,874 2,263,206 9%
Other 51,442 45,931 187,696 175,927
Less: Non-cash compensation expense (68) — (1,276) —
51,374 45,931 12% 186,420 175,927 6%
Eliminations (24,942) (31,849) (104,443) (126,872)
Plus: Non-cash compensation expense 4,403 8,489 49,693 31,859
Consolidated divisional operating expenses $ 1,239,925 $ 1,206,253 3% $ 4,733,690 $ 4,494,943 5%
6. The Company’s fourth quarter 2008 direct operating and SG&A expenses decreased from foreign exchange movements of approximately $47.6 million as compared to
the same period of 2007. The Company’s full year 2008 direct operating and SG&A expenses increased from foreign exchange movements of approximately $52.1
million as compared to the same period of 2007.
OIBDAN
Radio Broadcasting $ 203,803 $ 338,732 (40%) $ 1,169,728 $ 1,407,711 (17%)
Outdoor Advertising 161,469 318,039 (49%) 811,413 1,018,630 (20%)
Other 8,011 8,233 (3%) 23,545 31,777 (26%)
Corporate (63,912) (40,228) (199,004) (169,312)
Consolidated OIBDAN $ 309,371 $ 624,776 (50%) $ 1,805,682 $ 2,288,806 (21%)
See reconciliation of OIBDAN to net income at the end of this press release.
Radio Broadcasting
For 2008, the Company’s radio broadcasting revenue declined approximately $264.7 million compared to 2007, with approximately 43% of the decline occurring
during the fourth quarter. Local revenues were down $205.6 million in 2008 compared to 2007. National revenues declined as well. Both local and national revenues
were down as a result of overall weakness in advertising. The Company’s radio revenue experienced declines across advertising categories including automotive, retail
and entertainment advertising categories. For the year ended December 31, 2008, total minutes sold and average minute rate declined compared to 2007.
Operating expenses declined approximately $11.1 million in 2008. The decline was attributable to a decrease in programming expenses in the Company’s radio
markets, a decrease in expenses from reduced marketing and promotional expenses and a decline in commission expenses associated with the revenue decline. Partially
offsetting the decline was an increase in severance of approximately $32.6 million, an increase in bad debt expense of approximately $17.3 million and an increase in
programming expenses associated with the Company’s national syndication business. The increase in programming expenses in the Company’s national syndication
business was mostly related to contract talent payments.
Outdoor Advertising
The Company‘s outdoor advertising revenue was relatively flat for the full year of 2008 when compared to 2007. Included in the 2008 results is an approximate $62.6
million increase related to foreign exchange when compared to 2007.
Outdoor advertising expenses increased 9% when compared to the same period in 2007. Included in the 2008 results is an approximate $52.1 million increase related to
foreign exchange when compared to 2007.
Americas Outdoor
Revenue decreased approximately $54.8 million during 2008 compared to 2007, with the entire decline occurring in the fourth quarter. Driving the decline was
approximately $87.4 million attributable to poster and bulletin revenues associated with cancellations and non-renewals from major national advertisers, partially offset
by an increase of $46.2 million in airport revenues, digital display revenues and street furniture revenues. Also impacting the decline in bulletin revenue was decreased
occupancy while the decline in poster revenue was affected by a decrease in both occupancy and rate. The increase in airport and street furniture revenues was primarily
driven by new contracts while digital display revenue growth was primarily the result of an increase in the number of digital displays. Other miscellaneous revenues
also declined approximately $13.6 million.
7. The Company’s Americas operating expenses increased $83.4 million primarily from higher site lease expenses of $45.2 million primarily attributable to new taxi,
airport and street furniture contracts and an increase of $6.9 million in severance associated with the Company’s restructuring plan. In addition, expenses increased from
increased bad debt expense of $15.5 million.
International Outdoor
For the full year, revenue increased approximately $62.3 million, with roughly $60.4 million from movements in foreign exchange. The revenue growth was primarily
attributable to growth in China, Turkey and Romania, partially offset by revenue declines in France and the United Kingdom. China and Turkey benefited from strong
advertising environments. The Company acquired operations in Romania at the end of the second quarter of 2007, which also contributed to revenue growth in 2008.
The decline in France was primarily driven by the loss of a contract to advertise on railways and the decline in the United Kingdom was primarily driven by weak
advertising demand.
During 2008, operating expenses increased $132.3 million. Included in the increase is approximately $50.7 million related to movements in foreign exchange and $20.1
million related to severance associated with the restructuring plan. The remaining increase in was driven by an increase in site lease expenses.
Impairment Charge
The global economic slowdown has adversely affected advertising revenues across the Company’s businesses in recent months. As a result, the Company performed an
interim impairment test as of December 31, 2008 on its indefinite-lived FCC licenses, indefinite-lived permits and goodwill. The interim impairment test resulted in the
Company recognizing a non-cash impairment charge of $1.7 billion on its FCC licenses and permits and $3.6 billion to reduce its goodwill.
FAS No. 123 (R): Share-Based Payment (“FAS 123(R)”)
The following table details non-cash compensation expense, which represents employee compensation costs related to stock option grants and restricted stock awards,
for the fourth quarter and full year of 2008 and 2007:
(In thousands) Three Months Ended Year Ended
December 31, December 31,
2008 2007 2008 2007
Direct operating expense $ 2,628 $ 4,644 $ 25,793 $ 16,975
SG&A 1,775 3,845 23,900 14,884
Corporate 4,969 3,042 28,941 12,192
Total non-cash compensation $ 9,372 $ 11,531 $ 78,634 $ 44,051
Approximately $39.2 million of the 2008 share-based compensation was recognized in the third quarter of 2008 as a result of the accelerated vesting of stock options
and restricted stock awards at the closing of the merger.
8. Current Information and Expectations
The Company has previously provided information regarding its revenue pacings and certain expectations related to 2008 operating results. That information was last
provided on May 9, 2008 and has not been updated. The Company is not providing such information in this release and does not anticipate providing this information in
the future. The Company will not update or revise any previously disclosed information. Investors are cautioned to no longer rely on such prior information given the
passage of time and other reasons discussed in the Company’s reports filed with the SEC. Future results could differ materially than the forward-looking information
previously disclosed.
The Company periodically reviews its disclosure practices in the ordinary course of its business and management determined to cease providing this information after
taking into consideration a number of factors.
Restructuring Program
On January 20, 2009 the Company announced that it had commenced a restructuring program targeting a reduction of fixed costs by approximately $350 million on an
annualized basis. As part of the program, the Company eliminated approximately 1,850 full-time positions representing approximately 9% of total workforce. The
restructuring program will also include other actions, including elimination of overlapping functions and other cost savings initiatives. The program is expected to result
in restructuring and other non-recurring charges of approximately $200 million, although additional costs may be incurred as the program evolves. The cost savings
initiatives are expected to be fully implemented by the end of the first quarter of 2010. No assurance can be given that the restructuring program will be successful or
will achieve the anticipated cost savings in the timeframe expected or at all. In addition, the Company may modify or terminate the restructuring program in response to
economic conditions or otherwise.
As of December 31, 2008 the Company had recognized approximately $95.9 million of expenses related to the restructuring program. These expenses primarily related
to severance of approximately $83.3 million and $12.6 million related to professional fees.
Severance Expenses
(In millions) Three Months Ended
December 31,
2008
Radio Broadcasting $ 52.5
Outdoor Advertising 27.8
Other 1.5
Corporate 1.5
Total $ 83.3
9. TABLE 1 - Financial Highlights of CC Media Holdings, Inc. and Subsidiaries - Unaudited
The discussion in this release is presented on a combined basis of the pre-merger and post-merger periods for 2008. The 2008 combined post-merger and pre-merger
results are presented below, but are not discussed separately. The Company believes that the discussion on a combined basis is more meaningful as it allows the results
of the operations to be analyzed to comparable periods in 2007. See reconciliation of combined results below.
Three Months Ended Twelve Months Ended
(In thousands) December 31, % December 31, %
2008 2007 Chg. 2008 2007 Chg.
Revenue $ 1,608,805 $ 1,862,768 (14%) $ 6,688,683 $ 6,921,202 (3%)
Direct operating expenses 724,607 739,189 2,904,444 2,733,004
Selling, general and administrative expenses 515,318 467,064 1,829,246 1,761,939
Corporate expenses 68,881 43,270 227,945 181,504
Merger costs 68,085 390 155,769 6,762
Impairment charge 5,268,858 — 5,268,858 —
Depreciation and amortization 239,901 145,983 696,830 566,627
Other operating income – net 12,363 2,492 28,032 14,113
Operating Income (loss) (5,264,482) 469,364 (4,366,377) 1,685,479
Interest expense 434,289 104,345 928,978 451,870
Gain (loss) on marketable securities (116,552) 6,081 (82,290) 6,742
Equity in earnings of nonconsolidated affiliates 3,707 11,344 100,019 35,176
Other income (expense) – net 142,419 6,401 126,393 5,326
Income (loss) before income taxes, minority interest and discontinued operations (5,669,197) 388,845 (5,151,233) 1,280,853
Income tax benefit (expense):
Current 38,512 (84,817) 49,449 (252,910)
Deferred 624,902 (55,954) 474,591 (188,238)
Income tax benefit (expense) 663,414 (140,771) 524,040 (441,148)
Minority interest income (expense), net of tax 9,349 (19,824) (16,671) (47,031)
Income (loss) before discontinued operations (4,996,434) 228,250 (4,643,864) 792,674
Income (loss) from discontinued operations (832) 92,309 638,391 145,833
Net income (loss) $ (4,997,266) $ 320,559 $ (4,005,473) $ 938,507
Earnings per share are not presented as it is not meaningful due to the post-merger and pre-merger comparisons, as explained below.
10. The information in Table 1 is presented for two periods: post-merger and pre-merger. The Company applied preliminary purchase accounting to the opening balance
sheet on July 31, 2008 as the merger occurred at the close of business on July 30, 2008 and the results of operations subsequent to this date reflect the impact of the new
basis of accounting. The merger resulted in a new basis of accounting beginning on July 31, 2008 and the financial reporting periods are presented as follows:
The period from July 31 through December 31, 2008 includes the post-merger period, reflecting the merger. Subsequent to the acquisition, Clear Channel
became an indirect, wholly-owned subsidiary of the Company and the business of the Company became that of Clear Channel and its subsidiaries.
The period from January 1 through July 30, 2008 includes the pre-merger period of Clear Channel. Prior to the consummation of the acquisition of Clear
Channel, the Company had not conducted any activities, other than activities incident to its formation and in connection with the acquisition, and did not have
any assets or liabilities, other than as related to the acquisition.
The 2007 periods presented are pre-merger. The consolidated financial statements for all pre-merger periods were prepared using the historical basis of
accounting for Clear Channel. As a result of the merger and the associated preliminary purchase accounting, the consolidated financial statements of the post-
merger periods are not comparable to periods preceding the merger.
The Company has initially estimated the fair value of the acquired assets and liabilities as of the merger date utilizing information available at the time the
Company’s financial statements were prepared. These preliminary estimates are subject to refinement until all pertinent information is obtained. The Company
is currently in the process of obtaining third-party valuations of certain of the acquired assets and liabilities and will finalize its purchase price allocation in
2009. The final allocation of the purchase price may be different than the initial allocation.
(In thousands) Post-merger Pre-merger Combined
Period from Period From Twelve Months
July 31 through January 1 Ended
December 31, through July 30, December 31,
2008 2008 2008
Revenue $ 2,736,941 $ 3,951,742 $ 6,688,683
Operating expenses:
Direct operating expenses (excludes depreciation and amortization) 1,198,345 1,706,099 2,904,444
Selling, general and administrative expenses (excludes depreciation and amortization) 806,787 1,022,459 1,829,246
Depreciation and amortization 348,041 348,789 696,830
Corporate expenses (excludes depreciation and amortization) 102,276 125,669 227,945
Merger expenses 68,085 87,684 155,769
Impairment charge 5,268,858 — 5,268,858
Other operating income – net 13,205 14,827 28,032
Operating income (loss) (5,042,246) 675,869 (4,366,377)
Interest expense 715,768 213,210 928,978
Gain (loss) on marketable securities (116,552) 34,262 (82,290)
Equity in earnings of nonconsolidated affiliates 5,804 94,215 100,019
Other income (expense) – net 131,505 (5,112) 126,393
Income (loss) before income taxes, minority interest and discontinued operations (5,737,257) 586,024 (5,151,233)
Income tax benefit (expense):
Current 76,729 (27,280) 49,449
Deferred 619,894 (145,303) 474,591
Income tax benefit (expense) 696,623 (172,583) 524,040
Minority interest income (expense), net of tax 481 (17,152) (16,671)
Income (loss) before discontinued operations (5,040,153) 396,289 (4,643,864)
Income (loss) from discontinued operations, net (1,845) 640,236 638,391
Net income (loss) $ (5,041,998) $ 1,036,525 $ (4,005,473)
Other income (expense) – net of $126.4 million in 2008 relates to an aggregate gain of $124.5 million on the fourth quarter 2008 tender of certain of Clear Channel’s
outstanding notes, a $29.3 million foreign exchange gain on translating short-term intercompany notes, an $8.0 million dividend received, partially offset by a $29.8
million loss on the third quarter 2008 tender of certain of Clear Channel’s outstanding notes and a $4.7 million impairment of its investment in a radio partnership and
$0.9 million of various other items.
11. Income Taxes
Current tax expense for 2008 decreased $302.4 million compared to 2007 primarily due to a decrease in “income (loss) before income taxes, minority interest and
discontinued operations” of $1.2 billion, which excludes the non-tax deductible impairment charge of $5.3 billion recorded in 2008. In addition, current tax benefits of
approximately $74.6 million were recorded during 2008 related to the termination of Clear Channel’s cross currency swap. Also, the Company recognized additional
tax depreciation deductions as a result of the bonus depreciation provisions enacted as part of the Economic Stimulus Act of 2008. These current tax benefits were
partially offset by additional current tax expense recorded in 2008 related to currently non deductible transaction costs as a result of the merger.
The effective tax rate for the year ended December 31, 2008 decreased to 10.2% as compared to 34.4% for the year ended December 31, 2007, primarily due to the
impairment charge that resulted in a $5.3 billion decrease in “income (loss) before income taxes, minority interest and discontinued operations” and tax benefits of
approximately $648.2 million.
12. TABLE 2 - Selected Balance Sheet Information - Unaudited
Selected balance sheet information for 2008 and 2007 was:
(In millions) December 31, December 31,
2008 2007
Cash $ 239.8 $ 145.1
Total Current Assets $ 2,066.6 $ 2,294.6
Net Property, Plant and Equipment $ 3,548.2 $ 3,050.4
Total Assets $ 21,125.5 $ 18,805.5
Current Liabilities (excluding current portion of long-term debt) $ 1,283.0 $ 1,453.1
Long-Term Debt (including current portion of long-term debt)* $ 19,503.6 $ 6,575.2
Shareholders’ Equity (Deficit) $ (3,380.1) $ 8,797.5
* See Table 4 for a discussion of total debt.
TABLE 3 - Capital Expenditures - Unaudited
Capital expenditures for the full year of 2008 and 2007 were:
(In millions) December 31, 2008 December 31, 2007
Non-revenue producing $ 157.6 $ 169.0
Revenue producing 272.9 194.3
Total capital expenditures $ 430.5 $ 363.3
The Company defines non-revenue producing capital expenditures as those expenditures that are required on a recurring basis. Revenue producing capital expenditures
are discretionary capital investments for new revenue streams, similar to an acquisition.
TABLE 4 – Total Debt - Unaudited
At December 31, 2008 and December 31, 2007, CC Media Holdings had total debt of:
(in thousands) December 31, December 31,
2008 2007
Senior Secured Credit Facilities:
Term loan A $ 1,331,500 $ —
Term loan B 10,700,000 —
Term loan C 695,879 —
Revolving Credit Facility 220,000 —
Delayed Draw Facility 532,500 —
Receivables Based Facility 445,609 —
Other secured debt 6,604 8,297
Total Consolidated Secured Debt 13,932,092 8,297
Senior Cash Pay Notes 980,000 —
Senior Toggle Notes 1,330,000 —
Clear Channel Senior Notes 4,306,440 5,650,000
Subsidiary level notes — 644,860
Other debt 69,260 97,822
$1.75 billion multi-currency revolving credit facility — 174,619
Purchase accounting adjustments and original issue (discount) premium (1,114,172) (11,849)
Fair value adjustments related to interest rate swaps — 11,438
19,503,620 6,575,187
Less: current portion 562,923 1,360,199
Total long-term debt $ 18,940,697 $ 5,214,988
13. Liquidity and Financial Position
For the year ended December 31, 2008, cash flow from operating activities was $1,281.3 million, cash flow used by investing activities was $18,128.0 million, cash
flow provided by financing activities was $15,907.8 million, and net cash provided by discontinued operations was $1,033.6 million for a net increase in cash of $94.7
million.
As of December 31, 2008, 61% of the Company’s debt bears interest at fixed rates while 39% of the Company’s debt bears interest at floating rates based upon LIBOR.
The current global economic slowdown has resulted in a decline in advertising and marketing services among the Company’s customers, resulting in a decline in
advertising revenues across its businesses. This reduction in advertising revenues has had an adverse effect on the Company’s revenue, profit margins, cash flow and
liquidity, particularly during the second half of 2008. Continuing adverse securities and credit market conditions could significantly affect the availability of equity or
credit financing. While there is no assurance in the current economic environment, the Company believes the lenders participating in its credit agreements will be
willing and able to provide financing in accordance with the terms of their agreements. In this regard, on February 6, 2009 the Company borrowed the approximately
$1.6 billon of remaining availability under its $2.0 billion revolving credit facility to improve its liquidity position in light of continuing uncertainty in credit market and
economic conditions. The Company expects to refinance its $500.0 million 4.25% notes due May 15, 2009 with a draw under the $500.0 million delayed draw term
loan facility that is specifically designated for this purpose. The remaining $69.5 million of indebtedness maturing in 2009 will either be refinanced or repaid with cash
flow from operations or on hand.
As of February 27, 2009, the Company had approximately $18 million available on its bank revolving credit facility and had a balance of approximately $1.6 billion in
short-term investments. The Company may utilize available funds for general working capital purposes including funding capital expenditures and acquisitions. The
Company may also from time to time seek to retire or purchase its outstanding debt or equity securities or obligations through cash purchases, prepayments and/or
exchanges for debt or equity securities or obligations, in open market purchases, privately negotiated transactions or otherwise. Such uses, repurchases, prepayments or
exchanges, if any, will depend on prevailing market conditions, the Company’s liquidity requirements, contractual restrictions and other factors. The amounts involved
may be material.
The Company’s senior secured credit facilities require the Company to comply with a maximum consolidated senior secured net debt to adjusted EBITDA (as
calculated in accordance with the senior secured credit facilities) ratio. The covenant does not become effective until the quarter ending March 31, 2009. Secured
Leverage, defined as secured debt, net of cash, divided by the trailing 12-month consolidated EBITDA, was 6.39x at December 31, 2008.
The following table reconciles OIBDAN to the trailing 12-month consolidated EBITDA calculated in accordance with the Company’s credit agreement.
(In millions)
Trailing 12-month OIBDAN $ 1,805.7
Expected cost savings (a) 100.0
Restructuring costs (b) 95.9
Cash received from non-consolidated affiliates (c) 43.1
Non-cash items (d) 17.0
Other (e) 82.4
Trailing 12-month Consolidated EBITDA $ 2,144.1
(a) Represents expected cost savings (limited to $100 million in any 12-month period)
(b) Represents expenses incurred associated with the Company’s restructuring program
(c) Represents cash dividends or distributions received from nonconsolidated affiliates as the equity in earnings from these investments has been deducted in the
calculation of OIBDAN.
(d) Represents the difference between the cash expense and the GAAP expense for certain items, including long-term accruals for potential cash items in any future
period.
(e) Represents gains or losses related to asset dispositions in the ordinary course of business and certain non-recurring or unusual expenses including severance and
relocation costs.
14. Supplemental Disclosure Regarding Non-GAAP Financial Information
Operating Income (Loss) before Depreciation and Amortization (D&A), Non-cash Compensation Expense and Other operating income – Net (OIBDAN)
The following tables set forth the Company’s OIBDAN for the three months and years ended December 31, 2008 and 2007. The Company defines OIBDAN as net
income adjusted to exclude non-cash compensation expense and the following line items presented in its Statement of Operations: Discontinued operations; Minority
interest, net of tax; Income tax benefit (expense); Other income (expense) - net; Equity in earnings of nonconsolidated affiliates; Gain (loss) on marketable securities;
Interest expense; Other operating income – net; D&A impairment charge and merger costs.
The Company uses OIBDAN, among other things, to evaluate the Company's operating performance. This measure is among the primary measures used by
management for planning and forecasting of future periods, as well as for measuring performance for compensation of executives and other members of management.
This measure is an important indicator of the Company's operational strength and performance of its business because it provides a link between profitability and cash
flows from operating activities. It is also a primary measure used by management in evaluating companies as potential acquisition targets.
The Company believes the presentation of this measure is relevant and useful for investors because it allows investors to view performance in a manner similar to the
method used by the Company's management. It helps improve investors’ ability to understand the Company's operating performance and makes it easier to compare the
Company's results with other companies that have different capital structures, stock option structures or tax rates. In addition, this measure is also among the primary
measures used externally by the Company's investors, analysts and peers in its industry for purposes of valuation and comparing the operating performance of the
Company to other companies in its industry. Additionally, the Company’s bank credit facilities use this measure for compliance with leverage covenants.
15. Since OIBDAN is not a measure calculated in accordance with GAAP, it should not be considered in isolation of, or as a substitute for, net income as an indicator of
operating performance and may not be comparable to similarly titled measures employed by other companies. OIBDAN is not necessarily a measure of the Company's
ability to fund its cash needs. As it excludes certain financial information compared with operating income and net income (loss), the most directly comparable GAAP
financial measures, users of this financial information should consider the types of events and transactions, which are excluded.
In addition, because a significant portion of the Company’s advertising operations are conducted in foreign markets, principally France and the United Kingdom,
management reviews the operating results from its foreign operations on a constant dollar basis. A constant dollar basis (i.e. a foreign currency adjustment is made to
the 2008 actual foreign revenues and expenses at average 2007 foreign exchange rates) allows for comparison of operations independent of foreign exchange
movements.
As required by the SEC, the Company provides reconciliations below to the most directly comparable amounts reported under GAAP, including (i) OIBDAN for each
segment to consolidated operating income; (ii) Revenue excluding foreign exchange effects to revenue; (iii) Expense excluding foreign exchange effects to expenses;
and (iv) OIBDAN to net income.
(In thousands) Other
operating
income – net,
Merger costs
Non-cash Depreciation and
Operating compensation and Impairment
income (loss) expense amortization Chg. OIBDAN
Three Months Ended December 31, 2008
Radio Broadcasting $ 128,407 $ 2,101 $ 73,295 $ — $ 203,803
Outdoor 15,537 2,234 143,698 — 161,469
Other (8,113) 68 16,056 — 8,011
Other operating income – net 12,363 — — (12,363) —
Merger costs (68,085) — — 68,085 —
Impairment charge (5,268,858) 5,268,858
Corporate (75,733) 4,969 6,852 — (63,912)
Consolidated $ (5,264,482) $ 9,372 $ 239,901 $ 5,324,580 $ 309,371
Three Months Ended December 31, 2007
Radio Broadcasting $ 308,758 $ 5,475 $ 24,499 $ — $ 338,732
Outdoor 209,158 3,014 105,867 — 318,039
Other (3,328) — 11,561 — 8,233
Other operating income – net 2,492 — — (2,492) —
Merger costs (390) — — 390 —
Corporate (47,326) 3,042 4,056 — (40,228)
Consolidated $ 469,364 $ 11,531 $ 145,983 $ (2,102) $ 624,776
Year Ended December 31, 2008
Radio Broadcasting $ 979,121 $ 37,785 $ 152,822 $ — $ 1,169,728
Outdoor 328,431 10,632 472,350 — 811,413
Other (31,419) 1,276 53,688 — 23,545
Other operating income – net 28,032 — — (28,032) —
Merger costs (155,769) — — 155,769 —
Impairment charge (5,268,858) 5,268,858
Corporate (245,915) 28,941 17,970 — (199,004)
Consolidated $ (4,366,377) $ 78,634 $ 696,830 $ 5,396,595 $ 1,805,682
Year Ended December 31, 2007
Radio Broadcasting $ 1,278,019 $ 22,226 $ 107,466 $ — $ 1,407,711
Outdoor 609,514 9,633 399,483 — 1,018,630
Other (11,659) — 43,436 — 31,777
Other operating income – net 14,113 — — (14,113) —
Merger costs (6,762) — — 6,762 —
Corporate (197,746) 12,192 16,242 — (169,312)
Consolidated $ 1,685,479 $ 44,051 $ 566,627 $ (7,351) $ 2,288,806
17. Reconciliation of OIBDAN to Net income
(In thousands) Three Months Ended % Year Ended %
December 31, Change December 31, Change
2008 2007 2008 2007
OIBDAN $ 309,371 $ 624,776 (50%) $ 1,805,682 $ 2,288,806 (21%)
Non-cash compensation expense 9,372 11,531 78,634 44,051
Depreciation & amortization 239,901 145,983 696,830 566,627
Merger costs 68,085 390 155,769 6,762
Impairment charge 5,268,858 — 5,268,858 —
Other operating income – net 12,363 2,492 28,032 14,113
Operating Income (loss) (5,264,482) 469,364 (4,366,377) 1,685,479
Interest expense 434,289 104,345 928,978 451,870
Gain (loss) on marketable securities (116,552) 6,081 (82,290) 6,742
Equity in earnings of nonconsolidated affiliates 3,707 11,344 100,019 35,176
Other income (expense) – net 142,419 6,401 126,393 5,326
Income (loss) before income taxes, minority interest and discontinued operations (5,669,197) 388,845 (5,151,233) 1,280,853
Income tax (expense) benefit:
Current 38,512 (84,817) 49,449 (252,910)
Deferred 624,902 (55,954) 474,591 (188,238)
Income tax (expense) benefit 663,414 (140,771) 524,040 (441,148)
Minority interest income (expense), net of tax 9,349 (19,824) (16,671) (47,031)
Income (loss) before discontinued operations (4,996,434) 228,250 (4,643,864) 792,674
Income (loss) from discontinued operations (832) 92,309 638,391 145,833
Net income (loss) $ (4,997,266) $ 320,559 $ (4,005,473) $ 938,507
About CC Media Holdings, Inc.
CC Media Holdings, the parent company of Clear Channel Communications, is a global media and entertainment company specializing in mobile and on-demand
entertainment and information services for local communities and premiere opportunities for advertisers. The company's businesses include radio and outdoor displays.
More information is available at www.ccmediaholdings.com or www.clearchannel.com.
18. Certain statements in this document constitute “forward-looking statements” within the meaning of the Private Securities Litigation Reform Act of 1995. Such
forward-looking statements involve known and unknown risks, uncertainties and other factors which may cause the actual results, performance or achievements of
CC Media Holdings/Clear Channel Communications to be materially different from any future results, performance or achievements expressed or implied by such
forward-looking statements. The words or phrases “guidance,” “believe,” “expect,” “anticipate,” “estimates” and “forecast” and similar words or expressions are
intended to identify such forward-looking statements. In addition, any statements that refer to expectations or other characterizations of future events or
circumstances are forward-looking statements.
Various risks that could cause future results to differ from those expressed by the forward-looking statements included in this document include, but are not limited
to: changes in business, political and economic conditions in the U.S. and in other countries in which CC Media Holdings/Clear Channel Communications
currently does business (both general and relative to the advertising industry); fluctuations in interest rates; changes in operating performance; shifts in population
and other demographics; changes in the level of competition for advertising dollars; fluctuations in operating costs; technological changes and innovations;
changes in labor conditions; changes in governmental regulations and policies and actions of regulatory bodies; fluctuations in exchange rates and currency
values; changes in tax rates; and changes in capital expenditure requirements; access to capital markets and changes in credit ratings. Other unknown or
unpredictable factors also could have material adverse effects on CC Media Holdings/Clear Channel Communications’ future results, performance or
achievements. In light of these risks, uncertainties, assumptions and factors, the forward-looking events discussed in this document may not occur. You are
cautioned not to place undue reliance on these forward-looking statements, which speak only as of the date stated, or if no date is stated, as of the date of this
document. Other key risks are described in CC Media Holdings/Clear Channel Communications’ reports filed with the U.S. Securities and Exchange Commission,
including in the section entitled “Item 1A. Risk Factors” of CC Media Holdings’ Second Quarter Report on Form 10-Q for the period ended June 30, 2008 or CC
Media Holdings’ Annual Report on Form 10-K for the period ended December 31, 2008, which should be filed in the near-term. Except as otherwise stated in this
document, CC Media Holdings/Clear Channel Communications does not undertake any obligation to publicly update or revise any forward-looking statements
because of new information, future events or otherwise.
CONTACT:
CC Media Holdings, Inc.
Investors:
Randy Palmer, 210-832-3315
Senior Vice President of Investor Relations
or
Media:
Lisa Dollinger, 210-832-3474
Chief Communications Officer
http://www.clearchannel.com