
Recommended
More Related Content
Similar to Clarify Decision-Making Tool Infographics by Slidesgo.pptx
Similar to Clarify Decision-Making Tool Infographics by Slidesgo.pptx (20)
Recently uploaded
Recently uploaded (20)
Clarify Decision-Making Tool Infographics by Slidesgo.pptx
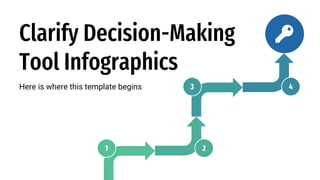
- 1. Clarify Decision-Making Tool Infographics Here is where this template begins 1 2 3 4
- 2. Clarify Decision-Making Tool Infographics Recommend Mercury is the closest planet to the Sun 01 Agree Jupiter is the biggest planet of them all 02 Perform Despite being red, Mars is a very cold place 03 Input Earth is the third planet from the Sun 04 Decide Venus has a beautiful name but is very hot 05
- 3. Clarify Decision-Making Tool Infographics Support Mercury is the closest planet to the Sun Decision Jupiter is the biggest planet of them all Agree Earth is the third planet from the Sun Recommend Despite being red, Mars is a very cold place
- 4. Clarify Decision-Making Tool Infographics Follow the link in the graph to modify its data and then paste the new one here. For more info, click here Recommend Mercury is the closest planet to the Sun 30% Agree Jupiter is the biggest planet of them all 30% Input Earth is the third planet from the Sun 10% Perform Despite being red, Mars is a very cold place 20% Decide Venus has a beautiful name but is very hot 10%
- 5. Clarify Decision-Making Tool Infographics A Mercury Mercury is the closest planet to the Sun 50% B Venus Venus has a beautiful name but is hot 25%
- 6. Clarify Decision-Making Tool Infographics R A P I D Recommend Earth is the third planet from the Sun 01 Agree Mercury is the closest planet to the Sun 02 Perform Jupiter is the biggest planet of them all 03 Input Despite being red, Mars is a very cold place 04 Decide Venus has a beautiful name but is very hot 05
- 7. Clarify Decision-Making Tool Infographics Recommend Earth is the third planet from the Sun R Agree Mercury is the closest planet to the Sun A Input Despite being red, Mars is a cold place I Perform Jupiter is the biggest planet of them all P Decide Venus has a beautiful name but is very hot D
- 8. Clarify Decision-Making Tool Infographics What? Earth is the third planet from the Sun 01 When? Despite being red, Mars is a cold place 03 How? Jupiter is the biggest planet of them all 04 Who? Venus has a beautiful name but is very hot 02 RAPID Saturn has several rings
- 9. Clarify Decision-Making Tool Infographics Team Area Task John Helena Timmy Planning Deliverable A R Deliverable B P D Execution Deliverable A I Deliverable B P A Evaluation Deliverable A I R: Recommend P: Perform A: Agree I: Input D: Decide
- 10. Clarify Decision-Making Tool Infographics Recommend Earth is the third planet from the Sun 01 Agree Mercury is the closest planet to the Sun 02 Perform Jupiter is the biggest planet of them all 03 Input Despite being red, Mars is a cold place 04
- 11. Clarify Decision-Making Tool Infographics Follow the link in the graph to modify its data and then paste the new one here. For more info, click here Venus Venus has a beautiful name 60% Jupiter It’s the biggest one of them all 30% Mercury It’s the closest planet to the Sun 10%
- 12. Clarify Decision-Making Tool Infographics Perform Despite being red, Mars is a cold place Decide Venus has a beautiful name but is very hot Recommend Earth is the third planet from the Sun Input Mercury is the closest planet to the Sun Agree Jupiter is the biggest planet of them all
- 13. Team Charles Marta Lucy Area Task R Creative Deliverable A P D Deliverable B I Content Deliverable A P A Deliverable B I Legal Deliverable A Clarify Decision-Making Tool Infographics R: Recommend P: Perform A: Agree I: Input D: Decide
- 14. Clarify Decision-Making Tool Infographics Recommend Earth is the third planet from the Sun R Agree Mercury is the closest planet to the Sun A Input Despite being red, Mars is a cold place I Perform Jupiter is the biggest planet of them all P Decide Venus has a beautiful name but is hot D
- 15. Clarify Decision-Making Tool Infographics Recommend Earth is the third planet from the Sun 01 Agree Mercury is the closest planet to the Sun 02 Perform Despite being red, Mars is a cold place 03 Input Jupiter is the biggest planet of them all 04
- 16. Clarify Decision-Making Tool Infographics Debate Decide Decide Debate Prepare Mercury is the closest planet to the Sun Commit Jupiter is the biggest planet of them all Present / Discuss Despite being red, Mars is a cold place Pre-decision In the action Upon decision
- 17. Clarify Decision-Making Tool Infographics Mercury Mercury is the closest planet to the Sun Step 1 Jupiter Jupiter is the biggest planet of them all Step 2 Mars Despite being red, Mars is a very cold place Step 3 Venus Venus has a beautiful name but is hot Step 4
- 18. Clarify Decision-Making Tool Infographics Follow the link in the graph to modify its data and then paste the new one here. For more info, click here Recommend Venus has a beautiful name 60% Agree Neptune is far away from Earth 30%
- 19. Clarify Decision-Making Tool Infographics Marketing Medical Regulation Creative Sales Before R D R D I P I After Despite being red, Mars is a very cold place full of iron oxide dust Target R D I P Words D A A I P I R: Recommend P: Perform A: Agree I: Input D: Decide
- 20. Clarify Decision-Making Tool Infographics Follow the link in the graph to modify its data and then paste the new one here. For more info, click here Recommend Earth harbors life Agree Mercury is very small Perform Mars is very cold Input Jupiter is very big
- 21. Clarify Decision-Making Tool Infographics D R A I P Recommend Earth is the third planet from the Sun Agree Mercury is the closest planet to the Sun Input Despite being red, Mars is a cold place Perform Jupiter is the biggest planet of them all Decide Venus has a beautiful name but is hot
- 22. Clarify Decision-Making Tool Infographics Mercury Mercury is the closest planet to the Sun 01 30% Jupiter Jupiter is the biggest planet of them all 02 70%
- 23. Clarify Decision-Making Tool Infographics Complex decisions Venus has a beautiful name but is actually very hot Responsibles Mercury is the closest planet to the Sun Time Jupiter is the biggest planet of them all In charge Earth is the third planet from the Sun Involved Despite being red, Mars is a very cold place
- 24. Clarify Decision-Making Tool Infographics Mercury Mercury is the closest planet to the Sun Step 1 Jupiter Jupiter is the biggest planet of them all Step 2 Mars Despite being red, Mars is a very cold place Step 3
- 25. Clarify Decision-Making Tool Infographics Recommend Earth is the third planet from the Sun 01 Agree Mercury is the closest planet to the Sun 02 Perform Despite being red, Mars is a cold place 03 Input Jupiter is the biggest planet of them all 04
- 26. Clarify Decision-Making Tool Infographics Decide Venus has a beautiful name but is very hot D Recommend Mercury is the closest planet to the Sun R Perform Despite being red, Mars is a very cold place P Agree Jupiter is the biggest planet of them all A Input Earth is the third planet from the Sun I
- 27. Clarify Decision-Making Tool Infographics Venus Venus has a beautiful name 100% Jupiter Jupiter is a really big planet 50% Mercury It’s the closest planet to the Sun 75% Follow the link in the graph to modify its data and then paste the new one here. For more info, click here
- 28. Infographics You can add and edit some infographics to your presentation to present your data in a visual way. ● Choose your favourite infographic and insert it in your presentation using Ctrl C + Ctrl V or Cmd C + Cmd V in Mac. ● Select one of the parts and ungroup it by right-clicking and choosing “Ungroup”. ● Change the color by clicking on the paint bucket. ● Then resize the element by clicking and dragging one of the square-shaped points of its bounding box (the cursor should look like a double-headed arrow). Remember to hold Shift while dragging to keep the proportions. ● Group the elements again by selecting them, right-clicking and choosing “Group”. ● Repeat the steps above with the other parts and when you’re done editing, copy the end result and paste it into your presentation. ● Remember to choose the “Keep source formatting” option so that it keeps the design. For more info, please visit Slidesgo School.