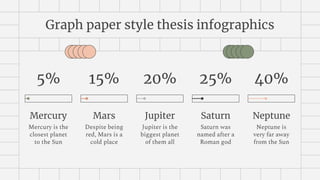
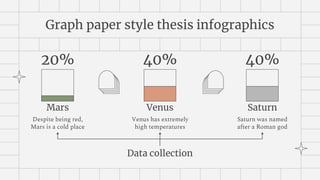
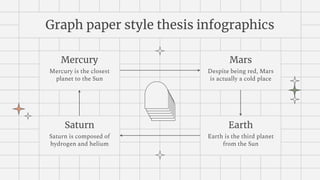
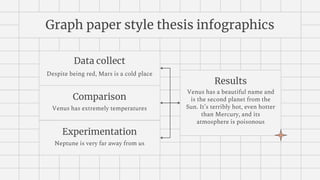
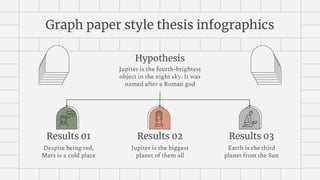
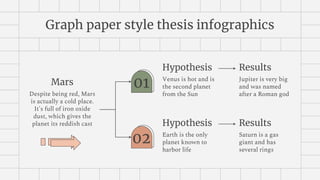
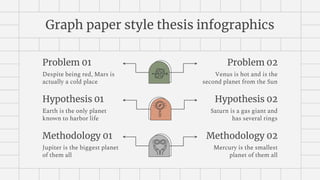
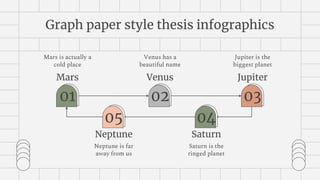
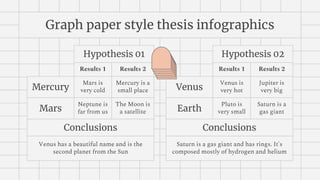
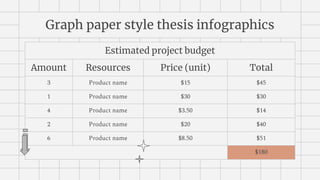
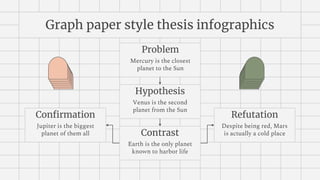
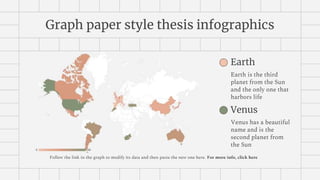
This document provides instructions for using infographic elements from a graph paper style thesis template. It explains that premium users can use the template without attribution, while free users must credit Slidesgo. It describes how to copy, paste, ungroup, edit colors and sizes, and regroup infographic elements to integrate them into a presentation while maintaining the template's design. Users are directed to FAQs and a blog for more help on editing slides.
Water scarcity is the lack of fresh water resources to meet the standard water demand. There are two type of water scarcity. One is physical. The other is economic water scarcity.
More Related Content
Similar to Graph Paper Style Thesis Infographics by Slidesgo.pptx
Water scarcity is the lack of fresh water resources to meet the standard water demand. There are two type of water scarcity. One is physical. The other is economic water scarcity.
Hybrid optimization of pumped hydro system and solar- Engr. Abdul-Azeez.pdffxintegritypublishin
Advancements in technology unveil a myriad of electrical and electronic breakthroughs geared towards efficiently harnessing limited resources to meet human energy demands. The optimization of hybrid solar PV panels and pumped hydro energy supply systems plays a pivotal role in utilizing natural resources effectively. This initiative not only benefits humanity but also fosters environmental sustainability. The study investigated the design optimization of these hybrid systems, focusing on understanding solar radiation patterns, identifying geographical influences on solar radiation, formulating a mathematical model for system optimization, and determining the optimal configuration of PV panels and pumped hydro storage. Through a comparative analysis approach and eight weeks of data collection, the study addressed key research questions related to solar radiation patterns and optimal system design. The findings highlighted regions with heightened solar radiation levels, showcasing substantial potential for power generation and emphasizing the system's efficiency. Optimizing system design significantly boosted power generation, promoted renewable energy utilization, and enhanced energy storage capacity. The study underscored the benefits of optimizing hybrid solar PV panels and pumped hydro energy supply systems for sustainable energy usage. Optimizing the design of solar PV panels and pumped hydro energy supply systems as examined across diverse climatic conditions in a developing country, not only enhances power generation but also improves the integration of renewable energy sources and boosts energy storage capacities, particularly beneficial for less economically prosperous regions. Additionally, the study provides valuable insights for advancing energy research in economically viable areas. Recommendations included conducting site-specific assessments, utilizing advanced modeling tools, implementing regular maintenance protocols, and enhancing communication among system components.
Immunizing Image Classifiers Against Localized Adversary Attacksgerogepatton
This paper addresses the vulnerability of deep learning models, particularly convolutional neural networks
(CNN)s, to adversarial attacks and presents a proactive training technique designed to counter them. We
introduce a novel volumization algorithm, which transforms 2D images into 3D volumetric representations.
When combined with 3D convolution and deep curriculum learning optimization (CLO), itsignificantly improves
the immunity of models against localized universal attacks by up to 40%. We evaluate our proposed approach
using contemporary CNN architectures and the modified Canadian Institute for Advanced Research (CIFAR-10
and CIFAR-100) and ImageNet Large Scale Visual Recognition Challenge (ILSVRC12) datasets, showcasing
accuracy improvements over previous techniques. The results indicate that the combination of the volumetric
input and curriculum learning holds significant promise for mitigating adversarial attacks without necessitating
adversary training.
Saudi Arabia stands as a titan in the global energy landscape, renowned for its abundant oil and gas resources. It's the largest exporter of petroleum and holds some of the world's most significant reserves. Let's delve into the top 10 oil and gas projects shaping Saudi Arabia's energy future in 2024.
Sachpazis:Terzaghi Bearing Capacity Estimation in simple terms with Calculati...Dr.Costas Sachpazis
Terzaghi's soil bearing capacity theory, developed by Karl Terzaghi, is a fundamental principle in geotechnical engineering used to determine the bearing capacity of shallow foundations. This theory provides a method to calculate the ultimate bearing capacity of soil, which is the maximum load per unit area that the soil can support without undergoing shear failure. The Calculation HTML Code included.
Cosmetic shop management system project report.pdfKamal Acharya
Buying new cosmetic products is difficult. It can even be scary for those who have sensitive skin and are prone to skin trouble. The information needed to alleviate this problem is on the back of each product, but it's thought to interpret those ingredient lists unless you have a background in chemistry.
Instead of buying and hoping for the best, we can use data science to help us predict which products may be good fits for us. It includes various function programs to do the above mentioned tasks.
Data file handling has been effectively used in the program.
The automated cosmetic shop management system should deal with the automation of general workflow and administration process of the shop. The main processes of the system focus on customer's request where the system is able to search the most appropriate products and deliver it to the customers. It should help the employees to quickly identify the list of cosmetic product that have reached the minimum quantity and also keep a track of expired date for each cosmetic product. It should help the employees to find the rack number in which the product is placed.It is also Faster and more efficient way.
Cosmetic shop management system project report.pdf
Graph Paper Style Thesis Infographics by Slidesgo.pptx
1. Here is where this template begins
Graph Paper
Style Thesis
2. About graph paper style thesis infographics
● This template contains an assortment of complementary infographic resources
for the Graph Paper Style Thesis presentation.
● These infographics are adapted to the style of the aforementioned presentation,
so you can insert them easily and have them completely integrated at once. You
just need to do the following:
○ Select the element that you want to copy
○ Right-click and choose “Copy”
○ Go to the slide where you want the element to appear
○ Right-click and choose “Paste”
3. Graph paper style thesis infographics
Mars
Despite being red,
Mars is a cold place
10%
Neptune
Neptune is very far
away from the Sun
20%
Jupiter
Jupiter is the biggest
planet of them all
30%
Venus
Venus has a beautiful
name, but it’s very
hot
40%
4. Graph paper style thesis infographics
01 02 03
Mercury Venus is the
second planet
from the Sun
Jupiter is the
biggest planet
of them all
Saturn is a gas
giant and has
many rings
Mercury is the closest planet to the
Sun and the smallest of them all
Mars Neptune is
very far away
from the Sun
Earth is the
planet where
we all live
Pluto is now
considered a
dwarf planet
Despite being red, Mars is actually
a very cold place
5. Graph paper style thesis infographics
Mon Tue Wed Thu Fri
9:00h Data collect
10:00h Data study
11:00h Comparison
12:00h Comparison
13:00h Comparison
14:00h Results collect
6. Graph paper style thesis infographics
Author Year Title Institution Place
Jane Doe 2XXX Mercury Is Small University of Mercury Mercury
Helena Harris 2XXX Neptune Is Far From Us University of Neptune Neptune
Danny Thomson 2XXX Venus Is A Hot Place University of Venus Venus
Timmy Jimmy 2XXX Jupiter Is A Big Planet University of Jupiter Jupiter
John Morris 2XXX Mars Is Very Cold University of Mars Mars
7. Graph paper style thesis infographics
Phase 01
● Mercury is the
smallest planet
● Saturn is the
ringed planet
● Venus has a
beautiful name
Phase 02
● Despite being red,
Mars is very cold
● Jupiter is the
biggest planet
● Earth is the planet
where we all live
Phase 03
● Neptune is very
far away from us
● The Moon is
Earth’s satellite
● Pluto is a dwarf
planet. It’s small
8. Graph paper style thesis infographics
Hypothesis 01
Mercury is the closest
planet to the Sun
Ceres is in an
asteroid belt
Jupiter is the
biggest planet
Hypothesis 02
Mars is made of basalt
and it’s a red planet
Pluto is now a
dwarf planet
Saturn is the
ringed planet
Hypothesis 02
Saturn is composed of
hydrogen and helium
Mercury is the
smallest planet
Venus has a
beautiful name
9. Graph paper style thesis infographics
Mercury
Mercury is the closest planet to the
Sun and the smallest of them all
● Neptune is far away from us
● Saturn is the ringed planet
● Jupiter is the biggest planet
Mars
Despite being red, Mars is a cold place
10%
Venus
Venus has extremely high temperatures
90%
10. Graph paper style thesis infographics
Objectives
Mercury is the closest
planet to the Sun and
the smallest of them all
Mercury
Mercury is the
smallest planet
01
Saturn
Saturn is the
ringed planet
02
Mars
Despite being
red, Mars is cold
03
Venus
Venus has a
beautiful name
04
Earth
Earth is the
planet with life
05
Neptune
Neptune is far
away from us
06
11. Graph paper style thesis infographics
Methodology 01 Methodology 02 Methodology 03
Mercury is the closest planet
to the Sun and the smallest
Earth is the third planet from
the Sun and harbors life
Despite being red, Mars is
actually a cold place
Methods
Mars is cold
Methods
Ceres is small
Methods
Saturn has rings
Venus is hot Neptune is far Jupiter is big
12. Graph paper style thesis infographics
Mercury
Mercury is the
closest planet
to the Sun
5%
Mars
Despite being
red, Mars is a
cold place
15%
Jupiter
Jupiter is the
biggest planet
of them all
20%
Saturn
Saturn was
named after a
Roman god
25%
Neptune
Neptune is
very far away
from the Sun
40%
13. Graph paper style thesis infographics
Mars
Despite being red,
Mars is a cold place
20%
Venus
Venus has extremely
high temperatures
40%
Saturn
Saturn was named
after a Roman god
40%
Data collection
14. Graph paper style thesis infographics
Mercury
Mercury is the closest
planet to the Sun
Mars
Despite being red, Mars
is actually a cold place
Saturn
Saturn is composed of
hydrogen and helium
Earth
Earth is the third planet
from the Sun
15. Graph paper style thesis infographics
Data collect
Despite being red, Mars is a cold place
Comparison
Venus has extremely temperatures
Experimentation
Neptune is very far away from us
Results
Venus has a beautiful name and
is the second planet from the
Sun. It’s terribly hot, even hotter
than Mercury, and its
atmosphere is poisonous
16. Graph paper style thesis infographics
Week 1 Week 2 Week 3 Week 4
Task 1
Task 2
Task 3
Task 4
Task 5
Not started In progress Completed
17. Graph paper style thesis infographics
Month, 2XXX
Mon Tue Wed Thu Fri Sat Sun
1 2 3 4
5 6 7 8 9 10 11
12 13 14 15 16 17 18
19 20 21 22 23 24 25
26 27 28 29 30 31
Data collect
Deadline: Fri 2nd
Planning
Deadline: Sat 10th
Write article
Deadline: Thu 22nd
Results show
Deadline: Sat 31st
18. Graph paper style thesis infographics
Day, Month, 2XXX
Timetable Tasks Check
9:00h-11:00h Task name Mars is a cold planet Yes
11:00h-12:30h Task name Venus has high temperatures No
12:30h-13:00h Task name Jupiter is the biggest planet Yes
16:00h-18:00h Task name Neptune is far away from us Yes
18:00h-20:00h Task name Earth is the planet with life No
19. Graph paper style thesis infographics
01
Mercury
Mercury is the
smallest planet
02
Mars
Mars is a very
cold planet
03
Venus
Venus has a
beautiful name
04
Jupiter
Jupiter is the
biggest planet
05
Earth
Earth is the
planet we live on
20. Graph paper style thesis infographics
Jupiter is the fourth-brightest
object in the night sky. It was
named after a Roman god
Hypothesis
Results 01
Despite being red,
Mars is a cold place
Results 02
Jupiter is the biggest
planet of them all
Results 03
Earth is the third
planet from the Sun
21. Graph paper style thesis infographics
Mars
Despite being red, Mars
is actually a cold place.
It's full of iron oxide
dust, which gives the
planet its reddish cast
Results
Jupiter is very big
and was named
after a Roman god
Results
Saturn is a gas
giant and has
several rings
Hypothesis
Venus is hot and is
the second planet
from the Sun
01
Hypothesis
Earth is the only
planet known to
harbor life
02
22. Graph paper style thesis infographics
Problem 01
Despite being red, Mars is
actually a cold place
Problem 02
Venus is hot and is the
second planet from the Sun
Hypothesis 01
Earth is the only planet
known to harbor life
Hypothesis 02
Saturn is a gas giant and
has several rings
Methodology 01
Jupiter is the biggest planet
of them all
Methodology 02
Mercury is the smallest
planet of them all
23. Graph paper style thesis infographics
Mars
Mars is actually a
cold place
01 02
Venus
Venus has a
beautiful name
03
Jupiter
Jupiter is the
biggest planet
05
Neptune
Neptune is far
away from us
04
Saturn
Saturn is the
ringed planet
24. Graph paper style thesis infographics
Theoretical framework 1
Mercury is the closest planet to the Sun
and the smallest one in the Solar System
Theoretical framework 2
Earth is the third planet from the Sun and
where we all live on
Venus is the second planet
from the Sun
Despite being red, Mars is
actually a cold place
Jupiter is the biggest
planet of them all
25. Graph paper style thesis infographics
Follow the link in the graph to modify its data and then paste the new one here. For more info, click here
Results analysis progress
Mercury is the closest planet to the Sun
and the smallest one in the Solar System
5% to 95%
Data collect progress
Venus has a beautiful name and is the
second planet from the Sun
15% to 80%
26. Graph paper style thesis infographics
Mars
Despite being red,
Mars is a cold place
15%
Jupiter
Jupiter is the
biggest planet
30%
Saturn
Saturn was named
after a Roman god
55%
Follow the link in the graph to modify its data and then
paste the new one here. For more info, click here
27. Graph paper style thesis infographics
Positive results
Mercury is the closest
planet to the Sun
Positive results
Saturn was named after a
Roman god
Positive results
Neptune is the farthest
planet from the Sun
Negative results
Despite being red, Mars is
actually a cold place
Negative results
Earth is the only planet
known to harbor life
Negative results
Venus has a beautiful name
and high temperatures
28. Graph paper style thesis infographics
Hypothesis 01
Results 1 Results 2
Mercury
Mars is
very cold
Mercury is a
small place
Mars
Neptune is
far from us
The Moon is
a satellite
Conclusions
Venus has a beautiful name and is the
second planet from the Sun
Hypothesis 02
Results 1 Results 2
Venus
Venus is
very hot
Jupiter is
very big
Earth
Pluto is
very small
Saturn is a
gas giant
Conclusions
Saturn is a gas giant and has rings. It's
composed mostly of hydrogen and helium
29. Graph paper style thesis infographics
Estimated project budget
Amount Resources Price (unit) Total
3 Product name $15 $45
1 Product name $30 $30
4 Product name $3.50 $14
2 Product name $20 $40
6 Product name $8.50 $51
$180
30. Graph paper style thesis infographics
Problem
Mercury is the closest
planet to the Sun
Hypothesis
Venus is the second
planet from the Sun
Contrast
Earth is the only planet
known to harbor life
Confirmation
Jupiter is the biggest
planet of them all
Refutation
Despite being red, Mars
is actually a cold place
31. Graph paper style thesis infographics
Venus
Venus has a beautiful
name and is the
second planet from
the Sun
Earth
Earth is the third
planet from the Sun
and the only one that
harbors life
Follow the link in the graph to modify its data and then paste the new one here. For more info, click here
32. Graph paper style thesis infographics
Author Title Important quotes Pages
John Doe Mars is cold
“Despite being red, Mars is actually a cold
place. It's full of iron oxide dust”
125-126
“Earth is the third planet from the Sun and
the only one that harbors life”
241
Jenna Harris Mercury is small
“Jupiter is a gas giant and the biggest planet
in the Solar System”
15-16
“Saturn is a gas giant and has several rings.
It's composed mostly of hydrogen and helium”
36-37
33. Instructions for use
For more information about editing slides, please read our FAQs or visit our blog:
https://slidesgo.com/faqs and https://slidesgo.com/slidesgo-school
If you have a free account, in order to use this template, you must credit Slidesgo in your final presentation. Please refer
to the next slide to read the instructions for premium users.
As a Free user, you are allowed to:
- Modify this template.
- Use it for both personal and commercial projects.
You are not allowed to:
- Sublicense, sell or rent any of Slidesgo Content (or a modified version of Slidesgo Content).
- Distribute Slidesgo Content unless it has been expressly authorized by Slidesgo.
- Include Slidesgo Content in an online or offline database or file.
- Offer Slidesgo templates (or modified versions of Slidesgo templates) for download.
- Acquire the copyright of Slidesgo Content.
34. Instructions for use (premium users)
As a Premium user, you can use this template without attributing Slidesgo.
You are allowed to:
● Modify this template.
● Use it for both personal and commercial purposes.
● Share this template in an editable format with people who are not part of your team.
You are not allowed to:
● Sublicense, sell or rent this Slidesgo Template (or a modified version of this Slidesgo Template).
● Distribute this Slidesgo Template (or a modified version of this Slidesgo Template) or include it in a database or in
any other product or service that offers downloadable images, icons or presentations that may be subject to
distribution or resale.
● Use any of the elements that are part of this Slidesgo Template in an isolated and separated way from this
Template.
● Register any of the elements that are part of this template as a trademark or logo, or register it as a work in an
intellectual property registry or similar.
For more information about editing slides, please read our FAQs or visit our blog:
https://slidesgo.com/faqs and https://slidesgo.com/slidesgo-school
35. Infographics
You can add and edit some infographics to your presentation to present your data in a visual way.
● Choose your favourite infographic and insert it in your presentation using Ctrl C
+ Ctrl V or Cmd C + Cmd V in Mac.
● Select one of the parts and ungroup it by right-clicking and choosing
“Ungroup”.
● Change the color by clicking on the paint bucket.
● Then resize the element by clicking and dragging one of the square-shaped
points of its bounding box (the cursor should look like a double-headed arrow).
Remember to hold Shift while dragging to keep the proportions.
● Group the elements again by selecting them, right-clicking and choosing
“Group”.
● Repeat the steps above with the other parts and when you’re done editing, copy
the end result and paste it into your presentation.
● Remember to choose the “Keep source formatting” option so that it keeps the
design. For more info, please visit our blog.