Active Strategy: Automated Balanced Scorecard
•
1 like•1,011 views

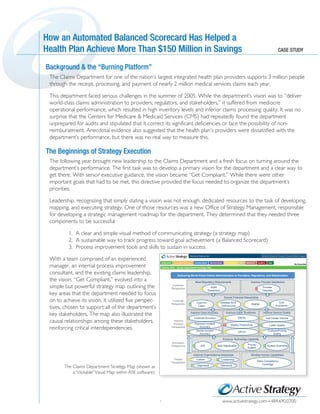
How an Automated Balanced Scorecard Has Helped a Health Plan Achieve More Than $150 Million in Savings. 2009 CASE STUDY

Recommended
Recommended
More Related Content
Similar to Active Strategy: Automated Balanced Scorecard
Similar to Active Strategy: Automated Balanced Scorecard (20)
More from Medical Optima
More from Medical Optima (9)
Recently uploaded
Recently uploaded (20)
Active Strategy: Automated Balanced Scorecard
- 1. Background & the “burning Platform” TM www.activestrategy.com 484.690.0700 Background & the “Burning Platform” The Claims Department for one of the nation’s largest integrated health plan providers supports 3 million people through the receipt, processing, and payment of nearly 2 million medical services claims each year. This department faced serious challenges in the summer of 2005. While the department’s vision was to “deliver world-class claims administration to providers, regulators, and stakeholders,” it suffered from mediocre operational performance, which resulted in high inventory levels and inferior claims processing quality. It was no surprise that the Centers for Medicare & Medicaid Services (CMS) had repeatedly found the department unprepared for audits and stipulated that it correct its significant deficiencies or face the possibility of non- reimbursement. Anecdotal evidence also suggested that the health plan’s providers were dissatisfied with the department’s performance, but there was no real way to measure this. The following year brought new leadership to the Claims Department and a fresh focus on turning around the department’s performance. The first task was to develop a primary vision for the department and a clear way to get there. With senior executive guidance, the vision became “Get Compliant.” While there were other important goals that had to be met, this directive provided the focus needed to organize the department’s priorities. Leadership, recognizing that simply stating a vision was not enough, dedicated resources to the task of developing, mapping, and executing strategy. One of those resources was a new Office of Strategy Management, responsible for developing a strategic management roadmap for the department. They determined that they needed three components to be successful: 1. A clear and simple visual method of communicating strategy (a strategy map) 2. A sustainable way to track progress toward goal achievement (a Balanced Scorecard) 3. Process improvement tools and skills to sustain in success 1 The Beginnings of Strategy ExecutionThe Beginnings of Strategy Execution How an Automated Balanced Scorecard Has Helped a Health Plan Achieve More Than $150 Million in Savings How an Automated Balanced Scorecard Has Helped a Health Plan Achieve More Than $150 Million in Savings CASE STUDY With a team comprised of an experienced manager, an internal process improvement consultant, and the existing claims leadership, the vision, “Get Compliant,” evolved into a simple but powerful strategy map outlining the key areas that the department needed to focus on to achieve its vision. It utilized five perspec- tives, chosen to support all of the department’s key stakeholders. The map also illustrated the causal relationships among these stakeholders, reinforcing critical interdependencies. The Claims Department Strategy Map (shown as a “clickable”Visual Map within ASE software). STRATEGY BUSINESS REVIEW SCORECARDS INITIATIVES PROCESSES PGM REPORTS ALERTS ASU Welcome Martha Carr My Favorites Refresh Home Chooser Guide Help Logout VISUAL MAP - Claims Department Strategy Map Delivering World-Class Claims Administration to Providers, Regulators, and Stakeholders Meet Regulatory Requirements Improve Provider Satisfaction Ensure Financial Stewardship Improve Claim Accuracy Improve Claim Timeliness Improve Service Quality Enhance Technology Capability Improve Organizational Awareness Develop Human Capabilities Customer Perspective Financial Perspective Internal Process Perspective Innovation Perspective People Perspective Audit Readiness Provider Disputes Cost Per Claim Address SOX Deficiencies PMPM Cost Avoidance Financial Accuracy Payment Incident Accuracy Denial Incident Accuracy DROH Weekly Productivity DPOH Call Center Volume Letter Quality Contract/Pricing Quality EDI Auto Adjudication Pricing System System Downtime CulC Culture Alignment Leadership Teamwork Skills Competency Coverage
- 2. TM www.activestrategy.com 484.690.0700 The department then began creating a Balanced Scorecard to help drive the changes to achieve the vision set out in the new strategy map. The Balanced Scorecard built upon the strategy map, mirroring its perspectives and objectives, plus adding carefully defined and focused measures. Each measure was assigned an owner to build in accountability. Once the strategy map and Balanced Scorecard were built, the department leadership began actively using them to manage performance and drive toward their goal of getting compliant. But soon into this effort, the limits of the desktop spreadsheet and presentation tools they were using to manage their Balanced Scorecard became obvious. The software was cumbersome and ill-suited to managing a real strategy execution deployment. As the Office of Strategy Management was struggling to effectively organize and deploy the Claims Department’s Balanced Scorecards within their various spreadsheets, other parts of the health plan organization were being introduced to ActiveStrategy’s web-based Balanced Scorecard software, ActiveStrategy Enterprise (ASE). One of the reasons the health plan chose ActiveStrategy was because of its ability to be deployed across a very large enterprise and to integrate with other performance management initiatives as they arose, such as this work within the Claims Department. Once the department leadership saw ASE, they began transitioning their newly developed Balanced Scorecard content into the web-based system. ASE allowed the Claims Department to build multiple layers of linked, aligned, “clickable” Balanced Scorecards, which was not previously possible. This let the depart- ment leaders and objective owners delve deeper into the leading indicators of weak performance, which exposed the fact that, while current leaders possessed strong industry knowledge, unclear goals, policies and procedures, as well as a general lack of accountability, was contributing to a poor overall team culture. Thus a new depart- mental goal emerged to develop a perfor- mance-based, quality-focused workforce. Prior to building their scorecards in ASE, this important underlying cause was completely obscured. With their new significant focus on using the “People” perspective as a lever to drive behavioral change, the Claims Department concentrated on encouraging alignment and teamwork, and on developing the knowledge and skills of the group. The belief was that if the department’s employees were more satisfied with their roles and understood how their individual efforts aligned to the department’s goals, this would lead to beneficial impacts on other parts of their strategy, such as improving claims accuracy and timeliness, enhancing service quality, lowering cost per claim, and eventually improving both provider satisfaction and the department’s readiness for audits whenever they should arise. Fundamentally, it was putting faith in (and effort behind) the causalities they had laid out in their strategy map. 2 The Solution: Balanced Scorecard SoftwareThe Solution: Balanced Scorecard Software CASE STUDY STRATEGY BUSINESS REVIEW SCORECARDS INITIATIVES PROCESSES PGM REPORTS ALERTS ASU Welcome Martha Carr My Favorites Refresh Home Chooser Guide Help Logout MEASURE DETAIL - Days Receipts on Hand Link Edit Heirarchy Add Child Add Action Item Goal Base Details Actual Goal Variance Owners Days Receipts on Hand (DROH) - Weekly 7.3 7.0 (4.3) Steele, Kim Days Production on Hand (DPOH) 7.3 7.0 (4.3) Steele, Kim Claims Inventory 52,238 45,000 (7,238) Steele, Kim Initiatives Budget Timing Owners Pricing Reconciliation Keefe, Jim NT Server Remediation Lattanzi, Patti Automation Update Keefe, Jim CHARTS AND GRAPHS PERFORMANCE DATA Days Receipts on Hand (DROH) 10 9.5 9 8.5 8 7.5 7 6.5 6 Jan 2006 W1 Mar 2006 W3 Jun 2006 W1 Aug 2006 W4 Nov 2006 W3 Goal Actual Trend good direction updated 9/18/2006 OptionsDays Receipts on Hand (DROH) Period Actual Goal Variance YTD Jun 2006 W1 Jun 2006 W2 Jun 2006 W3 Jun 2006 W4 July 2006 W1 July 2006 W2 July 2006 W3 July 2006 W4 July 2006 W5 Aug 2006 W1 Aug 2006 W2 Aug 2006 W3 Aug 2006 W4 Sep 2006 W1 7.4 6.8 7.2 7.3 7.9 8.4 7.7 7.4 7.8 8.2 8.0 7.4 8.1 8.2 7.0 7.0 7.0 7.0 7.0 7.0 7.0 7.0 7.0 7.0 7.0 7.0 7.0 7.0 (0.4) 0.2 (0.2) (0.3) (0.9) (1.4) (0.7) (0.4) (0.8) (1.2) (1.0) (0.4) (1.1) (1.2) 7.9 7.9 7.9 7.8 7.8 7.9 7.9 7.8 7.8 7.9 7.9 7.8 7.9 7.9 Measure Detail pages allowed department leaders to drill into performance measures and review and act upon underlying details, such as child measures, performance trends, and linked initiatives and projects.
- 3. TM www.activestrategy.com 484.690.0700 One of the first key improvement initiatives undertaken was an employee satisfaction survey that gave the Office of Strategy Management a measurement of employee job fulfillment in the areas of culture, leadership, alignment, and teamwork. Employees were then scored on competency in various areas like communication, service attitude, subject matter expertise, and project management. As these metrics were tracked in ASE, a spirit of accountability emerged, and each employee felt personally responsible for the success or failure of the department. Areas that were below target were addressed through the launch of specific activities, such as regular employee meetings, topic-specific focus groups, and a new 15-minute daily dialogue to discuss relevant business matters. In keeping with the new objective to improve the department’s operational performance, process and perfor- mance improvement concepts were gradually introduced, including Lean Six Sigma training that provided teams with the skills to identify and improve root causes of strategic performance gaps, which were tracked and reviewed in ASE. New metrics were also put in place to monitor progress in developing the team’s knowledge, skills, and abilities. With its Balanced Scorecard framework fully integrated into ASE, business review meetings began to follow a new format. The division vice president began leading monthly meetings in “real time” in ASE, rather than using spreadsheets that were already out of date by the time they were compiled. For the division leader, the meetings have become a way to efficiently and effectively understand the performance of the department and its progress toward achieving goals. For the department, business reviews allow further exploration of areas that need improvement. The Claims Department achieved tremendous results within its first year of deploying Balanced Scorecards within ASE. The automated framework clarified departmental objectives and helped management deploy them with clearly assigned owners, which helped the department achieve its objective to “Get Compliant.” In fact, in August 2007, the department successfully passed a critical milestone audit administered by CMS – a significant testament to the power of the framework as used by the Claims Department. Other notable results achieved within the first year of deployment included: • An 85% increase in employee satisfaction • A 93% increase in the timeliness of claims processing • An estimated $30 million company benefit based on cost recovery and avoidance The Claims Department quickly became an example for how to implement a successful Balanced Scorecard, both inside and outside the health plan provider. In 2007, the department was the recipient of an analyst firm’s Operational Performance Leadership Award, which recognized ActiveStrategy’s partnership with the department as a winning example of how the adoption of best practices and the alignment of people and processes with technology applications enable performance management. Within the health plan provider, the department is held up as a role model and benchmark for workforce engagement and the performance management process, with several areas following the department’s lead. In 2009, the department is on track to save more than $90 million, bringing total savings as a result of the Balanced Scorecard and its deployment in ASE to well over $150 million thus far. In addition, claims accuracy and timeliness measures are both exceeding targets for 2009 -- targets that were made more aggressive twice. And measures within the Employee Perspective are also ahead of target. By focusing on the leading drivers in ASE, including an emphasis on people and the prioritization of the right projects, the department succeeded in driving its most critical regulatory compliance metrics, and continues to achieve tremendous other tangible business benefits simultaneously. 3 The ResultsThe Results CASE STUDY
- 4. TM www.activestrategy.com 484.690.0700 Today, the Claims Department is considered an example for how to implement a successful Balanced Scorecard, both inside and outside the health plan provider. In 2007, the Claims Department was the recipient of an analyst firm’s Operational Performance Leadership Award. The award recognizes that ActiveStrategy’s partnership with the department is a winning example of how the adoption of best practices and the alignment of people and processes with technology applications enable performance management. Within the health plan provider, the department is held up as a role model and benchmark for work- force engagement and the performance management process, with several areas following the depart- ment’s lead. By focusing on the leading drivers, including an emphasis on people and the prioritization of the right projects, the department drove the most critical regulatory compliance metrics. 4© 2010 ActiveStrategy, Inc. CASE STUDY