Cl and SO3 Graph - MIL.pptx
•Download as PPTX, PDF•
0 likes•77 views
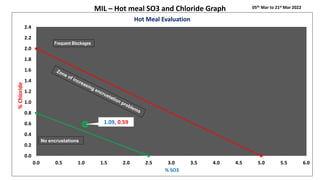
The document contains graphs showing levels of sulfate (SO3) and chloride in hot meals over time. Each graph analyzes data from a different month between March 2022 and March 2023. All graphs show SO3 and chloride levels have remained below 3% and 1% respectively with no observed encrustations, despite frequent blockages occurring in the hot meals.
Report
Share
Report
Share

Recommended
Operation - OR for JAN 23.pptx
This document provides a summary of operation review for the month of January. Key highlights include the plant achieving 100% availability and cleaning of the raw water pond. Lowlights included a unit blackout due to an HPBP malfunction and unreliable operation of HPBP. The document also provides data on plant performance indicators like generation, heat rate, coal consumption, and efficiency for the month. Charts show trends in SCC, boiler efficiency, and unburnt carbon, with opportunities identified for further improvement.
Pavithran Krishnan-Slaid Pembentangan-Hashim Bin Baharin.pptx
The document discusses the determination of heavy metal (manganese and nickel) concentrations in lakes at Universiti Teknologi Malaysia using Flame Atomic Absorption Spectrometry. Water samples were collected from three points in the lakes over nine weeks and analyzed to determine metal concentrations. The pH of the samples was also measured. Manganese concentrations exceeded the Malaysian standard of 0.1 mg/L at some sampling points and dates, while nickel was not detected above the standard of 0.02 mg/L. Meteorological conditions like rainfall were found to influence heavy metal levels in the lakes. The study aims to evaluate heavy metal toxicity according to national water quality standards.
18 oct12 การจัดทำแผนเอดส์56เขต
The document outlines the budget for HIV/AIDS and TB activities in South Africa for the 2022/2023 fiscal year, including funds for testing, treatment, and case management. It details the budgets for various line items such as laboratory services, drugs and supplies, human resources, and district allocations. The budgets are broken down by funding source and program area with specific grant reference numbers provided.
Turkey pumphrey 2
The document discusses utilizing genetic resources in wheat breeding programs to improve stripe rust resistance. It describes phenotyping several wheat panels for stripe rust reactions and genotyping them using SNPs. Major SNP markers associated with stripe rust resistance were identified on chromosomes 11A, 21B, 42A, and 52B. The results provide resources for gene discovery and developing varieties with complex resistance through combining seedling and adult plant resistance genes.
Introduction to the Land Use Workshop | Vicky West
This workshop brings together interested parties to consider carbon accounting tools for land use. The agenda includes discussions of tools for woodlands, agriculture, peatlands, and integrating models. The Woodland Carbon Code is a voluntary standard for woodland creation projects where carbon is accounted for. It includes standards for predicting and measuring carbon sequestration and tracking carbon credits. Over 100 projects have been registered under the Code across the UK.
Planta de Bolivia funcionando y Venezuela qué?
The document is a report of power dispatch in megawatts (MW) by various power systems in Bolivia over 24 hours on July 29, 2010. It shows the hourly dispatch totals for 13 hydroelectric power systems and 15 thermal power plants. The hydroelectric systems contributed the majority of power with a total dispatch of 5,223 MW over the 24 hour period. The Corani and Zongo hydroelectric systems provided the most power at around 2,500-1,800 MW respectively.
Continuous assessing of the Reviewed Event Bulletin with waveform cross corr...
International Data Centre of the CTBTO has a product of interactive analysis - Reviewed Event Bulletin. Cross correlation is used to improve completeness and consistency of the REB.
Raw_mix_design6-7_aug_2013_PowerPoint_Presentation.pptx
This document discusses optimizing raw mix design to improve clinker and cement quality. It provides requirements for cement quality including early and later strength development, setting time, fineness, and minimal expansions. Clinker properties depend on chemical, mineralogical, and granulometric properties and should achieve the cement quality requirements. The document outlines various cement types and their relevant standards. It discusses factors that affect cement quality and behavior like mineralogical composition, fineness, free calcium oxide content, and magnesium oxide content. Various aspects of raw mix design, clinker formation, and quality parameters are also summarized.
The simplified electron and muon model, Oscillating Spacetime: The Foundation...
Discover the Simplified Electron and Muon Model: A New Wave-Based Approach to Understanding Particles delves into a groundbreaking theory that presents electrons and muons as rotating soliton waves within oscillating spacetime. Geared towards students, researchers, and science buffs, this book breaks down complex ideas into simple explanations. It covers topics such as electron waves, temporal dynamics, and the implications of this model on particle physics. With clear illustrations and easy-to-follow explanations, readers will gain a new outlook on the universe's fundamental nature.
Walmart Business+ and Spark Good for Nonprofits.pdf
"Learn about all the ways Walmart supports nonprofit organizations.
You will hear from Liz Willett, the Head of Nonprofits, and hear about what Walmart is doing to help nonprofits, including Walmart Business and Spark Good. Walmart Business+ is a new offer for nonprofits that offers discounts and also streamlines nonprofits order and expense tracking, saving time and money.
The webinar may also give some examples on how nonprofits can best leverage Walmart Business+.
The event will cover the following::
Walmart Business + (https://business.walmart.com/plus) is a new shopping experience for nonprofits, schools, and local business customers that connects an exclusive online shopping experience to stores. Benefits include free delivery and shipping, a 'Spend Analytics” feature, special discounts, deals and tax-exempt shopping.
Special TechSoup offer for a free 180 days membership, and up to $150 in discounts on eligible orders.
Spark Good (walmart.com/sparkgood) is a charitable platform that enables nonprofits to receive donations directly from customers and associates.
Answers about how you can do more with Walmart!"
clinical examination of hip joint (1).pdf
described clinical examination all orthopeadic conditions .
Pollock and Snow "DEIA in the Scholarly Landscape, Session One: Setting Expec...
Pollock and Snow "DEIA in the Scholarly Landscape, Session One: Setting Expec...National Information Standards Organization (NISO)
This presentation was provided by Steph Pollock of The American Psychological Association’s Journals Program, and Damita Snow, of The American Society of Civil Engineers (ASCE), for the initial session of NISO's 2024 Training Series "DEIA in the Scholarly Landscape." Session One: 'Setting Expectations: a DEIA Primer,' was held June 6, 2024.Advanced Java[Extra Concepts, Not Difficult].docx
This is part 2 of my Java Learning Journey. This contains Hashing, ArrayList, LinkedList, Date and Time Classes, Calendar Class and more.
Pengantar Penggunaan Flutter - Dart programming language1.pptx
Pengantar Penggunaan Flutter - Dart programming language1.pptx
Chapter 4 - Islamic Financial Institutions in Malaysia.pptx
Chapter 4 - Islamic Financial Institutions in Malaysia.pptxMohd Adib Abd Muin, Senior Lecturer at Universiti Utara Malaysia
This slide is special for master students (MIBS & MIFB) in UUM. Also useful for readers who are interested in the topic of contemporary Islamic banking.
Hindi varnamala | hindi alphabet PPT.pdf
हिंदी वर्णमाला पीपीटी, hindi alphabet PPT presentation, hindi varnamala PPT, Hindi Varnamala pdf, हिंदी स्वर, हिंदी व्यंजन, sikhiye hindi varnmala, dr. mulla adam ali, hindi language and literature, hindi alphabet with drawing, hindi alphabet pdf, hindi varnamala for childrens, hindi language, hindi varnamala practice for kids, https://www.drmullaadamali.com
Digital Artifact 1 - 10VCD Environments Unit
Digital Artifact 1 - 10VCD Environments Unit - NGV Pavilion Concept Design
ISO/IEC 27001, ISO/IEC 42001, and GDPR: Best Practices for Implementation and...
Denis is a dynamic and results-driven Chief Information Officer (CIO) with a distinguished career spanning information systems analysis and technical project management. With a proven track record of spearheading the design and delivery of cutting-edge Information Management solutions, he has consistently elevated business operations, streamlined reporting functions, and maximized process efficiency.
Certified as an ISO/IEC 27001: Information Security Management Systems (ISMS) Lead Implementer, Data Protection Officer, and Cyber Risks Analyst, Denis brings a heightened focus on data security, privacy, and cyber resilience to every endeavor.
His expertise extends across a diverse spectrum of reporting, database, and web development applications, underpinned by an exceptional grasp of data storage and virtualization technologies. His proficiency in application testing, database administration, and data cleansing ensures seamless execution of complex projects.
What sets Denis apart is his comprehensive understanding of Business and Systems Analysis technologies, honed through involvement in all phases of the Software Development Lifecycle (SDLC). From meticulous requirements gathering to precise analysis, innovative design, rigorous development, thorough testing, and successful implementation, he has consistently delivered exceptional results.
Throughout his career, he has taken on multifaceted roles, from leading technical project management teams to owning solutions that drive operational excellence. His conscientious and proactive approach is unwavering, whether he is working independently or collaboratively within a team. His ability to connect with colleagues on a personal level underscores his commitment to fostering a harmonious and productive workplace environment.
Date: May 29, 2024
Tags: Information Security, ISO/IEC 27001, ISO/IEC 42001, Artificial Intelligence, GDPR
-------------------------------------------------------------------------------
Find out more about ISO training and certification services
Training: ISO/IEC 27001 Information Security Management System - EN | PECB
ISO/IEC 42001 Artificial Intelligence Management System - EN | PECB
General Data Protection Regulation (GDPR) - Training Courses - EN | PECB
Webinars: https://pecb.com/webinars
Article: https://pecb.com/article
-------------------------------------------------------------------------------
For more information about PECB:
Website: https://pecb.com/
LinkedIn: https://www.linkedin.com/company/pecb/
Facebook: https://www.facebook.com/PECBInternational/
Slideshare: http://www.slideshare.net/PECBCERTIFICATION
LAND USE LAND COVER AND NDVI OF MIRZAPUR DISTRICT, UP
This Dissertation explores the particular circumstances of Mirzapur, a region located in the
core of India. Mirzapur, with its varied terrains and abundant biodiversity, offers an optimal
environment for investigating the changes in vegetation cover dynamics. Our study utilizes
advanced technologies such as GIS (Geographic Information Systems) and Remote sensing to
analyze the transformations that have taken place over the course of a decade.
The complex relationship between human activities and the environment has been the focus
of extensive research and worry. As the global community grapples with swift urbanization,
population expansion, and economic progress, the effects on natural ecosystems are becoming
more evident. A crucial element of this impact is the alteration of vegetation cover, which plays a
significant role in maintaining the ecological equilibrium of our planet.Land serves as the foundation for all human activities and provides the necessary materials for
these activities. As the most crucial natural resource, its utilization by humans results in different
'Land uses,' which are determined by both human activities and the physical characteristics of the
land.
The utilization of land is impacted by human needs and environmental factors. In countries
like India, rapid population growth and the emphasis on extensive resource exploitation can lead
to significant land degradation, adversely affecting the region's land cover.
Therefore, human intervention has significantly influenced land use patterns over many
centuries, evolving its structure over time and space. In the present era, these changes have
accelerated due to factors such as agriculture and urbanization. Information regarding land use and
cover is essential for various planning and management tasks related to the Earth's surface,
providing crucial environmental data for scientific, resource management, policy purposes, and
diverse human activities.
Accurate understanding of land use and cover is imperative for the development planning
of any area. Consequently, a wide range of professionals, including earth system scientists, land
and water managers, and urban planners, are interested in obtaining data on land use and cover
changes, conversion trends, and other related patterns. The spatial dimensions of land use and
cover support policymakers and scientists in making well-informed decisions, as alterations in
these patterns indicate shifts in economic and social conditions. Monitoring such changes with the
help of Advanced technologies like Remote Sensing and Geographic Information Systems is
crucial for coordinated efforts across different administrative levels. Advanced technologies like
Remote Sensing and Geographic Information Systems
9
Changes in vegetation cover refer to variations in the distribution, composition, and overall
structure of plant communities across different temporal and spatial scales. These changes can
occur natural.
Main Java[All of the Base Concepts}.docx
This is part 1 of my Java Learning Journey. This Contains Custom methods, classes, constructors, packages, multithreading , try- catch block, finally block and more.
How to Manage Your Lost Opportunities in Odoo 17 CRM
Odoo 17 CRM allows us to track why we lose sales opportunities with "Lost Reasons." This helps analyze our sales process and identify areas for improvement. Here's how to configure lost reasons in Odoo 17 CRM
2024 State of Marketing Report – by Hubspot
https://www.hubspot.com/state-of-marketing
· Scaling relationships and proving ROI
· Social media is the place for search, sales, and service
· Authentic influencer partnerships fuel brand growth
· The strongest connections happen via call, click, chat, and camera.
· Time saved with AI leads to more creative work
· Seeking: A single source of truth
· TLDR; Get on social, try AI, and align your systems.
· More human marketing, powered by robots
Everything You Need To Know About ChatGPT
ChatGPT is a revolutionary addition to the world since its introduction in 2022. A big shift in the sector of information gathering and processing happened because of this chatbot. What is the story of ChatGPT? How is the bot responding to prompts and generating contents? Swipe through these slides prepared by Expeed Software, a web development company regarding the development and technical intricacies of ChatGPT!
More Related Content
Recently uploaded
The simplified electron and muon model, Oscillating Spacetime: The Foundation...
Discover the Simplified Electron and Muon Model: A New Wave-Based Approach to Understanding Particles delves into a groundbreaking theory that presents electrons and muons as rotating soliton waves within oscillating spacetime. Geared towards students, researchers, and science buffs, this book breaks down complex ideas into simple explanations. It covers topics such as electron waves, temporal dynamics, and the implications of this model on particle physics. With clear illustrations and easy-to-follow explanations, readers will gain a new outlook on the universe's fundamental nature.
Walmart Business+ and Spark Good for Nonprofits.pdf
"Learn about all the ways Walmart supports nonprofit organizations.
You will hear from Liz Willett, the Head of Nonprofits, and hear about what Walmart is doing to help nonprofits, including Walmart Business and Spark Good. Walmart Business+ is a new offer for nonprofits that offers discounts and also streamlines nonprofits order and expense tracking, saving time and money.
The webinar may also give some examples on how nonprofits can best leverage Walmart Business+.
The event will cover the following::
Walmart Business + (https://business.walmart.com/plus) is a new shopping experience for nonprofits, schools, and local business customers that connects an exclusive online shopping experience to stores. Benefits include free delivery and shipping, a 'Spend Analytics” feature, special discounts, deals and tax-exempt shopping.
Special TechSoup offer for a free 180 days membership, and up to $150 in discounts on eligible orders.
Spark Good (walmart.com/sparkgood) is a charitable platform that enables nonprofits to receive donations directly from customers and associates.
Answers about how you can do more with Walmart!"
clinical examination of hip joint (1).pdf
described clinical examination all orthopeadic conditions .
Pollock and Snow "DEIA in the Scholarly Landscape, Session One: Setting Expec...
Pollock and Snow "DEIA in the Scholarly Landscape, Session One: Setting Expec...National Information Standards Organization (NISO)
This presentation was provided by Steph Pollock of The American Psychological Association’s Journals Program, and Damita Snow, of The American Society of Civil Engineers (ASCE), for the initial session of NISO's 2024 Training Series "DEIA in the Scholarly Landscape." Session One: 'Setting Expectations: a DEIA Primer,' was held June 6, 2024.Advanced Java[Extra Concepts, Not Difficult].docx
This is part 2 of my Java Learning Journey. This contains Hashing, ArrayList, LinkedList, Date and Time Classes, Calendar Class and more.
Pengantar Penggunaan Flutter - Dart programming language1.pptx
Pengantar Penggunaan Flutter - Dart programming language1.pptx
Chapter 4 - Islamic Financial Institutions in Malaysia.pptx
Chapter 4 - Islamic Financial Institutions in Malaysia.pptxMohd Adib Abd Muin, Senior Lecturer at Universiti Utara Malaysia
This slide is special for master students (MIBS & MIFB) in UUM. Also useful for readers who are interested in the topic of contemporary Islamic banking.
Hindi varnamala | hindi alphabet PPT.pdf
हिंदी वर्णमाला पीपीटी, hindi alphabet PPT presentation, hindi varnamala PPT, Hindi Varnamala pdf, हिंदी स्वर, हिंदी व्यंजन, sikhiye hindi varnmala, dr. mulla adam ali, hindi language and literature, hindi alphabet with drawing, hindi alphabet pdf, hindi varnamala for childrens, hindi language, hindi varnamala practice for kids, https://www.drmullaadamali.com
Digital Artifact 1 - 10VCD Environments Unit
Digital Artifact 1 - 10VCD Environments Unit - NGV Pavilion Concept Design
ISO/IEC 27001, ISO/IEC 42001, and GDPR: Best Practices for Implementation and...
Denis is a dynamic and results-driven Chief Information Officer (CIO) with a distinguished career spanning information systems analysis and technical project management. With a proven track record of spearheading the design and delivery of cutting-edge Information Management solutions, he has consistently elevated business operations, streamlined reporting functions, and maximized process efficiency.
Certified as an ISO/IEC 27001: Information Security Management Systems (ISMS) Lead Implementer, Data Protection Officer, and Cyber Risks Analyst, Denis brings a heightened focus on data security, privacy, and cyber resilience to every endeavor.
His expertise extends across a diverse spectrum of reporting, database, and web development applications, underpinned by an exceptional grasp of data storage and virtualization technologies. His proficiency in application testing, database administration, and data cleansing ensures seamless execution of complex projects.
What sets Denis apart is his comprehensive understanding of Business and Systems Analysis technologies, honed through involvement in all phases of the Software Development Lifecycle (SDLC). From meticulous requirements gathering to precise analysis, innovative design, rigorous development, thorough testing, and successful implementation, he has consistently delivered exceptional results.
Throughout his career, he has taken on multifaceted roles, from leading technical project management teams to owning solutions that drive operational excellence. His conscientious and proactive approach is unwavering, whether he is working independently or collaboratively within a team. His ability to connect with colleagues on a personal level underscores his commitment to fostering a harmonious and productive workplace environment.
Date: May 29, 2024
Tags: Information Security, ISO/IEC 27001, ISO/IEC 42001, Artificial Intelligence, GDPR
-------------------------------------------------------------------------------
Find out more about ISO training and certification services
Training: ISO/IEC 27001 Information Security Management System - EN | PECB
ISO/IEC 42001 Artificial Intelligence Management System - EN | PECB
General Data Protection Regulation (GDPR) - Training Courses - EN | PECB
Webinars: https://pecb.com/webinars
Article: https://pecb.com/article
-------------------------------------------------------------------------------
For more information about PECB:
Website: https://pecb.com/
LinkedIn: https://www.linkedin.com/company/pecb/
Facebook: https://www.facebook.com/PECBInternational/
Slideshare: http://www.slideshare.net/PECBCERTIFICATION
LAND USE LAND COVER AND NDVI OF MIRZAPUR DISTRICT, UP
This Dissertation explores the particular circumstances of Mirzapur, a region located in the
core of India. Mirzapur, with its varied terrains and abundant biodiversity, offers an optimal
environment for investigating the changes in vegetation cover dynamics. Our study utilizes
advanced technologies such as GIS (Geographic Information Systems) and Remote sensing to
analyze the transformations that have taken place over the course of a decade.
The complex relationship between human activities and the environment has been the focus
of extensive research and worry. As the global community grapples with swift urbanization,
population expansion, and economic progress, the effects on natural ecosystems are becoming
more evident. A crucial element of this impact is the alteration of vegetation cover, which plays a
significant role in maintaining the ecological equilibrium of our planet.Land serves as the foundation for all human activities and provides the necessary materials for
these activities. As the most crucial natural resource, its utilization by humans results in different
'Land uses,' which are determined by both human activities and the physical characteristics of the
land.
The utilization of land is impacted by human needs and environmental factors. In countries
like India, rapid population growth and the emphasis on extensive resource exploitation can lead
to significant land degradation, adversely affecting the region's land cover.
Therefore, human intervention has significantly influenced land use patterns over many
centuries, evolving its structure over time and space. In the present era, these changes have
accelerated due to factors such as agriculture and urbanization. Information regarding land use and
cover is essential for various planning and management tasks related to the Earth's surface,
providing crucial environmental data for scientific, resource management, policy purposes, and
diverse human activities.
Accurate understanding of land use and cover is imperative for the development planning
of any area. Consequently, a wide range of professionals, including earth system scientists, land
and water managers, and urban planners, are interested in obtaining data on land use and cover
changes, conversion trends, and other related patterns. The spatial dimensions of land use and
cover support policymakers and scientists in making well-informed decisions, as alterations in
these patterns indicate shifts in economic and social conditions. Monitoring such changes with the
help of Advanced technologies like Remote Sensing and Geographic Information Systems is
crucial for coordinated efforts across different administrative levels. Advanced technologies like
Remote Sensing and Geographic Information Systems
9
Changes in vegetation cover refer to variations in the distribution, composition, and overall
structure of plant communities across different temporal and spatial scales. These changes can
occur natural.
Main Java[All of the Base Concepts}.docx
This is part 1 of my Java Learning Journey. This Contains Custom methods, classes, constructors, packages, multithreading , try- catch block, finally block and more.
How to Manage Your Lost Opportunities in Odoo 17 CRM
Odoo 17 CRM allows us to track why we lose sales opportunities with "Lost Reasons." This helps analyze our sales process and identify areas for improvement. Here's how to configure lost reasons in Odoo 17 CRM
Recently uploaded (20)
The simplified electron and muon model, Oscillating Spacetime: The Foundation...
The simplified electron and muon model, Oscillating Spacetime: The Foundation...
Walmart Business+ and Spark Good for Nonprofits.pdf
Walmart Business+ and Spark Good for Nonprofits.pdf
Pollock and Snow "DEIA in the Scholarly Landscape, Session One: Setting Expec...
Pollock and Snow "DEIA in the Scholarly Landscape, Session One: Setting Expec...
Pengantar Penggunaan Flutter - Dart programming language1.pptx
Pengantar Penggunaan Flutter - Dart programming language1.pptx
Liberal Approach to the Study of Indian Politics.pdf
Liberal Approach to the Study of Indian Politics.pdf
Film vocab for eal 3 students: Australia the movie
Film vocab for eal 3 students: Australia the movie
Chapter 4 - Islamic Financial Institutions in Malaysia.pptx
Chapter 4 - Islamic Financial Institutions in Malaysia.pptx
ISO/IEC 27001, ISO/IEC 42001, and GDPR: Best Practices for Implementation and...
ISO/IEC 27001, ISO/IEC 42001, and GDPR: Best Practices for Implementation and...
Pride Month Slides 2024 David Douglas School District
Pride Month Slides 2024 David Douglas School District
LAND USE LAND COVER AND NDVI OF MIRZAPUR DISTRICT, UP
LAND USE LAND COVER AND NDVI OF MIRZAPUR DISTRICT, UP
How to Manage Your Lost Opportunities in Odoo 17 CRM
How to Manage Your Lost Opportunities in Odoo 17 CRM
Featured
2024 State of Marketing Report – by Hubspot
https://www.hubspot.com/state-of-marketing
· Scaling relationships and proving ROI
· Social media is the place for search, sales, and service
· Authentic influencer partnerships fuel brand growth
· The strongest connections happen via call, click, chat, and camera.
· Time saved with AI leads to more creative work
· Seeking: A single source of truth
· TLDR; Get on social, try AI, and align your systems.
· More human marketing, powered by robots
Everything You Need To Know About ChatGPT
ChatGPT is a revolutionary addition to the world since its introduction in 2022. A big shift in the sector of information gathering and processing happened because of this chatbot. What is the story of ChatGPT? How is the bot responding to prompts and generating contents? Swipe through these slides prepared by Expeed Software, a web development company regarding the development and technical intricacies of ChatGPT!
Product Design Trends in 2024 | Teenage Engineerings
The realm of product design is a constantly changing environment where technology and style intersect. Every year introduces fresh challenges and exciting trends that mold the future of this captivating art form. In this piece, we delve into the significant trends set to influence the look and functionality of product design in the year 2024.
How Race, Age and Gender Shape Attitudes Towards Mental Health
Mental health has been in the news quite a bit lately. Dozens of U.S. states are currently suing Meta for contributing to the youth mental health crisis by inserting addictive features into their products, while the U.S. Surgeon General is touring the nation to bring awareness to the growing epidemic of loneliness and isolation. The country has endured periods of low national morale, such as in the 1970s when high inflation and the energy crisis worsened public sentiment following the Vietnam War. The current mood, however, feels different. Gallup recently reported that national mental health is at an all-time low, with few bright spots to lift spirits.
To better understand how Americans are feeling and their attitudes towards mental health in general, ThinkNow conducted a nationally representative quantitative survey of 1,500 respondents and found some interesting differences among ethnic, age and gender groups.
Technology
For example, 52% agree that technology and social media have a negative impact on mental health, but when broken out by race, 61% of Whites felt technology had a negative effect, and only 48% of Hispanics thought it did.
While technology has helped us keep in touch with friends and family in faraway places, it appears to have degraded our ability to connect in person. Staying connected online is a double-edged sword since the same news feed that brings us pictures of the grandkids and fluffy kittens also feeds us news about the wars in Israel and Ukraine, the dysfunction in Washington, the latest mass shooting and the climate crisis.
Hispanics may have a built-in defense against the isolation technology breeds, owing to their large, multigenerational households, strong social support systems, and tendency to use social media to stay connected with relatives abroad.
Age and Gender
When asked how individuals rate their mental health, men rate it higher than women by 11 percentage points, and Baby Boomers rank it highest at 83%, saying it’s good or excellent vs. 57% of Gen Z saying the same.
Gen Z spends the most amount of time on social media, so the notion that social media negatively affects mental health appears to be correlated. Unfortunately, Gen Z is also the generation that’s least comfortable discussing mental health concerns with healthcare professionals. Only 40% of them state they’re comfortable discussing their issues with a professional compared to 60% of Millennials and 65% of Boomers.
Race Affects Attitudes
As seen in previous research conducted by ThinkNow, Asian Americans lag other groups when it comes to awareness of mental health issues. Twenty-four percent of Asian Americans believe that having a mental health issue is a sign of weakness compared to the 16% average for all groups. Asians are also considerably less likely to be aware of mental health services in their communities (42% vs. 55%) and most likely to seek out information on social media (51% vs. 35%).
AI Trends in Creative Operations 2024 by Artwork Flow.pdf
Creative operations teams expect increased AI use in 2024. Currently, over half of tasks are not AI-enabled, but this is expected to decrease in the coming year. ChatGPT is the most popular AI tool currently. Business leaders are more actively exploring AI benefits than individual contributors. Most respondents do not believe AI will impact workforce size in 2024. However, some inhibitions still exist around AI accuracy and lack of understanding. Creatives primarily want to use AI to save time on mundane tasks and boost productivity.
Skeleton Culture Code
Organizational culture includes values, norms, systems, symbols, language, assumptions, beliefs, and habits that influence employee behaviors and how people interpret those behaviors. It is important because culture can help or hinder a company's success. Some key aspects of Netflix's culture that help it achieve results include hiring smartly so every position has stars, focusing on attitude over just aptitude, and having a strict policy against peacocks, whiners, and jerks.
PEPSICO Presentation to CAGNY Conference Feb 2024
PepsiCo provided a safe harbor statement noting that any forward-looking statements are based on currently available information and are subject to risks and uncertainties. It also provided information on non-GAAP measures and directing readers to its website for disclosure and reconciliation. The document then discussed PepsiCo's business overview, including that it is a global beverage and convenient food company with iconic brands, $91 billion in net revenue in 2023, and nearly $14 billion in core operating profit. It operates through a divisional structure with a focus on local consumers.
Content Methodology: A Best Practices Report (Webinar)
This document provides an overview of content methodology best practices. It defines content methodology as establishing objectives, KPIs, and a culture of continuous learning and iteration. An effective methodology focuses on connecting with audiences, creating optimal content, and optimizing processes. It also discusses why a methodology is needed due to the competitive landscape, proliferation of channels, and opportunities for improvement. Components of an effective methodology include defining objectives and KPIs, audience analysis, identifying opportunities, and evaluating resources. The document concludes with recommendations around creating a content plan, testing and optimizing content over 90 days.
How to Prepare For a Successful Job Search for 2024
The document provides guidance on preparing a job search for 2024. It discusses the state of the job market, focusing on growth in AI and healthcare but also continued layoffs. It recommends figuring out what you want to do by researching interests and skills, then conducting informational interviews. The job search should involve building a personal brand on LinkedIn, actively applying to jobs, tailoring resumes and interviews, maintaining job hunting as a habit, and continuing self-improvement. Once hired, the document advises setting new goals and keeping skills and networking active in case of future opportunities.
Social Media Marketing Trends 2024 // The Global Indie Insights
A report by thenetworkone and Kurio.
The contributing experts and agencies are (in an alphabetical order): Sylwia Rytel, Social Media Supervisor, 180heartbeats + JUNG v MATT (PL), Sharlene Jenner, Vice President - Director of Engagement Strategy, Abelson Taylor (USA), Alex Casanovas, Digital Director, Atrevia (ES), Dora Beilin, Senior Social Strategist, Barrett Hoffher (USA), Min Seo, Campaign Director, Brand New Agency (KR), Deshé M. Gully, Associate Strategist, Day One Agency (USA), Francesca Trevisan, Strategist, Different (IT), Trevor Crossman, CX and Digital Transformation Director; Olivia Hussey, Strategic Planner; Simi Srinarula, Social Media Manager, The Hallway (AUS), James Hebbert, Managing Director, Hylink (CN / UK), Mundy Álvarez, Planning Director; Pedro Rojas, Social Media Manager; Pancho González, CCO, Inbrax (CH), Oana Oprea, Head of Digital Planning, Jam Session Agency (RO), Amy Bottrill, Social Account Director, Launch (UK), Gaby Arriaga, Founder, Leonardo1452 (MX), Shantesh S Row, Creative Director, Liwa (UAE), Rajesh Mehta, Chief Strategy Officer; Dhruv Gaur, Digital Planning Lead; Leonie Mergulhao, Account Supervisor - Social Media & PR, Medulla (IN), Aurelija Plioplytė, Head of Digital & Social, Not Perfect (LI), Daiana Khaidargaliyeva, Account Manager, Osaka Labs (UK / USA), Stefanie Söhnchen, Vice President Digital, PIABO Communications (DE), Elisabeth Winiartati, Managing Consultant, Head of Global Integrated Communications; Lydia Aprina, Account Manager, Integrated Marketing and Communications; Nita Prabowo, Account Manager, Integrated Marketing and Communications; Okhi, Web Developer, PNTR Group (ID), Kei Obusan, Insights Director; Daffi Ranandi, Insights Manager, Radarr (SG), Gautam Reghunath, Co-founder & CEO, Talented (IN), Donagh Humphreys, Head of Social and Digital Innovation, THINKHOUSE (IRE), Sarah Yim, Strategy Director, Zulu Alpha Kilo (CA).
Trends In Paid Search: Navigating The Digital Landscape In 2024
The search marketing landscape is evolving rapidly with new technologies, and professionals, like you, rely on innovative paid search strategies to meet changing demands.
It’s important that you’re ready to implement new strategies in 2024.
Check this out and learn the top trends in paid search advertising that are expected to gain traction, so you can drive higher ROI more efficiently in 2024.
You’ll learn:
- The latest trends in AI and automation, and what this means for an evolving paid search ecosystem.
- New developments in privacy and data regulation.
- Emerging ad formats that are expected to make an impact next year.
Watch Sreekant Lanka from iQuanti and Irina Klein from OneMain Financial as they dive into the future of paid search and explore the trends, strategies, and technologies that will shape the search marketing landscape.
If you’re looking to assess your paid search strategy and design an industry-aligned plan for 2024, then this webinar is for you.
5 Public speaking tips from TED - Visualized summary
From their humble beginnings in 1984, TED has grown into the world’s most powerful amplifier for speakers and thought-leaders to share their ideas. They have over 2,400 filmed talks (not including the 30,000+ TEDx videos) freely available online, and have hosted over 17,500 events around the world.
With over one billion views in a year, it’s no wonder that so many speakers are looking to TED for ideas on how to share their message more effectively.
The article “5 Public-Speaking Tips TED Gives Its Speakers”, by Carmine Gallo for Forbes, gives speakers five practical ways to connect with their audience, and effectively share their ideas on stage.
Whether you are gearing up to get on a TED stage yourself, or just want to master the skills that so many of their speakers possess, these tips and quotes from Chris Anderson, the TED Talks Curator, will encourage you to make the most impactful impression on your audience.
See the full article and more summaries like this on SpeakerHub here: https://speakerhub.com/blog/5-presentation-tips-ted-gives-its-speakers
See the original article on Forbes here:
http://www.forbes.com/forbes/welcome/?toURL=http://www.forbes.com/sites/carminegallo/2016/05/06/5-public-speaking-tips-ted-gives-its-speakers/&refURL=&referrer=#5c07a8221d9b
ChatGPT and the Future of Work - Clark Boyd
Everyone is in agreement that ChatGPT (and other generative AI tools) will shape the future of work. Yet there is little consensus on exactly how, when, and to what extent this technology will change our world.
Businesses that extract maximum value from ChatGPT will use it as a collaborative tool for everything from brainstorming to technical maintenance.
For individuals, now is the time to pinpoint the skills the future professional will need to thrive in the AI age.
Check out this presentation to understand what ChatGPT is, how it will shape the future of work, and how you can prepare to take advantage.
Getting into the tech field. what next
The document provides career advice for getting into the tech field, including:
- Doing projects and internships in college to build a portfolio.
- Learning about different roles and technologies through industry research.
- Contributing to open source projects to build experience and network.
- Developing a personal brand through a website and social media presence.
- Networking through events, communities, and finding a mentor.
- Practicing interviews through mock interviews and whiteboarding coding questions.
Google's Just Not That Into You: Understanding Core Updates & Search Intent
1. Core updates from Google periodically change how its algorithms assess and rank websites and pages. This can impact rankings through shifts in user intent, site quality issues being caught up to, world events influencing queries, and overhauls to search like the E-A-T framework.
2. There are many possible user intents beyond just transactional, navigational and informational. Identifying intent shifts is important during core updates. Sites may need to optimize for new intents through different content types and sections.
3. Responding effectively to core updates requires analyzing "before and after" data to understand changes, identifying new intents or page types, and ensuring content matches appropriate intents across video, images, knowledge graphs and more.
How to have difficult conversations
Stop putting off having difficult conversations. Seven practical tips to ensure your next difficult conversation go smoothly.
Introduction to Data Science
A brief introduction to DataScience with explaining of the concepts, algorithms, machine learning, supervised and unsupervised learning, clustering, statistics, data preprocessing, real-world applications etc.
It's part of a Data Science Corner Campaign where I will be discussing the fundamentals of DataScience, AIML, Statistics etc.
Time Management & Productivity - Best Practices
Here's my presentation on by proven best practices how to manage your work time effectively and how to improve your productivity. It includes practical tips and how to use tools such as Slack, Google Apps, Hubspot, Google Calendar, Gmail and others.
The six step guide to practical project management
The six step guide to practical project management
If you think managing projects is too difficult, think again.
We’ve stripped back project management processes to the
basics – to make it quicker and easier, without sacrificing
the vital ingredients for success.
“If you’re looking for some real-world guidance, then The Six Step Guide to Practical Project Management will help.”
Dr Andrew Makar, Tactical Project Management
Beginners Guide to TikTok for Search - Rachel Pearson - We are Tilt __ Bright...
A presentation for absolute beginners who have never touched TikTok and may be a bit scared of it!
Featured (20)
Product Design Trends in 2024 | Teenage Engineerings
Product Design Trends in 2024 | Teenage Engineerings
How Race, Age and Gender Shape Attitudes Towards Mental Health
How Race, Age and Gender Shape Attitudes Towards Mental Health
AI Trends in Creative Operations 2024 by Artwork Flow.pdf
AI Trends in Creative Operations 2024 by Artwork Flow.pdf
Content Methodology: A Best Practices Report (Webinar)
Content Methodology: A Best Practices Report (Webinar)
How to Prepare For a Successful Job Search for 2024
How to Prepare For a Successful Job Search for 2024
Social Media Marketing Trends 2024 // The Global Indie Insights
Social Media Marketing Trends 2024 // The Global Indie Insights
Trends In Paid Search: Navigating The Digital Landscape In 2024
Trends In Paid Search: Navigating The Digital Landscape In 2024
5 Public speaking tips from TED - Visualized summary
5 Public speaking tips from TED - Visualized summary
Google's Just Not That Into You: Understanding Core Updates & Search Intent
Google's Just Not That Into You: Understanding Core Updates & Search Intent
The six step guide to practical project management
The six step guide to practical project management
Beginners Guide to TikTok for Search - Rachel Pearson - We are Tilt __ Bright...
Beginners Guide to TikTok for Search - Rachel Pearson - We are Tilt __ Bright...
Cl and SO3 Graph - MIL.pptx
- 1. 1.09, 0.59 0.0 0.2 0.4 0.6 0.8 1.0 1.2 1.4 1.6 1.8 2.0 2.2 2.4 0.0 0.5 1.0 1.5 2.0 2.5 3.0 3.5 4.0 4.5 5.0 5.5 6.0 % Chloride % SO3 Hot Meal Evaluation Frequent Blockages No encrustations MIL – Hot meal SO3 and Chloride Graph 05th Mar to 21st Mar 2022
- 2. 1.83, 0.75 0.0 0.2 0.4 0.6 0.8 1.0 1.2 1.4 1.6 1.8 2.0 2.2 2.4 0.0 0.5 1.0 1.5 2.0 2.5 3.0 3.5 4.0 4.5 5.0 5.5 6.0 % Chloride % SO3 Hot Meal Evaluation Frequent Blockages No encrustations MIL – Hot meal SO3 and Chloride Graph 01st Mar to 28th st Mar 2022
- 3. 1.47, 0.52 0.0 0.2 0.4 0.6 0.8 1.0 1.2 1.4 1.6 1.8 2.0 2.2 2.4 0.0 0.5 1.0 1.5 2.0 2.5 3.0 3.5 4.0 4.5 5.0 5.5 6.0 % Chloride % SO3 Hot Meal Evaluation Frequent Blockages No encrustations MIL – Hot meal SO3 and Chloride Graph 01st May to 25th May 2022
- 4. 2.07, 0.65 0.0 0.2 0.4 0.6 0.8 1.0 1.2 1.4 1.6 1.8 2.0 2.2 2.4 0.0 0.5 1.0 1.5 2.0 2.5 3.0 3.5 4.0 4.5 5.0 5.5 6.0 % Chloride % SO3 Hot Meal Evaluation Frequent Blockages No encrustations MIL – Hot meal SO3 and Chloride Graph 01st June to 25th June 2022
- 5. 2.13, 0.39 0.0 0.2 0.4 0.6 0.8 1.0 1.2 1.4 1.6 1.8 2.0 2.2 2.4 0.0 0.5 1.0 1.5 2.0 2.5 3.0 3.5 4.0 4.5 5.0 5.5 6.0 % Chloride % SO3 Hot Meal Evaluation Frequent Blockages No encrustations MIL – Hot meal SO3 and Chloride Graph July 2022
- 6. 2.91, 0.46 0.0 0.2 0.4 0.6 0.8 1.0 1.2 1.4 1.6 1.8 2.0 2.2 2.4 0.0 0.5 1.0 1.5 2.0 2.5 3.0 3.5 4.0 4.5 5.0 5.5 6.0 % Chloride % SO3 Hot Meal Evaluation Frequent Blockages No encrustations CCW – Hot meal SO3 and Chloride Graph Aug 2022
- 7. 1.60, 0.52 0.0 0.2 0.4 0.6 0.8 1.0 1.2 1.4 1.6 1.8 2.0 2.2 2.4 0.0 0.5 1.0 1.5 2.0 2.5 3.0 3.5 4.0 4.5 5.0 5.5 6.0 % Chloride % SO3 Hot Meal Evaluation Frequent Blockages No encrustations CCW – Hot meal SO3 and Chloride Graph Sept 2022
- 8. 1.71, 0.47 0.0 0.2 0.4 0.6 0.8 1.0 1.2 1.4 1.6 1.8 2.0 2.2 2.4 0.0 0.5 1.0 1.5 2.0 2.5 3.0 3.5 4.0 4.5 5.0 5.5 6.0 % Chloride % SO3 Hot Meal Evaluation Frequent Blockages No encrustations CCW – Hot meal SO3 and Chloride Graph Oct 2022
- 9. 2.19, 0.57 0.0 0.2 0.4 0.6 0.8 1.0 1.2 1.4 1.6 1.8 2.0 2.2 2.4 0.0 0.5 1.0 1.5 2.0 2.5 3.0 3.5 4.0 4.5 5.0 5.5 6.0 % Chloride % SO3 Hot Meal Evaluation Frequent Blockages No encrustations CCW – Hot meal SO3 and Chloride Graph Jan 2023
- 10. 2.57, 0.61 0.0 0.2 0.4 0.6 0.8 1.0 1.2 1.4 1.6 1.8 2.0 2.2 2.4 0.0 0.5 1.0 1.5 2.0 2.5 3.0 3.5 4.0 4.5 5.0 5.5 6.0 % Chloride % SO3 Hot Meal Evaluation Frequent Blockages No encrustations CCW – Hot meal SO3 and Chloride Graph Feb 2023
- 11. 2.57, 0.61 0.0 0.2 0.4 0.6 0.8 1.0 1.2 1.4 1.6 1.8 2.0 2.2 2.4 0.0 0.5 1.0 1.5 2.0 2.5 3.0 3.5 4.0 4.5 5.0 5.5 6.0 % Chloride % SO3 Hot Meal Evaluation Frequent Blockages No encrustations CCW – Hot meal SO3 and Chloride Graph Mar 2023