1. Covered Calls Income Report February 2011
MARKET OVERVIEW
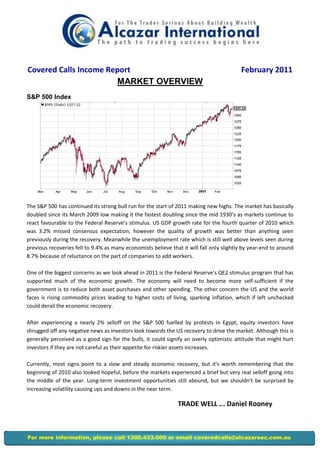
S&P 500 Index
The S&P 500 has continued its strong bull run for the start of 2011 making new highs. The market has basically
doubled since its March 2009 low making it the fastest doubling since the mid 1930’s as markets continue to
react favourable to the Federal Reserve’s stimulus. US GDP growth rate for the fourth quarter of 2010 which
was 3.2% missed consensus expectation; however the quality of growth was better than anything seen
previously during the recovery. Meanwhile the unemployment rate which is still well above levels seen during
previous recoveries fell to 9.4% as many economists believe that it will fall only slightly by year-end to around
8.7% because of reluctance on the part of companies to add workers.
One of the biggest concerns as we look ahead in 2011 is the Federal Reserve’s QE2 stimulus program that has
supported much of the economic growth. The economy will need to become more self-sufficient if the
government is to reduce both asset purchases and other spending. The other concern the US and the world
faces is rising commodity prices leading to higher costs of living, sparking inflation, which if left unchecked
could derail the economic recovery.
After experiencing a nearly 2% selloff on the S&P 500 fuelled by protests in Egypt, equity investors have
shrugged off any negative news as investors look towards the US recovery to drive the market. Although this is
generally perceived as a good sign for the bulls, it could signify an overly optimistic attitude that might hurt
investors if they are not careful as their appetite for riskier assets increases.
Currently, most signs point to a slow and steady economic recovery, but it's worth remembering that the
beginning of 2010 also looked hopeful, before the markets experienced a brief but very real selloff going into
the middle of the year. Long-term investment opportunities still abound, but we shouldn't be surprised by
increasing volatility causing ups and downs in the near term.
TRADE WELL ... Daniel Rooney
For more information, please call 1300.433.000 or email coveredcalls@alcazarsec.com.au
2. February Covered Call Recommendations
Code Stock Current Strike Premium Dividend Call Break Exercised Stop
Price Yield Even Call Yield Loss
BHP BHP Billiton Ltd. ADR $91.76 92.00 $1.40 0.92 2.53% 89.44 2.79% $84.97
(NYSE)
CRM Salesforce.com $134.32 135.00 $7.55 - 5.62% 126.77 6.13% $120.43
FCX Freeport-McMoRan $51.86 52.50 $1.70 - 3.28% 50.16 4.51% $47.65
Copper & Gold Inc.
KO The Coca-Cola Company $63.88 65.00 $0.32 0.47 1.24% 63.09 2.99% $59.94
MCD McDonald's Corp $75.21 75.00 $1.00 0.61 1.86% 73.60 1.86% $69.92
MSFT Microsoft Corp. $26.77 27.00 $0.44 - 1.64% 26.33 2.50% $25.01
NEM Newmont Mining Corp $54.76 55.00 $1.36 0.15 2.76% 53.25 3.20% $50.59
TBT ProShares UltraShort $38.19 39.00 $0.91 - 2.38% 37.28 4.50% $35.42
20+ Year Treasury
USO Unites States Oil Fund $38.97 40.00 $1.47 - 3.77% 37.50 6.42% $35.63
WIT Wipro Ltd. $12.85 12.50 $0.65 - 2.33% 12.20 2.33% $11.59
*N.B Please read the ‘Strategy Disclaimer’ found on the last page of this report before trading.
PLACE YOUR BUY AND SELL TRADES THROUGH
Alcazar International Pty Ltd
Call Our Dealing Desk – Daniel Rooney
Phone: 1300 433 000 or Email: coveredcalls@alcazarsec.com.au
That’s right, we offer clients our one stop shop, full service broking facility, providing you with full
execution services to trade Stocks, CFD’s, Options strategies, Futures and Forex.
Best rates – Best recommendations!
Open a trading account or transfer your current holdings and receive a FREE Portfolio review and 2
months FREE subscription to the Monthly Covered Call Income Report as well as the buy and sell
alerts via Email!
We can arrange to have the recommendations professionally mirror traded for
you, perfect for busy and time poor clients – Never Miss a Trade !!
For more information, please call 1300.433.000 or email coveredcalls@alcazarsec.com.au
3. BHP Billiton Ltd. ADR (NYSE)
Code Current Strike Premium Dividend Yield Break Yield If Stop
Price Even Exercised Loss
BHP $91.76 92.00 $1.40 $0.92 2.53% $89.44 2.79% $84.97
COMPANY OVERVIEW:
BHP Billiton is a diversified miner that supplies aluminium, coal, copper, iron ore, mineral sands, oil, gas, nickel,
diamonds, uranium, and silver. BHP Billiton is a global leader in the resources industry.
FUNDAMENTALS:
Market Capitalisation $261.28 Billion Sales Growth past 5 Years 14.59%
EPS (past 12 months) 6.13 Return on Equity 34.21%
EPS Growth next 5 Years 14.75% Net Profit Margin 28.03%
TECHNICAL:
BHP has been in a long term uptrend (31.20% increase ytd) riding the worldwide commodity boom making
continual higher highs and higher lows. BHP is in an uptrend trading range that is looking to head towards the
$100 per share mark.
ORDER Example: (N.B 1 US option contract = 100 shares)
- Buy Stop 100 BHP Shares @ $91.76
- Sell Limit 1 BHP 92.00 March Call @ $1.40
For more information, please call 1300.433.000 or email coveredcalls@alcazarsec.com.au
4. Salesforce.com
Code Current Strike Premium Dividend Yield Break Yield If Stop
Price Even Exercised Loss
CRM $134.32 135.00 $7.55 - 5.62% $126.77 6.13% $120.43
COMPANY OVERVIEW:
Salesforce.com is the leading provider of hosted customer relationship management software services. The
company is expanding the breadth of its services and aims to be a multi-application on-demand company.
FUNDAMENTALS:
Market Capitalisation $18.24 Billion Sales Growth past 5 Years 39.84%
EPS (past 12 months) 0.48 Return on Equity 5.56%
EPS Growth next 5 Years 28.22% Net Profit Margin 4.21%
TECHNICAL:
CRM is currently sitting above its 20 day, 50 day and 200 day moving average and continue its upward trend
which began in early 2009. The share price has doubled in the past year and continues its rising trending range.
Support is at $130.00. Watch for a breakout over $150.00 for bullish confirmation.
ORDER Example: (N.B 1 US option contract = 100 shares)
- Buy Stop 100 CRM Shares @ $134.32
- Sell Limit 1 CRM 135.00 March Call @ $7.55
For more information, please call 1300.433.000 or email coveredcalls@alcazarsec.com.au
5. Freeport-McMoRan Copper & Gold Inc.
Code Current Strike Premium Dividend Yield Break Yield If Stop
Price Even Exercised Loss
FCX $51.86 52.50 $1.70 - 3.28% $50.16 4.51% $47.65
COMPANY OVERVIEW:
Freeport McMoRan is the world's largest publicly traded copper miner, selling roughly 4 billion pounds of
copper annually, equivalent to about 12% of global mine output. Three variables are likely to dictate Freeport's
long-term fortunes: the price of copper, the transition to underground mining at Grasberg, and the political
situation in the Democratic Republic of Congo.
FUNDAMENTALS:
Market Capitalisation $49.40 Billion Sales Growth past 5 Years 35.35%
EPS (past 12 months) 4.57 Return on Equity 45.58%
EPS Growth next 5 Years 4.70% Net Profit Margin 29.13%
TECHNICAL:
FCX has pulled back from its January high of $61.35 back to sit just above $50.00. This mark should offer some
support as it longs to continue its long term up trend. Pay attention to share price if it breaks below $50.00
support level.
ORDER Example: (N.B 1 US option contract = 100 shares)
- Buy Stop 100 FCX Shares @ $51.86
- Sell Limit 1 CRM 52.50 March Call @ $1.70
For more information, please call 1300.433.000 or email coveredcalls@alcazarsec.com.au
6. The Coca-Cola Company
Code Current Strike Premium Dividend Yield Break Yield If Stop
Price Even Exercised Loss
KO $63.88 65.00 $0.32 $0.47 1.24% $63.09 2.99% $59.94
COMPANY OVERVIEW:
Coca-Cola is the world's largest manufacturer, distributor, and marketer of non-alcoholic beverage
concentrates and syrups. The firm also sells a variety of noncarbonated drinks such as water, juices, and teas.
With almost three fourths of the company's revenue generated outside the United States, Coke's footprint
extends throughout the world through its global network of bottlers.
FUNDAMENTALS:
Market Capitalisation $149.33 Billion Sales Growth past 5 Years 39.73%
EPS (past 12 months) 5.05 Return on Equity 42.32%
EPS Growth next 5 Years 8.47% Net Profit Margin 33.77%
TECHNICAL:
KO has increase its share price by 25.83% over the past year. The past 4 months have seen the share price
trade in a channel between $62.00 and $66.00. Investors should only consider closing out their trade if the
share price breaks support and closes below $62.00, otherwise a break above $66.00 ensures bullish outlook
and to continue with strategy.
ORDER Example: (N.B 1 US option contract = 100 shares)
- Buy Stop 100 KO Shares @ $63.88
- Sell Limit 1 CRM 65.00 March Call @ $0.32
For more information, please call 1300.433.000 or email coveredcalls@alcazarsec.com.au
7. McDonald’s Corporation
Code Current Strike Premium Dividend Yield Break Yield If Stop
Price Even Exercised Loss
MCD $75.21 75.00 $1.00 $0.61 1.86% $73.60 1.86% $69.92
COMPANY OVERVIEW:
McDonald's generates revenue through company-owned restaurants, franchise royalties, and licensing pacts.
Restaurants offer a uniform value-priced menu, with some regional variations. As of December 2010, there
were 32,700 locations in 117 countries, including 26,300 operated by franchisees/affiliates and 6,400 company
units.
FUNDAMENTALS:
Market Capitalisation $78.65 Billion Sales Growth past 5 Years 4.72%
EPS (past 12 months) 4.58 Return on Equity 34.51%
EPS Growth next 5 Years 10.21% Net Profit Margin 20.55%
TECHNICAL:
McDonalds share price has increased by 19.37% over the past year peaking in early December with a high of
just over $80.00. There is a strong support at $73.00 which the share price has bounced off as it looks to
continue its bull run by making new higher highs and higher lows.
ORDER Example: (N.B 1 US option contract = 100 shares)
- Buy Stop 100 MCD Shares @ $75.21
- Sell Limit 1 MCD 75.00 March Call @ $1.00
For more information, please call 1300.433.000 or email coveredcalls@alcazarsec.com.au
8. Microsoft Corporation
Code Current Strike Premium Dividend Yield Break Yield If Stop
Price Even Exercised Loss
MSFT $26.77 27.00 $0.44 - 1.64% $26.33 2.50% $25.01
COMPANY OVERVIEW:
Microsoft develops the Windows operating system and the Office suite of productivity software. Windows and
Office account for roughly 56% of Microsoft's revenue, with another 24% coming from software for enterprise
servers. The firm's other businesses include the Xbox 360 video game console, Bing Internet search, business
software, and software for mobile devices.
FUNDAMENTALS:
Market Capitalisation $32.58 Billion Sales Growth past 5 Years 27.30%
EPS (past 12 months) 0.46 Return on Equity 24.69%
EPS Growth next 5 Years 10.55% Net Profit Margin 17.35%
TECHNICAL:
Microsoft has been in a clear uptrend since July 2010 and looks to find more support off its up-trending line
and the $26.00 mark. A share price remaining above the $26.00 ensures a holding a long term bullish view for
this covered call strategy.
ORDER Example: (N.B 1 US option contract = 100 shares)
- Buy Stop 100 MSFT Shares @ $26.77
- Sell Limit 1 MSFT 27.00 March Call @ $0.44
For more information, please call 1300.433.000 or email coveredcalls@alcazarsec.com.au
9. Newmont Mining Corporation
Code Current Strike Premium Dividend Yield Break Yield If Stop
Price Even Exercised Loss
NEM $54.76 55.00 $1.36 $0.15 2.76% $53.25 3.20% $50.59
COMPANY OVERVIEW:
Newmont Mining is the world's second-largest gold producer. In 2009, the firm produced 6.5 million ounces of
gold (consolidated, equity: 5.3 million), and 507 million pounds of copper (consolidated, equity: 226 million).
North America accounted for 32% of consolidated gold production, South America for 32%, Asia Pacific for
28%, and Africa for 8%. As of Dec. 31, 2009, Newmont had 92 million ounces of proven and probable gold
equity reserves.
FUNDAMENTALS:
Market Capitalisation $26.85 Billion Sales Growth past 5 Years 17.47%
EPS (past 12 months) 4.61 Return on Equity 19.17%
EPS Growth next 5 Years 8.27% Net Profit Margin 32.92%
TECHNICAL:
Newmont has been trending between $54.00 and $64.00 for the past 9 months and is heading towards strong
support at $54.00. The fundamentals of NEM are sound so provided the share price does not close below
$54.00 it will remain a long term hold to write covered calls.
ORDER Example: (N.B 1 US option contract = 100 shares)
- Buy Stop 100 NEM Shares @ $54.76
- Sell Limit 1 MSFT 55.00 March Call @ $1.36
For more information, please call 1300.433.000 or email coveredcalls@alcazarsec.com.au
10. ProShares UltraShort 20+ Year Treasury
Code Current Strike Premium Dividend Yield Break Yield If Stop
Price Even Exercised Loss
TBT $38.19 39.00 $0.91 - 2.38% $37.28 4.50% $35.42
COMPANY OVERVIEW:
ProShares UltraShort Lehman 20+ Treasury TBT is primarily an ETF holding for investors with a high-conviction
belief that long-dated Treasury bonds will drop in value. Investors interested in this fund essentially think the
unprecedented moves by the Federal Reserve’s quantitative easing program will cause an increase in inflation
making fixed investments such as long-dated bonds undesirable causing TBT to increase.
FUNDAMENTALS:
Market Capitalisation - Sales Growth past 5 Years -
EPS (past 12 months) - Return on Equity -
EPS Growth next 5 Years - Net Profit Margin -
TECHNICAL:
TBT has been increasing of its low of $29.77 since August 2010 as fears about inflation and rising commodity
prices have seen money flow out of US Treasuries. Currently TBT has found resistance at the $40.00 level but
continues to make higher highs and higher lows. $36.00 and $34.00 offer strong support levels.
ORDER Example: (N.B 1 US option contract = 100 shares)
- Buy Stop 100 TBT Shares @ $38.19
- Sell Limit 1 MSFT 39.00 March Call @ $0.91
For more information, please call 1300.433.000 or email coveredcalls@alcazarsec.com.au
11. United States Oil Fund
Code Current Strike Premium Dividend Yield Break Yield If Stop
Price Even Exercised Loss
USO $38.97 40.00 $1.47 - 3.77% $37.50 6.42% $35.63
COMPANY OVERVIEW:
United States Oil (USO) is an ETF that tracks the price of light, sweet crude oil. With unrest in the Middle East
combined with the improving economy of the US has caused speculators and investors looking to hedge
against inflation to move into oil.
FUNDAMENTALS:
Market Capitalisation - Sales Growth past 5 Years -
EPS (past 12 months) - Return on Equity -
EPS Growth next 5 Years - Net Profit Margin -
TECHNICAL:
USO has increased its share price by 16.74% over the past 6 months as it continues to make new monthly
highs. USO is still a third of the price it was when it peaked in mid 2008 just below $120 so there is a great deal
of upside potential making it a long term share to hold and write calls on.
ORDER Example: (N.B 1 US option contract = 100 shares)
- Buy Stop 100 USO Shares @ $38.97
- Sell Limit 1 USO 40.00 March Call @ $1.47
For more information, please call 1300.433.000 or email coveredcalls@alcazarsec.com.au
12. Wipro Limited
Code Current Strike Premium Dividend Yield Break Yield If Stop
Price Even Exercised Loss
WIT $12.85 12.50 $0.65 - 2.33% $12.20 2.33% $11.59
COMPANY OVERVIEW:
Wipro has become one of the world's largest IT services providers. Its largest business division is IT services
(75% of revenue), which provides software and services to a multinational client base. The IT product division
(13% of revenue) sells a range of desktop computers, servers, and notebooks.
FUNDAMENTALS:
Market Capitalisation $32.58 Billion Sales Growth past 5 Years 27.30%
EPS (past 12 months) 0.46 Return on Equity 24.96%
EPS Growth next 5 Years 16.75% Net Profit Margin 17.35%
TECHNICAL:
Wipro has been trading in a 52 week range between $11.19 and $16.76 and currently sits around $13 where it
looks to have consolidated. WIT has great potential on the upside as it remains a strong hold above $11.20.
ORDER Example: (N.B 1 US option contract = 100 shares)
- Buy Stop 100 WIT Shares @ $12.85
- Sell Limit 1 WIT 12.50 March Call @ $0.65
For more information, please call 1300.433.000 or email coveredcalls@alcazarsec.com.au
13. Strategy Disclaimer
Please note that the share price and call premium stated in this newsletter can change from the time the Monthly Covered
Call Report is released to when trades are placed on entry when the market opens resulting in different current share prices
and call yields to this report, which may result in trades returning different yields to the ones stated. Although every attempt
has been made to ensure the accuracy and completeness of any information or data contained in this report, we do not give
any express or implied warranty as to its accuracy or accept any liability for error or omission.
The call yield does not take into account brokerage costs, slippage costs, commissions and/or fees paid to a broker or any
other transaction costs associated with trading.
Orders should be placed when the market is open to ensure being filled as close to the desired price as possible. Placing stop
and/or limit orders when the market is closed are at the investors own risk as orders can be filled at unwanted prices due to
prices gaping whilst the market is closed.
None of the information and data contained on nor any opinion expressed on this website constitutes a recommendation to
purchase, buy or sell a financial product, or the provision of personal investment advice.
Any example trades contained on this website are hypothetical. Example trades are provided for illustrative purposes only
and should not be construed as investment advice or strategy to suit you. Hypothetical performance results are simulated
and have many inherent limitations. As the trades have not actually been executed, the results may have under or over
compensated for any impact of certain market factors, such as lack of liquidity. We make no representation that any actual
trades will or are likely to achieve profits or losses similar to any example trades contained in this newsletter. Hypothetical
trades do not involve financial risk. For example, the ability to withstand losses or to adhere to a particular trading program in
spite of trading losses are important issues which may adversely affect actual trading results.
Any methods, techniques, or indicators presented in this newsletter are for educational purposes only and are presented to
assist you to make your own judgments on any prospective trades (for which you are responsible). They should not be
construed as investment advice or strategy for you personally. We make no representation that the use of any methods,
techniques, or indicators presented in this website will or are likely to achieve any intended results
You accept all risks and responsibility for losses, damages, costs and other consequences resulting directly or indirectly from
using this newsletter and any information or material available from or through it.
The subscription fee is only $200 per month, which includes auto trading the strategies
on your own account, no contracts, cancel anytime.
100% Money Back Guarantee!
We are so sure that you will love the Alcazar Covered Calls Income Report that we are offering an
unconditional 100% money-back guarantee.
If you are not completely satisfied with your purchase, simply notify us within 30 days and we will refund your
subscription fee, in full, with absolutely no questions asked! That’s 30 days to put us to the test. I don’t think
I can be any fairer than that.
Tax Deduction:
Your subscription fee to Alcazar Covered Calls Income Report is fully tax deductable, if you use the
services offered to assist you to derive income or capital gain.
Call now to join, trade smart not often, mirror trade and never miss a trade!
Please contact our Dealing Desk to:
1. Become a Subscriber
2. Open your online trading account
3. Place your trading order
4. Auto trade your alerts – (Never miss a trade)
5. Receive regular market reports
Phone Allen Liao: 1300.433.000
For more information, please call 1300.433.000 or email coveredcalls@alcazarsec.com.au