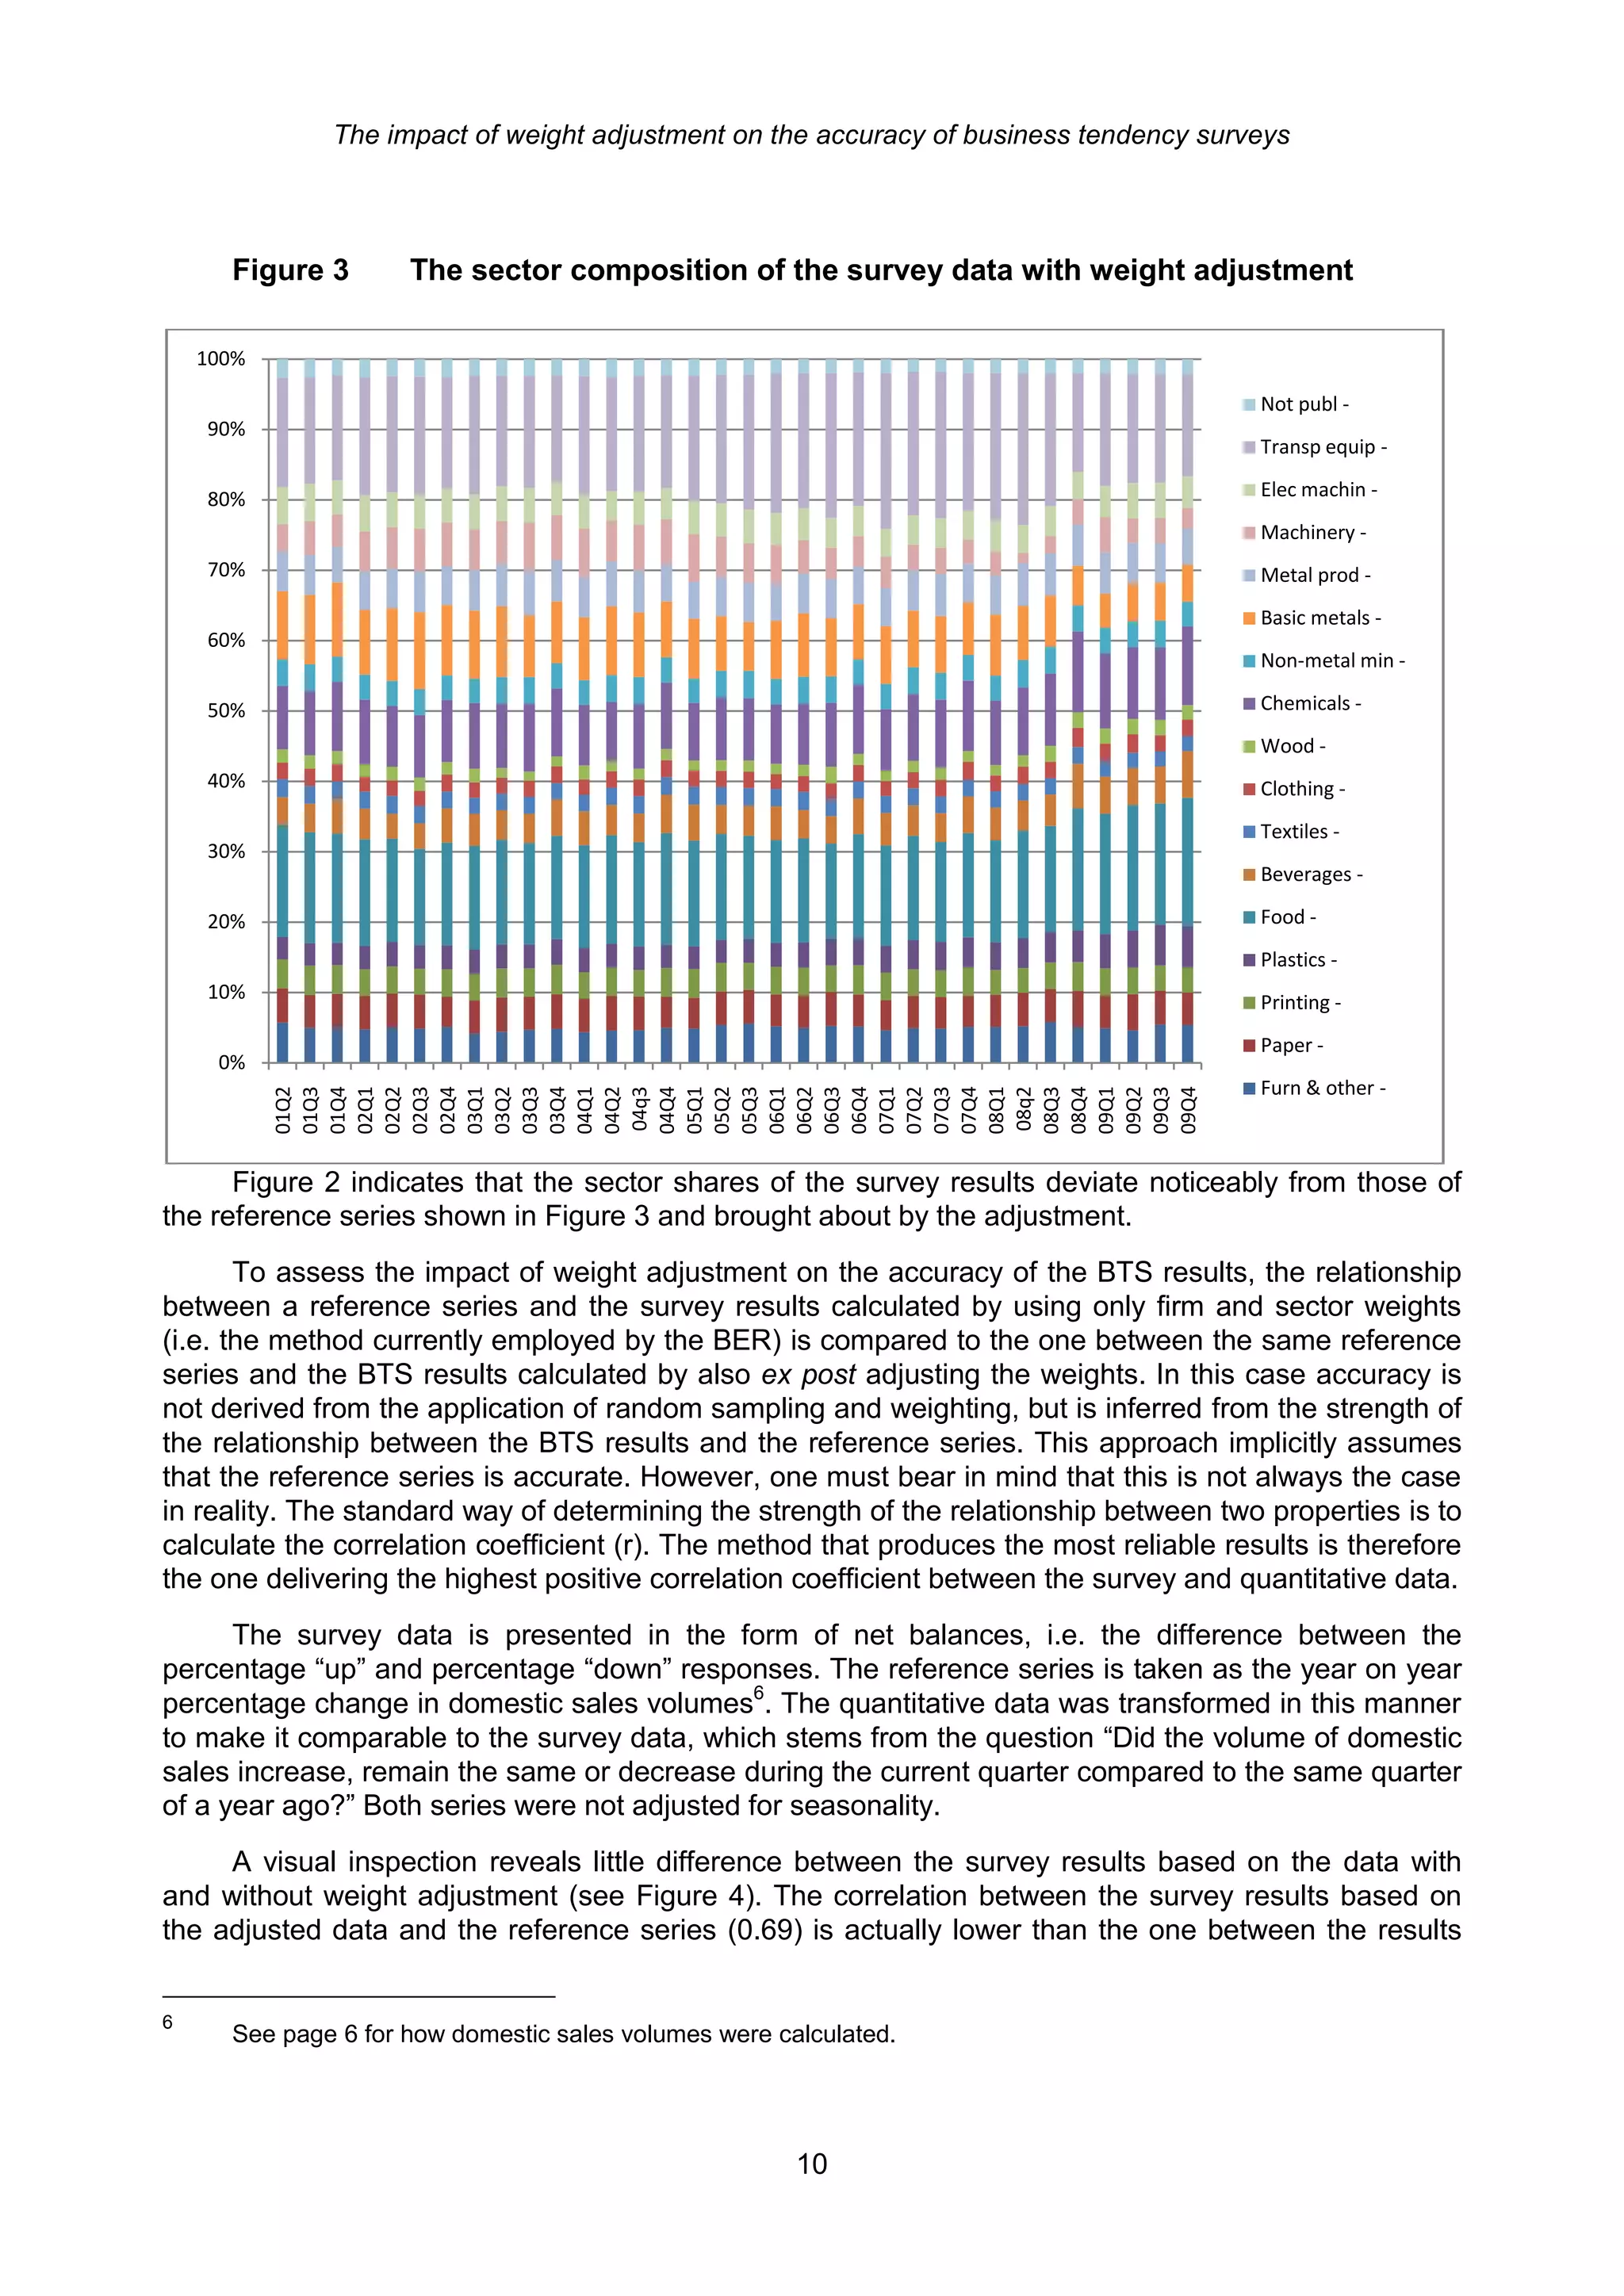
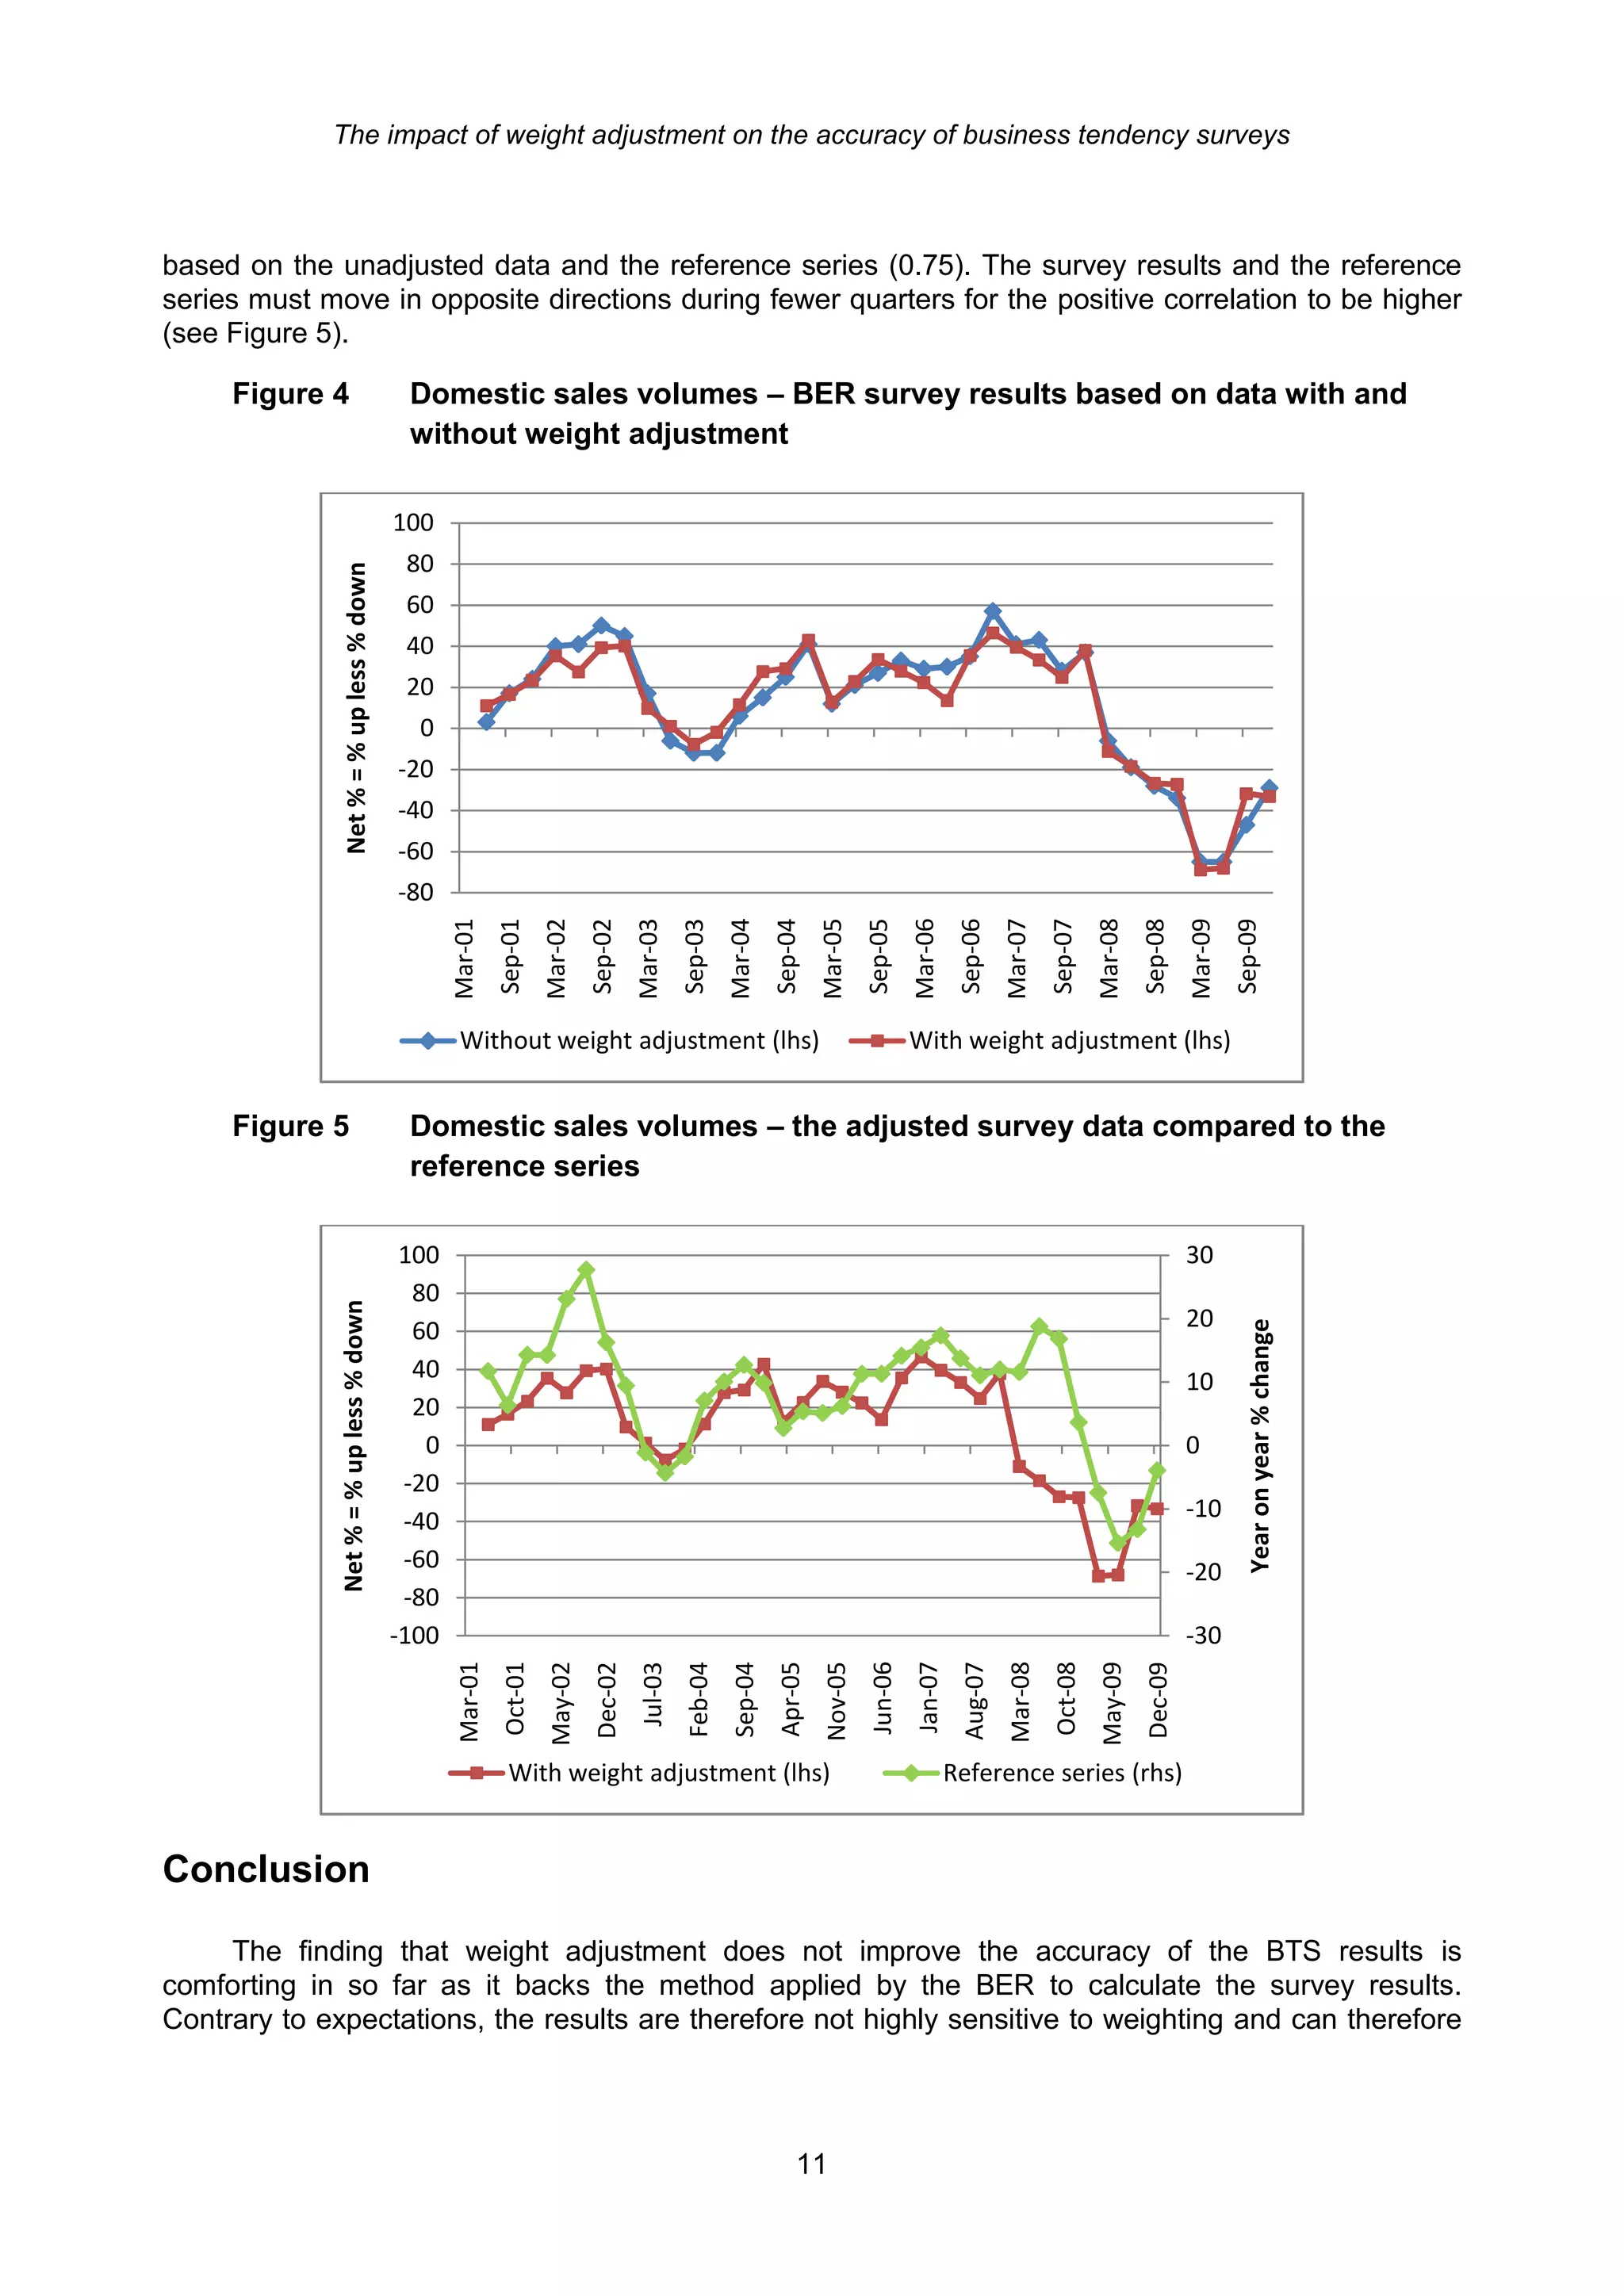
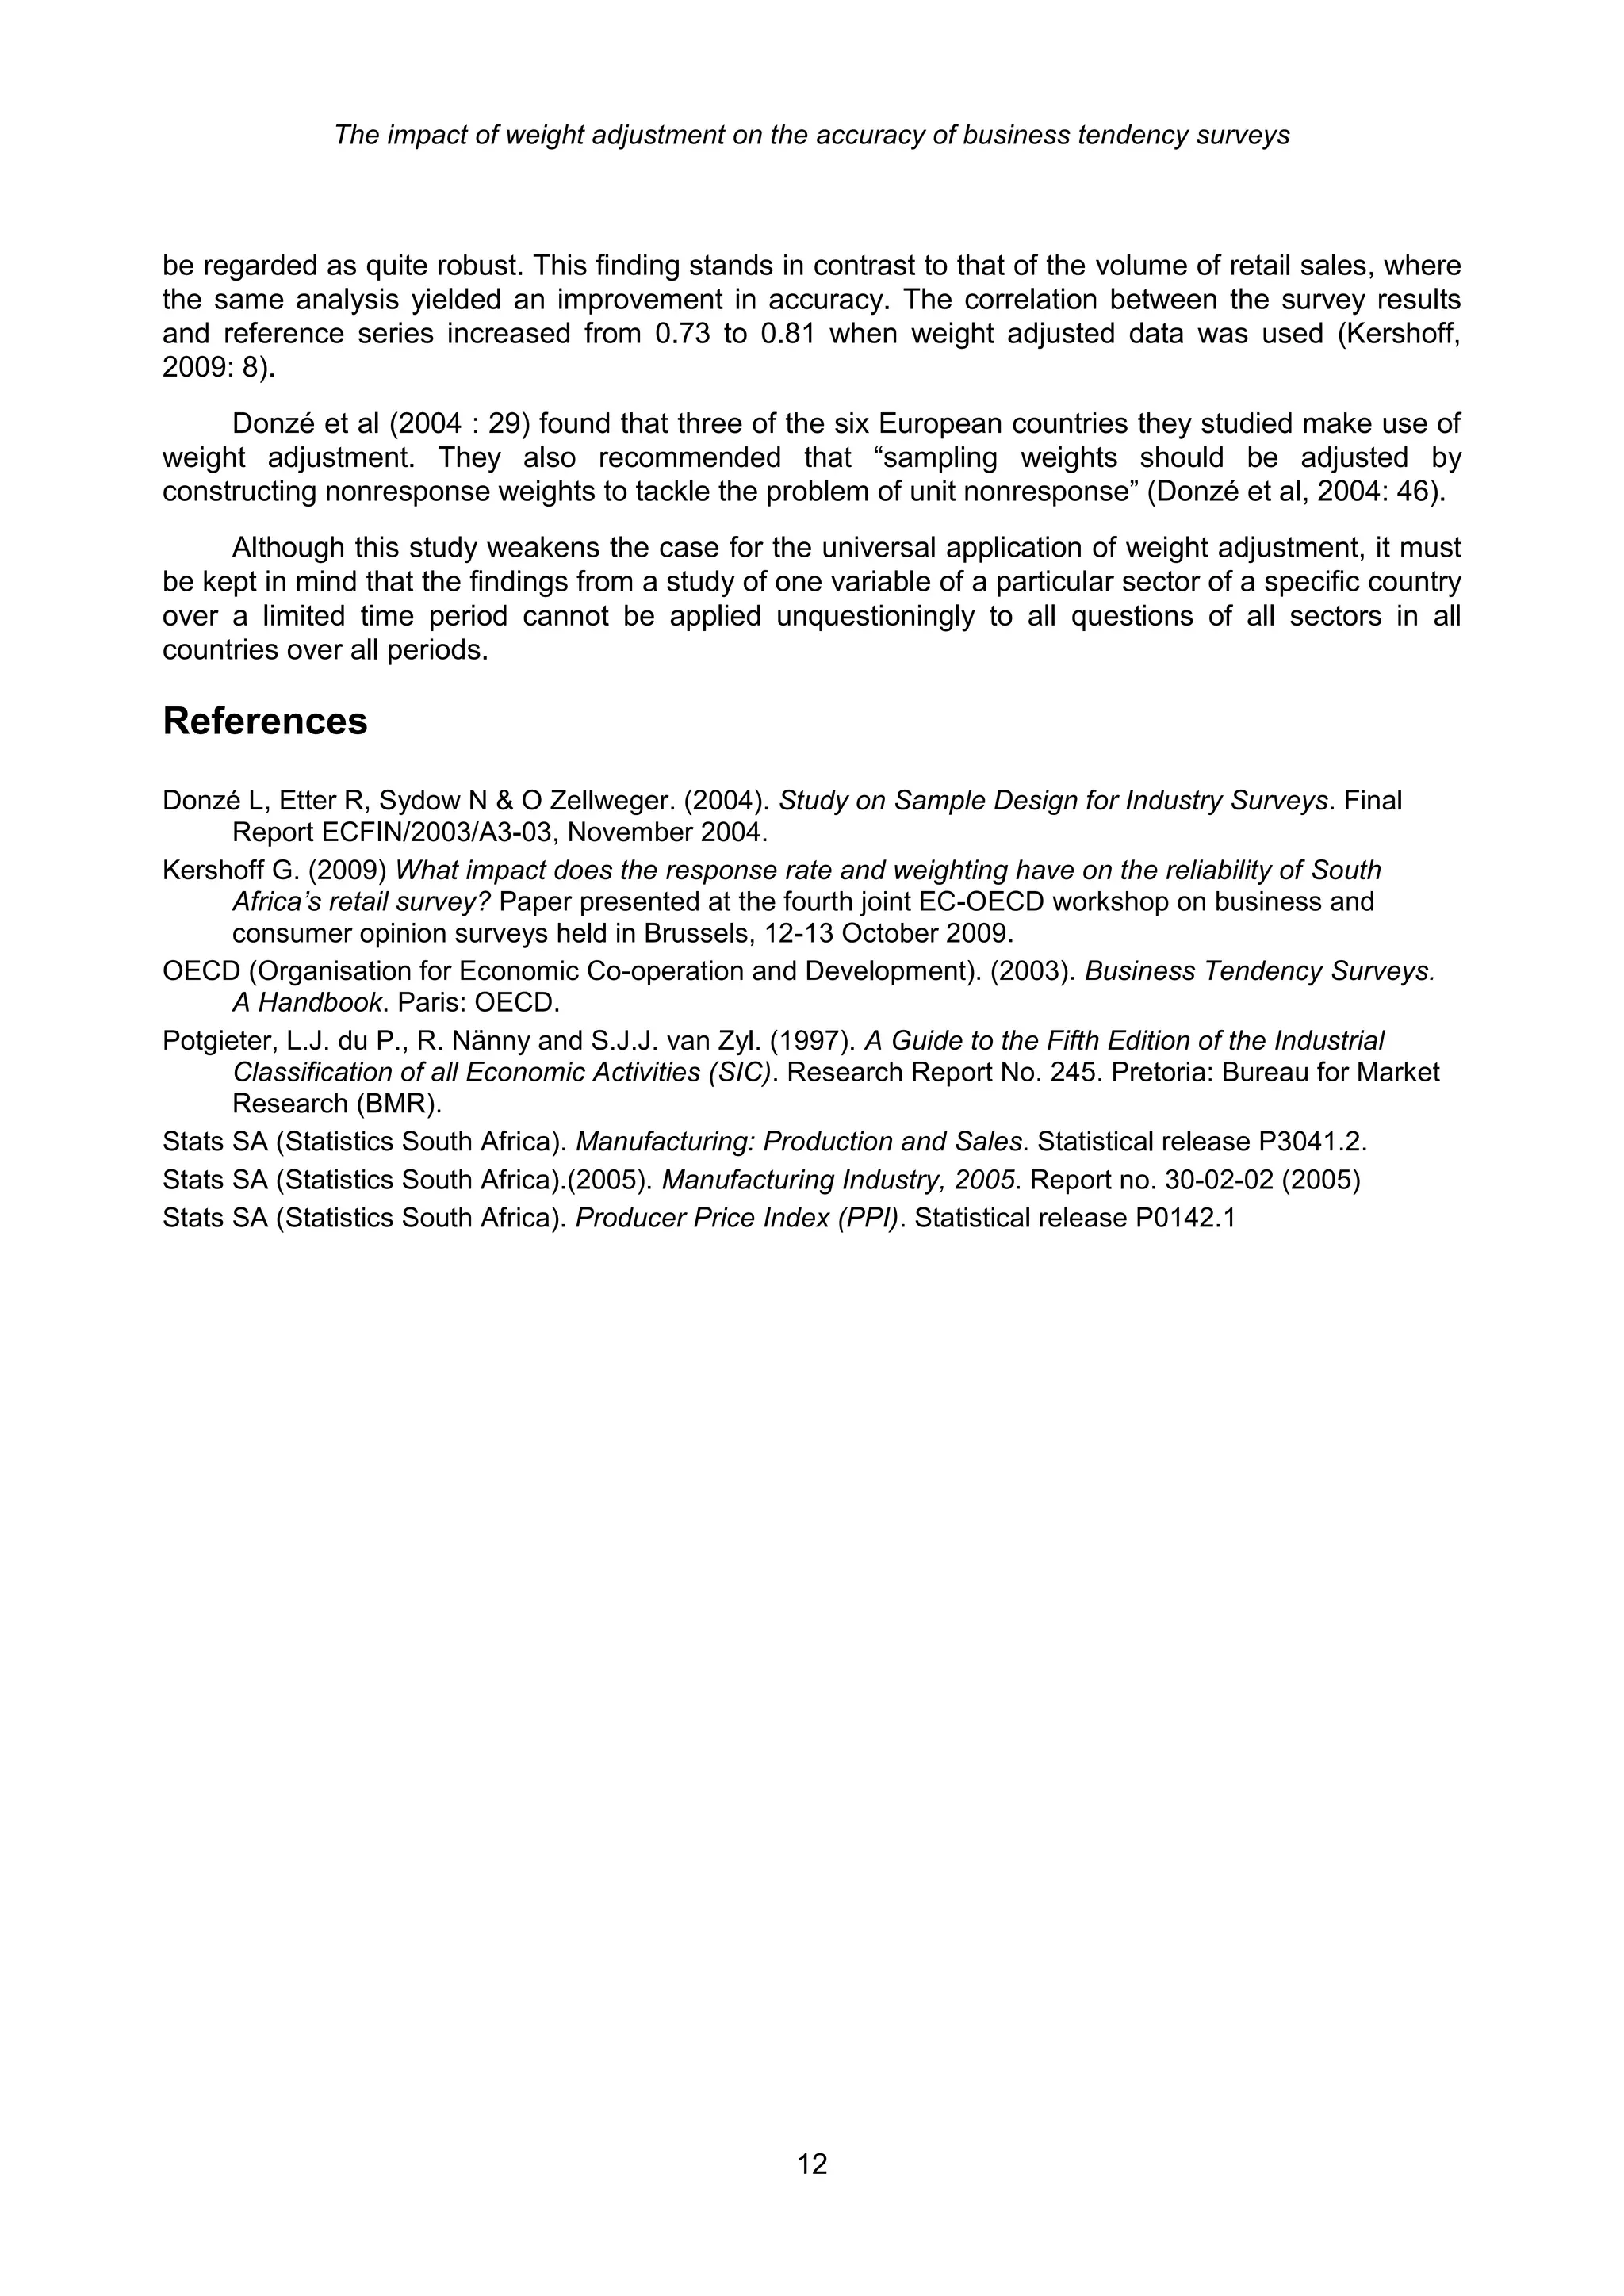
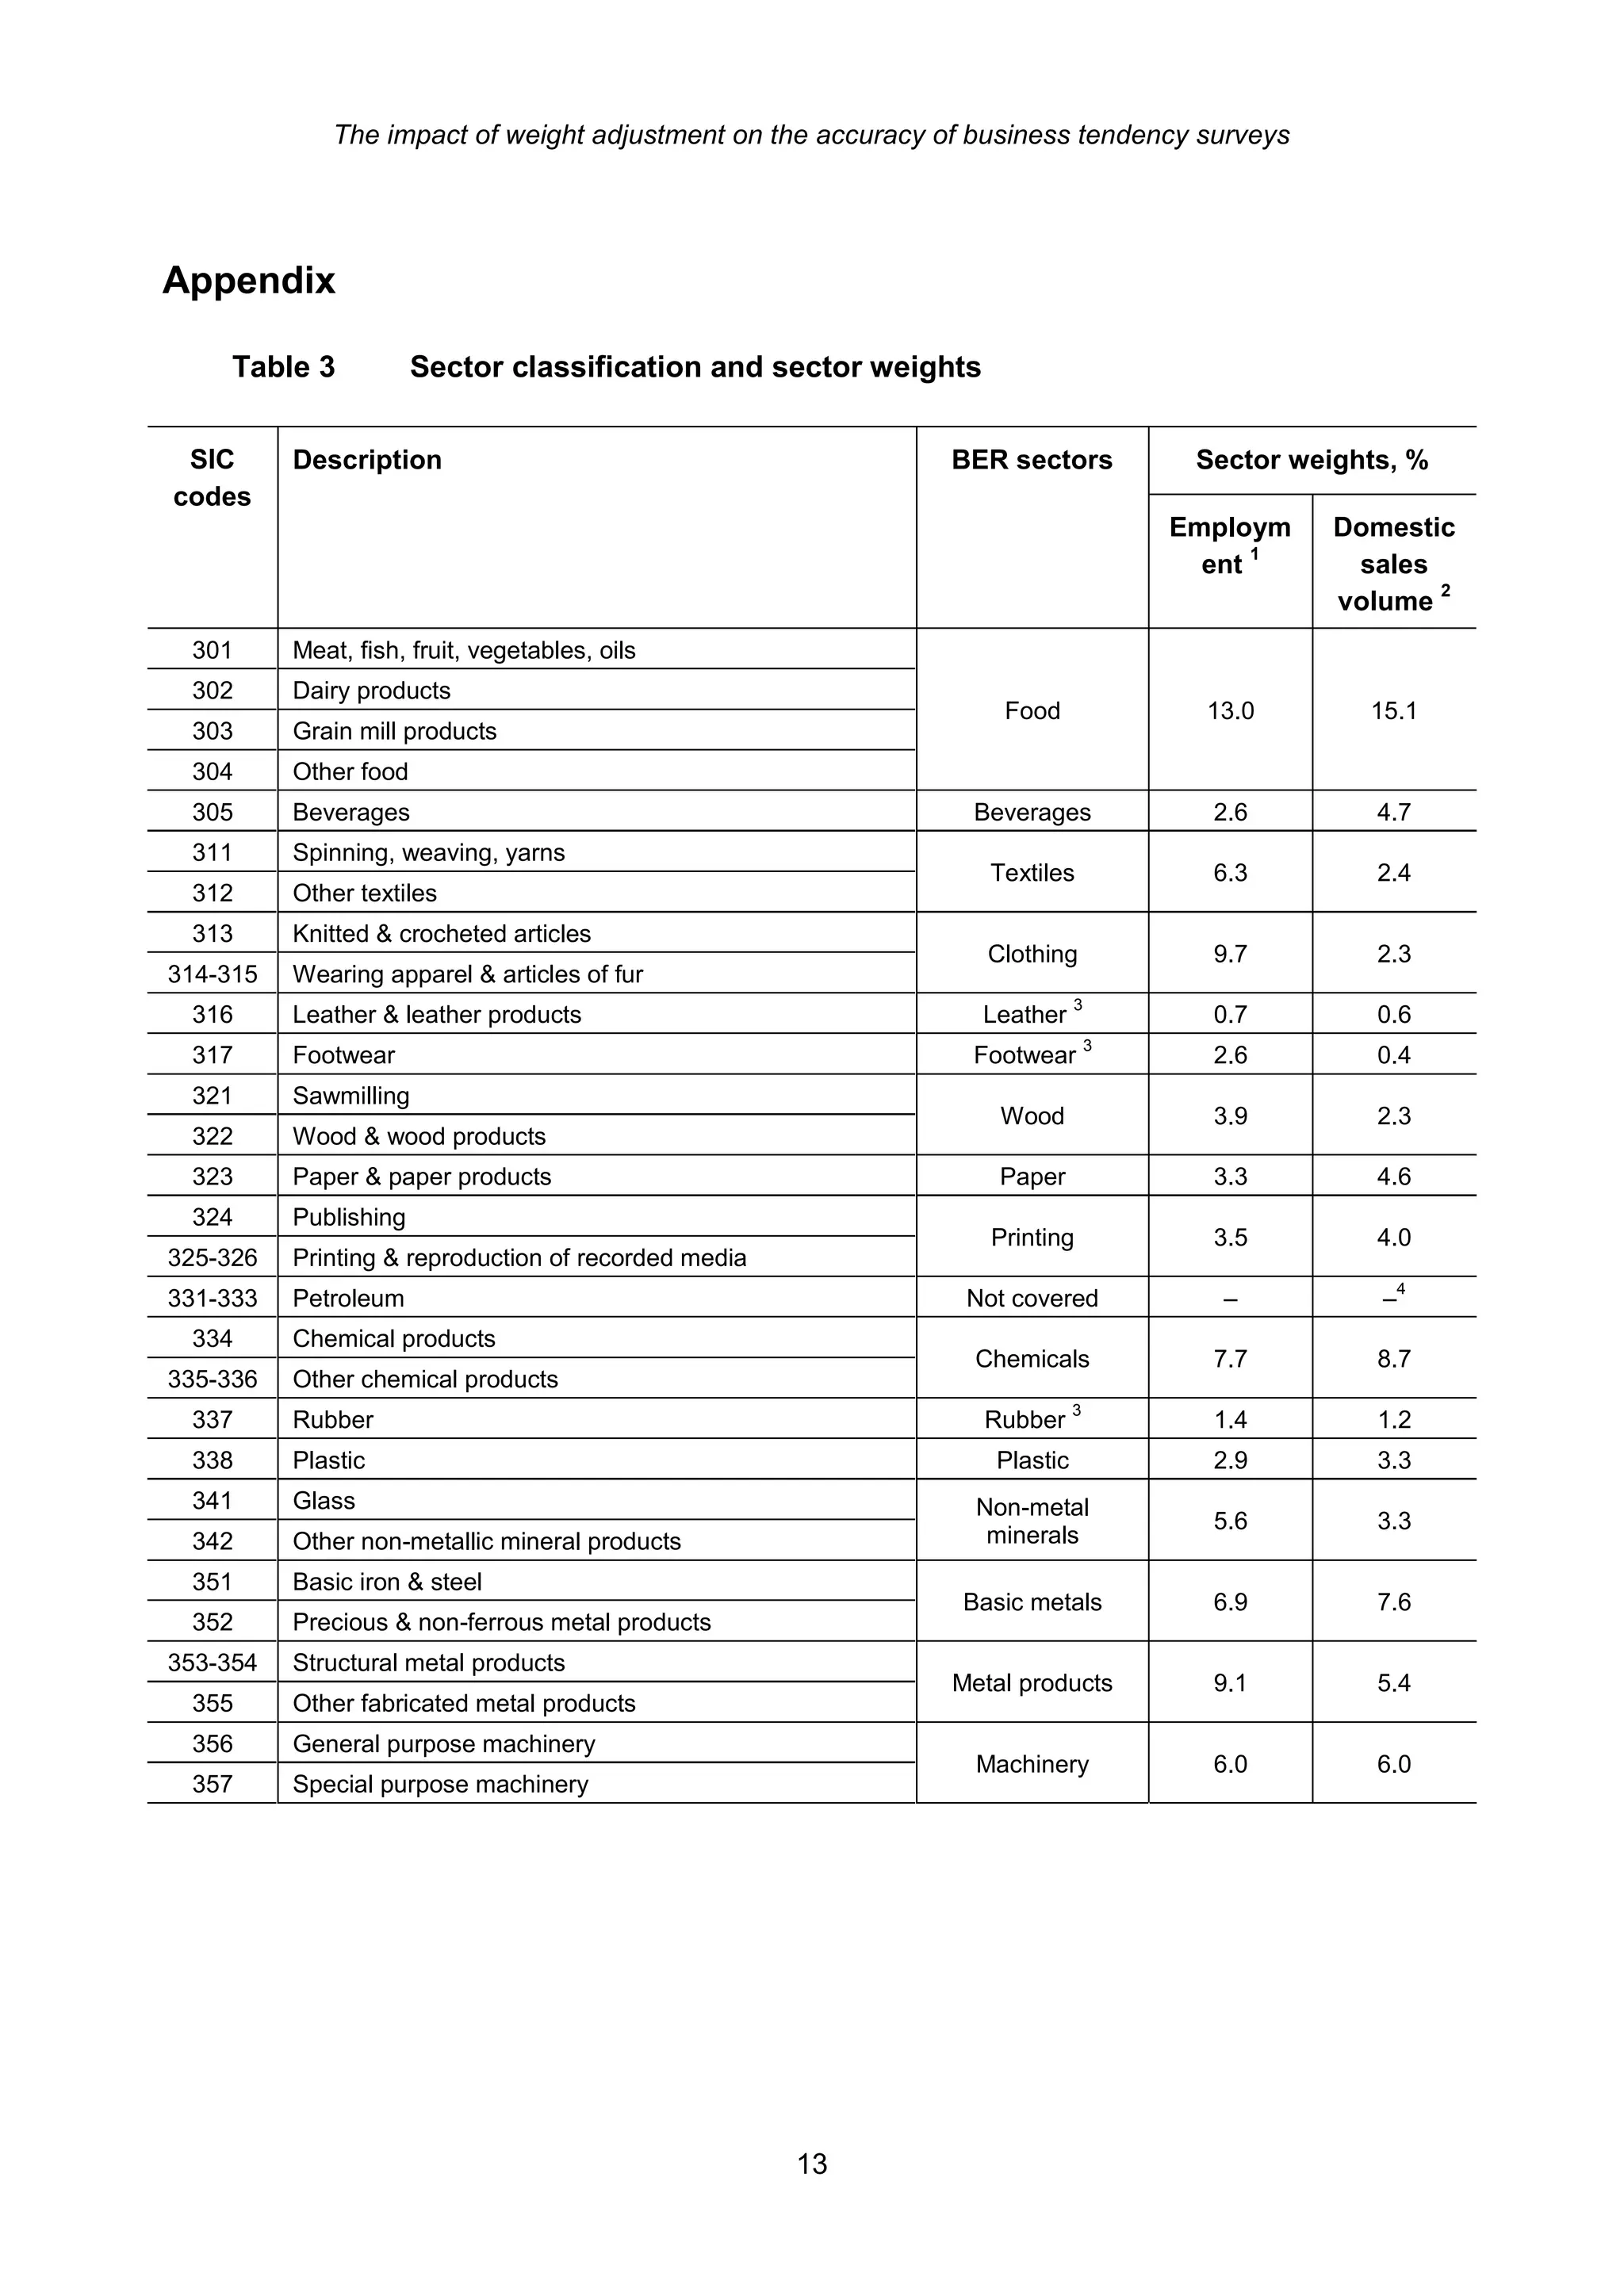
30th CIRET Conference, New York, October 2010


     The impact of weight adjustment on the accuracy of
                business tendency surveys

      An assessment of the manufacturing survey of South Africa

                                           George Kershoff
                                                                                                *
            Deputy Director, Bureau for Economic Research (BER), Stellenbosch University

Abstract

         Firm weights are applied to the qualitative responses of participants to calculate business
     tendency survey (BTS) results. Sector weights are employed to produce higher levels of
     aggregation. If a comprehensive and current business register is available, sampling weights
     are utilized to provide for selection probability and significance.

         What impact does weighting have on the accuracy of the BTS results? If a national
     business register is unavailable and the response rate is low (i.e. the characteristics of the
     reporting units are unlikely to be the same as those of the sample units), accuracy is not derived
     from the application of random sampling and weighting, but is inferred if a close relationship
     between the survey results and a reference series can be established.

         To assess the impact of weighting on the accuracy of survey results, the relationship
     between a reference series and the BTS results calculated by using only firm and sector
     weights is compared to one between the same reference series and the BTS results calculated
     by also ex post adjusting the weights. Weight adjustment rectifies deviations (over and under
     representation) between the structure of the responses and that of the population. Non-
     responses (missing data) are in effect treated by increasing the weights of those that
     responded.

          A visual inspection reveals little difference between the survey results based on the data
     with and without weight adjustment. The correlation between the survey results based on the
     adjusted data and the reference series (0.69) is lower than the one between the results based
     on the unadjusted data and the reference series (0.75).

         The finding that weight adjustment does not improve the accuracy of the BTS results is
     comforting in so far as it backs the method applied by the BER to calculate the survey results.
     Contrary to expectations, the results are therefore not highly sensitive to weighting and can
     therefore be regarded as quite robust.


*
     BER, Private Bag X5050, Stellenbosch, 7599, South Africa. E-mail: gjkk@sun.ac.za. This paper was finalised
     on 30 June 2010.
The impact of weight adjustment on the accuracy of business tendency surveys


Key Words:     Manufacturing sector, business tendency survey (BTS) method, weighting, firm weights,
               sector weights, weight adjustment, South Africa

JEL Classification:   C42


                                                   2
The impact of weight adjustment on the accuracy of business tendency surveys


Introduction

      Business tendency surveys (BTS) use questionnaires to collect data from firms. Data on the
business performance (such as sales, prices, stocks and employment) is collected. The
questionnaires are sent to only a selection of firms from the population or universe. Not all firms in the
population are quizzed, because it would be too laborious and / or expensive. The selection of firms is
called a sample and is put together in such a way as to represent the structure of the population in the
best way possible. The results obtained from surveying a sample is inferred to apply to the whole
population.
      BTS are regarded as longitudinal research as the same phenomenon – the performance of
business – is studied over time. The same questionnaire and sample are used between consecutive
surveys. Given that the same sample is used, BTS resembles panel research. Tracking the same
firms increase accuracy, as it raises the response rate and likelihood that changes in the results can
be attributed to actual changes and not to the use of different samples. However, care must be taken
that the structure of the panel does not drift away from that of the population, as inferences about the
population can in such cases not be made from the results obtained from the panel.
     The question that immediately follows from this is what impact does the sample design have on
the accuracy of BTS results, where accuracy is defined as the closeness between the estimated value
and the (unknown) true population value. The sample design consists of various elements, which
could all affect accuracy. This paper focuses on only one aspect, namely the impact of the
representativeness of the actual responses on the accuracy of the BTS results. Inferences about the
population cannot be drawn from the results obtained from a sample if the structure of the responses
deviates significantly from that of the population.
      To narrow it down further, this paper focuses only on the impact of weighting on the accuracy of
BTS results. What is weighting? Each sample unit is allocated a weight that reflects its relative
importance in the population. Weighting is necessary to make the sample representative of the
population. So, the specific question arising from this is: If the response rate is low and the majority of
participants do not respond to every survey, what impact does using fixed sample weights in contrast
to variable reporting unit weights have on the accuracy of BTS results? (If the response rate is close to
100%, then the sample and reporting units would agree and the sample and reporting unit weights
would be the same.) Does adjusting the weights to provide for non-responses and the resultant over
and under representation / biases of the actual responses (as opposed to a representative sample)
before processing the results of each survey improve accuracy?
       Furthermore, this study of the impact of weighting on the accuracy of BTS results is limited
further to situations where information on the structure of the population is totally unavailable or very
limited. If such information is lacking, it is impossible to establish if the structure of the sample reflects
that of the population. In such circumstances, stratified random sampling and the estimation of
sampling weights are not possible. Purposive (non-probability) sampling can be employed, but then
the margins of error of the survey results cannot be estimated and the only way to establish accuracy
is to infer it from a close relationship between the survey results and a corresponding benchmark or
reference series, assuming that such a series is accurate, i.e. accurately reflect the (unknown) true
population value.
     This study is an instance where the robustness of the BTS results are examined, as a sensitivity
analysis is conducted to establish how one element of the survey design – weighting – affects the
accuracy of BTS results. Furthermore, by comparing the BTS results to a benchmark, this study is also
an example of where the quality of the results is monitored.


                                                      3
The impact of weight adjustment on the accuracy of business tendency surveys


Using weights to calculate the survey results

     The OECD (Organisation for Economic Co-operation and Development) published a handbook in
2003 to outline the international best practice to conduct BTS. In the handbook, the OECD
recommends that sample and size weights be used to process BTS.
      What are sample weights? Sample weights are the inverse of the probability with which each
reporting unit has been selected. The following example is provided in the handbook to explain sample
weights: “Suppose, for example, that the target universe has been divided into two groups – large and
small reporting units. If all large reporting units are selected for the sample (probability of 1) and if only
one in ten are selected from the small reporting units (probability of 0.1), the answers of the reporting
units must be multiplied by 1/1 =1 and 1/0.1 =10 respectively. Higher weights are given to the small
reporting units because they have to represent all the other small reporting units that were not
selected for the sample (OECD, 2003: 36). In practice, sample weights can only be estimated if
detailed information on the structure of the population, such as the number of firms per sector and size
class, is available. Such information is usually derived from a business register of all the firms of a
country. Stratified random sampling cannot be used and the sampling weights per reporting unit
cannot be calculated if such a business register is unavailable.
      What are size weights? Given that not the whole population, but only a selection of firms is
surveyed, each reporting unit is multiplied by a size weight reflecting its relative importance in the
population. Size weights, therefore, raise the results originating from a sample to that of the
population. Two types of size weights are distinguished, namely firm and sector weights. Firm weights
are used to calculate BTS results, because it is assumed that the answers of large firms carry more
weight than those of small firms. Firm weights “are not generally required in processing answers to
quantitative questions because the answers already reflect the size of the reporting unit. Data reported
on the value of sales, tons of output, numbers employed, etc. will be in larger values, volumes or
numbers for large firms than for small ones” (OECD, 2003: 37). Number of employees and turnover
are typically used as firm weights. Sector weights are used to aggregate the results to higher levels,
such as from meat producers to all food producers and finally to all manufacturers. Variables, such as
value added, income, sales and production, can be used as sector weights. The choice depends on
the availability of data and the preferred reference series. For instance, value added can be used as
sector weights if the survey results are to closely reflect the movements in GDP. If a breakdown of
value added is unavailable, then sales, for example, can be used. The BTS results have in practice
turned out to be not extremely sensitive to the choice of the weighting variable (OECD, 2003:37).
      The OECD recommends that the results per sector (e.g. food, beverages and clothing) be
calculated in practice as the sum of the weights per question / variable. The weights, in turn, should be
computed as the responses (i.e. up, same or down) times the sample weights times the firm weights.
The total / aggregate is to be calculated as the sum of the weights per sector (calculated as the
responses multiplied by their sample weights) times their respective sector weights. The difference
between calculating the results per sector and the total is that firm weights are not used in the latter
instance (OECD, 2003: 37-47).
     The biggest difference between the method that the BER applies to calculate the survey results
and the one recommended by the OECD is that the BER does not make use of sample weights. The
reason why sample weights are not employed is that they cannot be estimated without access to the
national business register. Statistics South Africa (Stats SA, 2005) has published the findings of a
census of the manufacturing sector and publishes the total number of firms in the universe in its
monthly manufacturing production and sales statistical releases, but not a detailed breakdown of the
number of firms per sector and size class contained in the business register.


                                                      4
The impact of weight adjustment on the accuracy of business tendency surveys


     The BER cannot employ stratified random sampling to put together and maintain a panel as
recommended by the OECD due to the unavailability of the national business register. Instead, the
BER makes use of purposive (non-probability) sampling. However, it needs to be pointed out that if
the same selection of firms is surveyed in repeated rounds as is customary in BTS, then the sample is
no longer strictly random irrespective of the fact that random sampling was used to construct the
sample at the beginning (OECD, 2003: 21). When the BER recruits new responding units every 2 to 3
years to replace those that have become inactive, invitations are sent to all the contacts on the
purchased address lists that satisfy certain criteria. Given that the probability of selection is therefore
the same for all units during recruitment, the adverse impact of the omission of sample weights on the
accuracy of the results is likely to be smaller. Nevertheless, the quality of the results obtained from a
purposive sample has to be monitored closely to ensure that the selection of firms is unbiased.
      The BER makes use of size weights as recommended by the OECD. Employment is used as
firm weights. The BER distinguishes 9 employment size classes (see Table 1 below). For the
purposes of this study, they had to be reconciled with Stats SA’s 4 turnover size classes so that the
findings of the census about the structure of the population can be applied to the sample. For
instance, Stats SA classifies firms with turnovers of more than R51 million in 2005 as large. The
equivalent size group in the case of the BER are firms with more than 100 employees.

     Table 1        Size classes and firm weights


                             BER                                                  Stats SA

    Size class            Number of             Firm weight         Equivalent size      Turnover in Rm
                          employees                                     class                in 2005
         1                   1 – 19                     1                Micro                  <5
         2                   20 – 49                    4                Small                5 – 13
         3                   50 – 99                 10                 Medium                13 – 51
         4                 100 – 199                 19
         5                 200 – 299                 34
         6                 300 – 399                 48
                                                                         Large                 > 51
         7                 400 – 499                 62
         8                 500 – 999                 94
         9                   1 000+                  286


     The BER uses the 3-digit SIC (Standard Industrial Classification) codes to distinguish 19 sectors
(see Table 3 in the Appendix). The petroleum sector is not covered. The leather, footwear and rubber
sectors are included in the total, but their results are not published. Employment is also used as sector
weights. The sector weights were last updated in 1996.
    The sector weights were changed to the percentages of domestic sales volumes in this study,
because domestic sales were selected as reference series to monitor the quality of the survey results.
      Various data sources were accessed to calculate domestic sales volumes. Stats SA publishes
monthly manufacturing sales and production statistics. The manufacturing sales figures are available
as actual and seasonally adjusted current price values per sector. The statistics on manufacturing
production volumes are published in index form. Stats SA also publishes a monthly producer price
index (PPI) for domestic output and export commodities. The South African Revenue Service (SARS)
publishes export data per HS (harmonized system) category. Fortunately Quantec Research South
Africa publishes the same data also per SIC category.


                                                    5
The impact of weight adjustment on the accuracy of business tendency surveys


      Domestic sales volumes were calculated as the difference between total and export sales and
deflated by the relevant PPI for domestic output.
      The sector weights reflecting domestic sales volumes differ from those based on employment
(see Table 3 in the Appendix). Some sectors (such as food, beverages, paper and transport
equipment) are responsible for a bigger share of total sales than for employment. For example,
transport equipment represents 18% of domestic sales volumes compared to 7% of employment.
Other sectors (such as textiles, clothing, footwear, non-metal mineral products and metal products) in
turn account for a bigger share of employment than for sales.
      Stats SA (2005: 19-25) publishes information on income per sector and firm size class, but not
for sales. For instance, large meat producers generated 82% of the income created by all meat
producers in 2005. In contrast, large plastic producers accounted for only 58%. In this study, it is
assumed that sales are distributed identical to income across firm size classes and that the distribution
remained stable over the period under review (2001 – 2009). It is reasonable to use income as a proxy
for sales given that sales make up the largest share of turnover by far1.

         Table 2         Example of how weights are employed to calculate the survey results


    Respondents per           Size      Firm      Sector       Combi                  Response
    sector                    class    weight     weight        ned
                                           1
                                                               weight     Up       Same      Down       Total

    Meat
    A. Small                    2          4       0.051       0.204    0.204
    B. Medium                   3         10       0.051       0.510               0.510
    C. Large                    6         48       0.051       2.448               2.448
    D. Large                    8         94       0.051       4.794                          4.794
    Sector: Sum of weights                                              0.204      2.958      4.794     7.956
    Sector: Percentage                                                    3          37        60        100
    Motor vehicles
    E. Medium                   3         10       0.106       1.060    1.060
    F. Large                    8         94       0.106       9.964    9.964
    G. Large                    8         94       0.106       9.964                          9.964
    Sector: Sum of weights                                              11.024     0.000      9.964     20.988
    Sector: Percentage                                                    53         0         47        100
    Total
    Total: Sum of weights                                               11.228     2.958     14.758     28.944
    Total: Percentage                                                     39         10        51        100
    1   See Table 1.


      An example of how the BER calculates the results in practice is provided in Table 2 above. The
value of 0.204 attached to the “up” response of a small meat producer (identified as respondent “A”) is
calculated as the product of the firm weight (4) and the sector weight (0.051). The BER calculates the
results per sector as the sum of the weights per variable and per sector. In the example above, the
results for the meat sector are calculated by first computing the sums of the weights of the “up” (0.204
in the example above), “same” (2.958), “down” (4.794) and all responses (7.956). In a second step,

1
         Definitions for sales and turnover are provided in the glossary of Stats SA’s monthly manufacturing data
         releases.


                                                           6
The impact of weight adjustment on the accuracy of business tendency surveys


these totals are transformed to percentages, namely 3% (0.204 / 7.956 * 100) “up”, 37% “same” and
60% “down”. In the final step, the net balance (+57) is calculated as the percentage “up” (60%) less
the percentage “down” (3%). The results for the total are calculated in the same manner. The sums of
weights of all the “up”, “same” and “down” responses are calculated in a first step. These are then
expressed as percentages in a second step. The net balance is calculated in the final step.

Changes in the number and composition of responses

      An analysis of the representativeness of a sample is of little value if the response rate is low,
because then the characteristics of the reporting units are likely to differ from those of the sample
units. In such a case, it is more useful to study the representativeness of the actual responses. From
time to time it is necessary to examine the impact of changes in the number and composition of
responses on the reliability of the survey results. It is also necessary to find out if non-responses are
causing a bias that needs to be corrected.
      The number of responses to the BER’s manufacturing survey varies from one quarter to the next.
Not everybody participating in a particular survey has necessarily participated in the previous one or
will participate in the next one. Currently the BER does not allow for questionnaires reaching it after
the date of return by subsequently revising the initially published results. An analysis of the number of
responses included in the published results, therefore, underestimates the actual response rate. In
addition, the BER currently does not take any additional steps (such as imputation or weight
adjustment) to account for missing data other than following up all unit non-responses once before the
date of return. It is implicitly assumed that the characteristics and responses of those that did not
respond are identical to those that did respond.

        Figure 1        Number of responses per size class, quarterly average

  400


  350


  300


  250


  200
                                                                                          Sector Total - Large


  150                                                                                     Sector Total - Small
                                                                                          (<100)


  100


   50


    0
           2001       2002    2003    2004     2005    2006    2007     2008    2009


                                                       7
The impact of weight adjustment on the accuracy of business tendency surveys


     The number of responses increased from an average of 250 per quarter in 2001 to 350 in 2002
due to the recruitment of new responding units to replace inactive ones (see Figure 1). Bar 2005, 2008
and 2009 when recruitment also took place, the number of actual responses drifted steadily
downwards to an average of 220 per quarter in 2009.
       The composition of responses is also of interest, because changes in the number of large firms
in important sectors, in particular, could have a big impact on representativeness. The increase in the
total number of responses between 2001 and 2005 can be attributed to a rise in the number of small
(i.e. firms with less than 100 employees) responding units (see Table 4 in the Appendix). However,
both the number of small and large responding units declined between 2005 and 2009. The textiles,
clothing, paper and transport equipment sectors registered particularly large declines.
     Weighting is supposed to rectify deficiencies in the representativeness of the sample or the
actual responses when the response rate is low. To establish if this happens in the case of the BER’s
surveys, the sector shares of the BER’s surveys are compared to a benchmark.
     To conduct the comparison, the sum of weights per sector first has to be expressed as a
percentage of the total. In the example provided earlier of how the survey results are calculated (see
Table 2), the sum of the weights of the meat sector makes up 27% (7.956 / 28.944 *100) of the total.
The share of transport equipment (73%) can be calculated in the same manner. The selected
benchmark is the composition of domestic sales volumes per sector.
       The analysis reveals that the sector composition of the BER’s surveys not only deviate
noticeably from those of Stats SA, but also fluctuate significantly more from one year to the next. The
relative shares of the beverage, paper, printing, plastics, machinery, transport equipment, furniture
and other goods sectors are too low (see Table 5 in the Appendix). In contrast, the relative shares of
the textiles, clothing, non-metal mineral products and metal products sectors are too high.
Furthermore, the relative shares of the clothing, transport equipment and machinery sectors do not
respectively decline, increase and decline over the period 2001 to 2009 in the case of the BER’s
surveys as in the case of the benchmark.
      The fluctuations in the sector ratios of the BER’s surveys can partly be attributed to the non-
treatment of missing data. Returning once more to the example provided earlier (see Table 2), if the
respondent marked “D” (i.e. a large meat producer) fails to respond during a particular quarter, then
the sum of weights of the meat sector declines from 7.956 to 3.162 and that of all sectors from 28.944
to 24.150. As a result, the relative share of the meat sector declines from 27% to 13% (3.162 / 24.15
*100).
     Fixed weights, therefore, do not compensate sufficiently for shortcomings / weaknesses in the
representativeness of the responses to the BER’s surveys.

Do weight adjustments improve accuracy?

      One way of aligning the composition of the sum of weights and that of the population (in practice
represented by the reference series) is to adjust the weights of all the responses ex post. The
combined weight of each response is thus calculated as a firm weight multiplied by a sector weight
multiplied by an adjustment. The adjustment can only be done ex post, i.e. when all the available
responses can be assessed and before the results are processed for the first time. The purpose of the
adjustment is to rectify deviations (over and under representation) between the structure of the
responses and that of the population. Non-responses (missing data) are in effect treated by increasing
the weights of those that responded. Instead of applying permanent / fixed weights between
consecutive quarters, this method requires that each respondent has a unique weight every quarter.
This unique weight depends on how many units per sector and size class respond during a particular
quarter.


                                                  8
The impact of weight adjustment on the accuracy of business tendency surveys


     Returning to the example of how the BER computes the survey results (see Table 2), if the
benchmark indicates that the share of the meat sector is actually 35% and not 27% (i.e. meat
producers are underrepresented in the survey), then an adjustment will consist of multiplying the
weights of all meat producing respondents by 1.42 (= 11.3012 / 7.956) to align the sector shares of the
surveys with those of the benchmark. Likewise, the missing response of respondent “D” can be
handled by multiplying the weights of the remaining respondents “A”, “B” and “C” by 2.5 (7.956 /
3.162) to restore the sum of weights of the meat sector to 7.956 and its share to 27%.
      The ultimate goal of this study is to find out if such weight adjustments improve the accuracy of
the BTS results. In order to do this, the BER’s survey results over the period 2001 to 2009 were
recalculated after adjusting all weights in such a manner that the sector and size structure of the
survey results agree with that of the reference series, namely domestic sales volumes. The 343
quarterly surveys produced 12 952 responses. These responses were adjusted so that the structure of
every quarter agrees with that of the benchmark classified according to 38 sectors4 and 4 size
classes5. The compositions of the sum of weights per sector and per quarter before and after the
adjustment are shown in Figure 2 and Figure 3.

      Figure 2        The sector composition of the survey data without weight adjustment

    100%

                                                                                                    Not publ -
    90%
                                                                                                    Transp equip -

    80%                                                                                             Elec machin -
                                                                                                    Machinery -
    70%                                                                                             Metal products -
                                                                                                    Basic metals -
    60%
                                                                                                    Non-metal min -

    50%                                                                                             Chemicals -
                                                                                                    Wood -
    40%                                                                                             Clothing -
                                                                                                    Textiles -
    30%
                                                                                                    Beverages -

    20%                                                                                             Food -
                                                                                                    Plastics -
    10%                                                                                             Printing -
                                                                                                    Paper -
     0%
                                                                                                    Furn & other -
           04q3


           05Q3


           08q2
           01Q2
           01Q3
           01Q4
           02Q1
           02Q2
           02Q3
           02Q4
           03Q1
           03Q2
           03Q3
           03Q4
           04Q1
           04Q2

           04Q4
           05Q1
           05Q2

           06Q1
           06Q2
           06Q3
           06Q4
           07Q1
           07Q2
           07Q3
           07Q4
           08Q1

           08Q3
           08Q4
           09Q1
           09Q2
           09Q3
           09Q4


2
      If the share of the meat sector is increased from 27% to 35%, then the share of the motor vehicle sector declines
      from 73% to 65%. The sum of weights of the total must be 32.289 (= 20.988 / 0.65) for the share of motor
      vehicles to be 65%. The sum of weights of the meat sector is then 11.301 (= 0.35 * 32.289).
3
      No data was available for the first quarter of 2001 and fourth quarter of 2005.
4
      The sectors agree with the 3-digit SIC code level in Table 3 except for a few cases where sectors were
      combined.
5
      See Table 1.


                                                            9
The impact of weight adjustment on the accuracy of business tendency surveys


      Figure 3       The sector composition of the survey data with weight adjustment

    100%

                                                                                         Not publ -
    90%
                                                                                         Transp equip -

    80%                                                                                  Elec machin -
                                                                                         Machinery -
    70%                                                                                  Metal prod -
                                                                                         Basic metals -
    60%
                                                                                         Non-metal min -

    50%                                                                                  Chemicals -
                                                                                         Wood -
    40%                                                                                  Clothing -
                                                                                         Textiles -
    30%
                                                                                         Beverages -

    20%                                                                                  Food -
                                                                                         Plastics -
    10%                                                                                  Printing -
                                                                                         Paper -
     0%
                                                                                         Furn & other -
           02Q3


           05Q1
           01Q2
           01Q3
           01Q4
           02Q1
           02Q2

           02Q4
           03Q1
           03Q2
           03Q3
           03Q4
           04Q1
           04Q2

           04Q4

           05Q2
           05Q3
           06Q1
           06Q2
           06Q3
           06Q4
           07Q1
           07Q2
           07Q3
           07Q4
           08Q1

           08Q3
           08Q4
           09Q1
           09Q2
           09Q3
           09Q4
           04q3


           08q2


      Figure 2 indicates that the sector shares of the survey results deviate noticeably from those of
the reference series shown in Figure 3 and brought about by the adjustment.
       To assess the impact of weight adjustment on the accuracy of the BTS results, the relationship
between a reference series and the survey results calculated by using only firm and sector weights
(i.e. the method currently employed by the BER) is compared to the one between the same reference
series and the BTS results calculated by also ex post adjusting the weights. In this case accuracy is
not derived from the application of random sampling and weighting, but is inferred from the strength of
the relationship between the BTS results and the reference series. This approach implicitly assumes
that the reference series is accurate. However, one must bear in mind that this is not always the case
in reality. The standard way of determining the strength of the relationship between two properties is to
calculate the correlation coefficient (r). The method that produces the most reliable results is therefore
the one delivering the highest positive correlation coefficient between the survey and quantitative data.
      The survey data is presented in the form of net balances, i.e. the difference between the
percentage “up” and percentage “down” responses. The reference series is taken as the year on year
percentage change in domestic sales volumes6. The quantitative data was transformed in this manner
to make it comparable to the survey data, which stems from the question “Did the volume of domestic
sales increase, remain the same or decrease during the current quarter compared to the same quarter
of a year ago?” Both series were not adjusted for seasonality.
     A visual inspection reveals little difference between the survey results based on the data with
and without weight adjustment (see Figure 4). The correlation between the survey results based on
the adjusted data and the reference series (0.69) is actually lower than the one between the results


6
      See page 6 for how domestic sales volumes were calculated.


                                                       10
The impact of weight adjustment on the accuracy of business tendency surveys


based on the unadjusted data and the reference series (0.75). The survey results and the reference
series must move in opposite directions during fewer quarters for the positive correlation to be higher
(see Figure 5).

     Figure 4                               Domestic sales volumes – BER survey results based on data with and
                                            without weight adjustment

                                           100
                                            80
                Net % = % up less % down


                                            60
                                            40
                                            20
                                             0
                                           -20
                                           -40
                                           -60
                                           -80
                                                  Mar-01


                                                                      Mar-02


                                                                                          Mar-03


                                                                                                             Mar-04


                                                                                                                               Mar-05


                                                                                                                                                 Mar-06


                                                                                                                                                                    Mar-07


                                                                                                                                                                                      Mar-08


                                                                                                                                                                                                        Mar-09
                                                            Sep-01


                                                                                Sep-02


                                                                                                    Sep-03


                                                                                                                      Sep-04


                                                                                                                                        Sep-05


                                                                                                                                                           Sep-06


                                                                                                                                                                             Sep-07


                                                                                                                                                                                               Sep-08


                                                                                                                                                                                                                 Sep-09
                                                   Without weight adjustment (lhs)                                                               With weight adjustment (lhs)


     Figure 5                               Domestic sales volumes – the adjusted survey data compared to the
                                            reference series

                                            100                                                                                                                                                         30
                                             80
              Net % = % up less % down


                                                                                                                                                                                                        20
                                                                                                                                                                                                                   Year on year % change

                                             60
                                             40                                                                                                                                                         10
                                             20
                                              0                                                                                                                                                         0
                                            -20
                                            -40                                                                                                                                                         -10
                                            -60                                                                                                                                                         -20
                                            -80
                                           -100                                                                                                                                                         -30
                                                   Mar-01


                                                                                                                                        Jun-06


                                                                                                                                                                    Mar-08
                                                             Oct-01
                                                                       May-02


                                                                                                                                                 Jan-07


                                                                                                                                                                             Oct-08
                                                                                                                                                                                      May-09
                                                                                                                      Apr-05
                                                                                                                               Nov-05


                                                                                                                                                           Aug-07
                                                                                 Dec-02
                                                                                           Jul-03
                                                                                                    Feb-04
                                                                                                             Sep-04


                                                                                                                                                                                               Dec-09


                                                              With weight adjustment (lhs)                                                                Reference series (rhs)


Conclusion

     The finding that weight adjustment does not improve the accuracy of the BTS results is
comforting in so far as it backs the method applied by the BER to calculate the survey results.
Contrary to expectations, the results are therefore not highly sensitive to weighting and can therefore


                                                                                                                          11
The impact of weight adjustment on the accuracy of business tendency surveys


be regarded as quite robust. This finding stands in contrast to that of the volume of retail sales, where
the same analysis yielded an improvement in accuracy. The correlation between the survey results
and reference series increased from 0.73 to 0.81 when weight adjusted data was used (Kershoff,
2009: 8).
     Donzé et al (2004 : 29) found that three of the six European countries they studied make use of
weight adjustment. They also recommended that “sampling weights should be adjusted by
constructing nonresponse weights to tackle the problem of unit nonresponse” (Donzé et al, 2004: 46).
     Although this study weakens the case for the universal application of weight adjustment, it must
be kept in mind that the findings from a study of one variable of a particular sector of a specific country
over a limited time period cannot be applied unquestioningly to all questions of all sectors in all
countries over all periods.

References
Donzé L, Etter R, Sydow N & O Zellweger. (2004). Study on Sample Design for Industry Surveys. Final
      Report ECFIN/2003/A3-03, November 2004.
Kershoff G. (2009) What impact does the response rate and weighting have on the reliability of South
      Africa’s retail survey? Paper presented at the fourth joint EC-OECD workshop on business and
      consumer opinion surveys held in Brussels, 12-13 October 2009.
OECD (Organisation for Economic Co-operation and Development). (2003). Business Tendency Surveys.
      A Handbook. Paris: OECD.
Potgieter, L.J. du P., R. Nänny and S.J.J. van Zyl. (1997). A Guide to the Fifth Edition of the Industrial
      Classification of all Economic Activities (SIC). Research Report No. 245. Pretoria: Bureau for Market
      Research (BMR).
Stats SA (Statistics South Africa). Manufacturing: Production and Sales. Statistical release P3041.2.
Stats SA (Statistics South Africa).(2005). Manufacturing Industry, 2005. Report no. 30-02-02 (2005)
Stats SA (Statistics South Africa). Producer Price Index (PPI). Statistical release P0142.1


                                                     12
The impact of weight adjustment on the accuracy of business tendency surveys


Appendix

     Table 3           Sector classification and sector weights


 SIC      Description                                          BER sectors            Sector weights, %
codes
                                                                                     Employm    Domestic
                                                                                           1
                                                                                       ent       sales
                                                                                                       2
                                                                                                volume
 301      Meat, fish, fruit, vegetables, oils
 302      Dairy products
                                                                   Food                13.0       15.1
 303      Grain mill products
 304      Other food
 305      Beverages                                             Beverages              2.6         4.7
 311      Spinning, weaving, yarns
                                                                  Textiles             6.3         2.4
 312      Other textiles
 313      Knitted & crocheted articles
                                                                  Clothing             9.7         2.3
314-315   Wearing apparel & articles of fur
                                                                             3
 316      Leather & leather products                              Leather              0.7         0.6
                                                                                 3
 317      Footwear                                              Footwear               2.6         0.4
 321      Sawmilling
                                                                   Wood                3.9         2.3
 322      Wood & wood products
 323      Paper & paper products                                   Paper               3.3         4.6
 324      Publishing
                                                                  Printing             3.5         4.0
325-326   Printing & reproduction of recorded media
                                                                                                       4
331-333   Petroleum                                             Not covered             –          –
 334      Chemical products
                                                                 Chemicals             7.7         8.7
335-336   Other chemical products
                                                                             3
 337      Rubber                                                  Rubber               1.4         1.2
 338      Plastic                                                  Plastic             2.9         3.3
 341      Glass                                                  Non-metal
                                                                                       5.6         3.3
 342      Other non-metallic mineral products                     minerals
 351      Basic iron & steel
                                                                Basic metals           6.9         7.6
 352      Precious & non-ferrous metal products
353-354   Structural metal products
                                                               Metal products          9.1         5.4
 355      Other fabricated metal products
 356      General purpose machinery
                                                                 Machinery             6.0         6.0
 357      Special purpose machinery


                                                      13
The impact of weight adjustment on the accuracy of business tendency surveys


    358     Domestic appliances
    359     Office machinery, computers
    361     Electrical motors, generators, transformers
    362     Electricity distribution apparatus
    363     Insulated wire & cables                                          Electrical
                                                                                                  5.0            4.5
    364     Batteries                                                        machinery
    365     Electric bulbs & tubes
    366     Other electrical equipment
371-373     Radio, TV & communication apparatus
374-376     Medical appliances, photographic equipment, watches
    381     Motor cars
    382     Trailers & bodies for motor vehicles                             Transport
                                                                                                  7.0           18.1
    383     Parts & accessories for motor vehicles                           equipment
384-387     Other transport equipment
    391     Furniture
  392,      Other (incl. tobacco)                                       Furniture & other         3.0            5.3
395, 306
                                         4
            Total excluding petroleum                                                           100.0           100.0
1   Employment according to the 1991 census
2   Domestic sales volume = total less foreign sales, which is then deflated by the relevant PPI for domestic output
3   Not published
4   Petroleum accounted for 5.5% of domestic sales volumes in 2005
                                                                        th
SIC = The Standard Industrial Classification of all Economic Activities, 5 edition. Source of codes and description:
   Potgieter et al, 1997


                                                           14
The impact of weight adjustment on the accuracy of business tendency surveys


Table 4       Number of responses per sector and size class, quarterly average

                                             1               1
                                     Small           Large            Total
          Food
          2001                          8              11              18
          2005                          8              10              18
          2009                          7              10              17
          Beverages
          2001                          1               6               7
          2005                          3               3               6
          2009                          2               5               7
          Textiles
          2001                          3               9              12
          2005                          5               7              12
          2009                          3               3               7
          Clothing
          2001                          7              19              26
          2005                          6              14              20
          2009                          5               6              11
          Wood
          2001                          5               5              10
          2005                          3               6               9
          2009                          4               7              11
          Paper & products
          2001                          3              10              14
          2005                          6              18              24
          2009                          5               8              12
          Printing & publishing
          2001                          4               7              11
          2005                          4               5               9
          2009                          3               4               7
          Chemicals
          2001                          8              13              21
          2005                         11              17              28
          2009                         13              16              29
          Plastics
          2001                          4               7              11
          2005                          6               6              12
          2009                          9              10              19
          Non-metal minerals
          2001                          6              18              23
          2005                          7              19              26
          2009                          6              15              20


                                            15
The impact of weight adjustment on the accuracy of business tendency surveys


                                            1                 1
                                    Small             Large               Total
  Basic metals
  2001                                 2                  7                 9
  2005                                 2                 10                12
  2009                                 3                  7                10
  Metal products
  2001                                 9                 16                25
  2005                                12                 17                29
  2009                                 8                 18                26
  Machinery
  2001                                 3                  7                 9
  2005                                 6                  6                12
  2009                                 4                  9                13
  Electrical machinery
  2001                                 5                  9                13
  2005                                 7                  5                13
  2009                                 4                  5                 9
  Transport equipment
  2001                                 4                 14                18
  2005                                 6                 15                22
  2009                                 2                  6                 8
  Furniture & other
  2001                                 6                  9                15
  2005                                 5                  8                13
  2009                                 5                  4                 9
                  1
  Not published
  2001                                 3                  7                10
  2005                                 6                  6                12
  2009                                 3                  4                 7
  Total
  2001                                81                172                253
  2005                                104               172                276
  2009                                85                135                220
  1   Small refers to all responding units with less than 100 employees. Large
      depicts units with 100 and more employees.


                                            16
The impact of weight adjustment on the accuracy of business tendency surveys


        Table 5         The composition of the survey results vis-à-vis domestic sales volumes,
                        average percentage


                         S/B    2001       2002    2003    2004    2005    2006    2007    2008    2009    Ave
                          S     15.8       14.6    14.7     15.2   15.1    14.7    14.6    15.0    17.6    15.3
Food
                          B     14.9       20.6    17.4     20.5   17.7    15.7    21.2    17.3    18.3    18.2
                          S      4.4        4.1     4.5     4.7     4.8     4.6     4.6     4.7     5.6     4.7
Beverages
                          B      1.8        1.4     1.3     1.2     1.2     1.7     1.1     2.2     1.8     1.5
                          S      2.7        2.7     2.5     2.5     2.4     2.3     2.2     2.1     2.0     2.4
Textiles
                          B      3.3        3.8     4.0     3.5     3.8     4.2     3.4     3.1     2.1     3.5
                          S      2.4        2.2     2.3     2.3     2.3     2.2     2.3     2.4     2.6     2.3
Clothing
                          B     18.1       14.0    14.5     12.5   15.2    12.0    13.2     8.6     7.4    12.8
                          S      1.9        1.9     2.0     2.1     2.3     2.3     2.4     2.3     2.2     2.2
Wood
                          B      1.6        1.9     1.2     2.1     1.9     2.6     1.7     4.1     4.7     2.4
                          S      4.7        4.7     4.8     4.7     4.6     4.6     4.5     4.6     5.0     4.7
Paper &products
                          B      3.2        3.0     3.9     3.9     3.9     3.4     3.9     2.4     2.2     3.3
                          S      4.1        3.8     4.0     3.9     4.0     4.0     3.9     3.7     3.9     3.9
Printing & publishing
                          B      1.6        0.7     1.6     0.6     1.5     2.3     1.3     1.2     1.7     1.4
                          S      9.2        8.9     9.4     8.9     8.7     8.8     9.5     9.8    10.8     9.3
Chemicals
                          B      8.6       10.5    11.0     9.9    10.3     8.9     9.8     8.6    10.4     9.8
                          S      3.2        3.4     3.5     3.4     3.3     3.5     4.0     4.2     5.1     3.7
Plastics
                          B      1.1        1.4     1.3     1.1     1.4     1.3     1.2     1.9     2.8     1.5
                          S      3.3        3.1     3.2     3.2     3.3     3.3     3.2     3.3     3.3     3.2
Non-metal minerals
                          B      6.2        7.3     7.2     8.8     8.1     7.8     7.6    10.4    11.2     8.3
                          S      9.7       10.2     9.3     8.9     7.6     8.3     8.1     7.8     5.4     8.4
Basic metals
                          B      6.5        6.5     6.0     5.0     4.5     6.4     5.8     7.3     6.8     6.1
                          S      5.4        5.7     6.0     5.8     5.4     5.4     5.6     5.8     5.8     5.7
Metal products
                          B      8.5        9.2     8.7     8.2    10.8    15.0    13.8    14.7    14.5    11.5
                          S      5.2        5.9     6.3     6.4     6.0     5.2     4.1     2.7     3.9     5.1
Machinery
                          B      2.7        3.0     3.1     2.8     2.8     2.1     3.0     4.4     7.4     3.5
                          S      5.1        4.8     4.8     4.6     4.5     4.2     3.7     4.1     4.4     4.5
Electrical machinery
                          B      7.4        4.8     5.2     4.7     5.1     6.1     4.7     4.1     2.2     4.9
                          S     15.3       16.5    15.8     16.3   18.1    19.2    20.6    20.2    15.3    17.5
Transport equipment
                          B      9.9        7.7     9.8     12.2    8.6     7.5     5.2     7.2     4.7     8.1
                          S      5.0        5.0     4.5     4.7     5.3     5.2     4.9     5.3     5.1     5.0
Furniture & other
                          B      2.3        1.8     1.8     1.2     1.3     1.3     1.2     1.0     1.1     1.4
                          S      2.6        2.5     2.4     2.4     2.2     2.0     1.9     2.0     2.1     2.2
Not published
                          B      2.2        2.4     2.0     1.8     1.7     1.7     1.8     1.4     0.8     1.8
                          S     100.0      100.0   100.0   100.0   100.0   100.0   100.0   100.0   100.0   100.0
Total
                          B     100.0      100.0   100.0   100.0   100.0   100.0   100.0   100.0   100.0   100.0
S = Domestic sales volume, B = BER surveys
Ave = average for the period 2001 – 2009


                                                           17

An assessment of the the BER's manufacturing survey in South Africa

  • 1.
    30th CIRET Conference,New York, October 2010 The impact of weight adjustment on the accuracy of business tendency surveys An assessment of the manufacturing survey of South Africa George Kershoff * Deputy Director, Bureau for Economic Research (BER), Stellenbosch University Abstract Firm weights are applied to the qualitative responses of participants to calculate business tendency survey (BTS) results. Sector weights are employed to produce higher levels of aggregation. If a comprehensive and current business register is available, sampling weights are utilized to provide for selection probability and significance. What impact does weighting have on the accuracy of the BTS results? If a national business register is unavailable and the response rate is low (i.e. the characteristics of the reporting units are unlikely to be the same as those of the sample units), accuracy is not derived from the application of random sampling and weighting, but is inferred if a close relationship between the survey results and a reference series can be established. To assess the impact of weighting on the accuracy of survey results, the relationship between a reference series and the BTS results calculated by using only firm and sector weights is compared to one between the same reference series and the BTS results calculated by also ex post adjusting the weights. Weight adjustment rectifies deviations (over and under representation) between the structure of the responses and that of the population. Non- responses (missing data) are in effect treated by increasing the weights of those that responded. A visual inspection reveals little difference between the survey results based on the data with and without weight adjustment. The correlation between the survey results based on the adjusted data and the reference series (0.69) is lower than the one between the results based on the unadjusted data and the reference series (0.75). The finding that weight adjustment does not improve the accuracy of the BTS results is comforting in so far as it backs the method applied by the BER to calculate the survey results. Contrary to expectations, the results are therefore not highly sensitive to weighting and can therefore be regarded as quite robust. * BER, Private Bag X5050, Stellenbosch, 7599, South Africa. E-mail: gjkk@sun.ac.za. This paper was finalised on 30 June 2010.
  • 2.
    The impact ofweight adjustment on the accuracy of business tendency surveys Key Words: Manufacturing sector, business tendency survey (BTS) method, weighting, firm weights, sector weights, weight adjustment, South Africa JEL Classification: C42 2
  • 3.
    The impact ofweight adjustment on the accuracy of business tendency surveys Introduction Business tendency surveys (BTS) use questionnaires to collect data from firms. Data on the business performance (such as sales, prices, stocks and employment) is collected. The questionnaires are sent to only a selection of firms from the population or universe. Not all firms in the population are quizzed, because it would be too laborious and / or expensive. The selection of firms is called a sample and is put together in such a way as to represent the structure of the population in the best way possible. The results obtained from surveying a sample is inferred to apply to the whole population. BTS are regarded as longitudinal research as the same phenomenon – the performance of business – is studied over time. The same questionnaire and sample are used between consecutive surveys. Given that the same sample is used, BTS resembles panel research. Tracking the same firms increase accuracy, as it raises the response rate and likelihood that changes in the results can be attributed to actual changes and not to the use of different samples. However, care must be taken that the structure of the panel does not drift away from that of the population, as inferences about the population can in such cases not be made from the results obtained from the panel. The question that immediately follows from this is what impact does the sample design have on the accuracy of BTS results, where accuracy is defined as the closeness between the estimated value and the (unknown) true population value. The sample design consists of various elements, which could all affect accuracy. This paper focuses on only one aspect, namely the impact of the representativeness of the actual responses on the accuracy of the BTS results. Inferences about the population cannot be drawn from the results obtained from a sample if the structure of the responses deviates significantly from that of the population. To narrow it down further, this paper focuses only on the impact of weighting on the accuracy of BTS results. What is weighting? Each sample unit is allocated a weight that reflects its relative importance in the population. Weighting is necessary to make the sample representative of the population. So, the specific question arising from this is: If the response rate is low and the majority of participants do not respond to every survey, what impact does using fixed sample weights in contrast to variable reporting unit weights have on the accuracy of BTS results? (If the response rate is close to 100%, then the sample and reporting units would agree and the sample and reporting unit weights would be the same.) Does adjusting the weights to provide for non-responses and the resultant over and under representation / biases of the actual responses (as opposed to a representative sample) before processing the results of each survey improve accuracy? Furthermore, this study of the impact of weighting on the accuracy of BTS results is limited further to situations where information on the structure of the population is totally unavailable or very limited. If such information is lacking, it is impossible to establish if the structure of the sample reflects that of the population. In such circumstances, stratified random sampling and the estimation of sampling weights are not possible. Purposive (non-probability) sampling can be employed, but then the margins of error of the survey results cannot be estimated and the only way to establish accuracy is to infer it from a close relationship between the survey results and a corresponding benchmark or reference series, assuming that such a series is accurate, i.e. accurately reflect the (unknown) true population value. This study is an instance where the robustness of the BTS results are examined, as a sensitivity analysis is conducted to establish how one element of the survey design – weighting – affects the accuracy of BTS results. Furthermore, by comparing the BTS results to a benchmark, this study is also an example of where the quality of the results is monitored. 3
  • 4.
    The impact ofweight adjustment on the accuracy of business tendency surveys Using weights to calculate the survey results The OECD (Organisation for Economic Co-operation and Development) published a handbook in 2003 to outline the international best practice to conduct BTS. In the handbook, the OECD recommends that sample and size weights be used to process BTS. What are sample weights? Sample weights are the inverse of the probability with which each reporting unit has been selected. The following example is provided in the handbook to explain sample weights: “Suppose, for example, that the target universe has been divided into two groups – large and small reporting units. If all large reporting units are selected for the sample (probability of 1) and if only one in ten are selected from the small reporting units (probability of 0.1), the answers of the reporting units must be multiplied by 1/1 =1 and 1/0.1 =10 respectively. Higher weights are given to the small reporting units because they have to represent all the other small reporting units that were not selected for the sample (OECD, 2003: 36). In practice, sample weights can only be estimated if detailed information on the structure of the population, such as the number of firms per sector and size class, is available. Such information is usually derived from a business register of all the firms of a country. Stratified random sampling cannot be used and the sampling weights per reporting unit cannot be calculated if such a business register is unavailable. What are size weights? Given that not the whole population, but only a selection of firms is surveyed, each reporting unit is multiplied by a size weight reflecting its relative importance in the population. Size weights, therefore, raise the results originating from a sample to that of the population. Two types of size weights are distinguished, namely firm and sector weights. Firm weights are used to calculate BTS results, because it is assumed that the answers of large firms carry more weight than those of small firms. Firm weights “are not generally required in processing answers to quantitative questions because the answers already reflect the size of the reporting unit. Data reported on the value of sales, tons of output, numbers employed, etc. will be in larger values, volumes or numbers for large firms than for small ones” (OECD, 2003: 37). Number of employees and turnover are typically used as firm weights. Sector weights are used to aggregate the results to higher levels, such as from meat producers to all food producers and finally to all manufacturers. Variables, such as value added, income, sales and production, can be used as sector weights. The choice depends on the availability of data and the preferred reference series. For instance, value added can be used as sector weights if the survey results are to closely reflect the movements in GDP. If a breakdown of value added is unavailable, then sales, for example, can be used. The BTS results have in practice turned out to be not extremely sensitive to the choice of the weighting variable (OECD, 2003:37). The OECD recommends that the results per sector (e.g. food, beverages and clothing) be calculated in practice as the sum of the weights per question / variable. The weights, in turn, should be computed as the responses (i.e. up, same or down) times the sample weights times the firm weights. The total / aggregate is to be calculated as the sum of the weights per sector (calculated as the responses multiplied by their sample weights) times their respective sector weights. The difference between calculating the results per sector and the total is that firm weights are not used in the latter instance (OECD, 2003: 37-47). The biggest difference between the method that the BER applies to calculate the survey results and the one recommended by the OECD is that the BER does not make use of sample weights. The reason why sample weights are not employed is that they cannot be estimated without access to the national business register. Statistics South Africa (Stats SA, 2005) has published the findings of a census of the manufacturing sector and publishes the total number of firms in the universe in its monthly manufacturing production and sales statistical releases, but not a detailed breakdown of the number of firms per sector and size class contained in the business register. 4
  • 5.
    The impact ofweight adjustment on the accuracy of business tendency surveys The BER cannot employ stratified random sampling to put together and maintain a panel as recommended by the OECD due to the unavailability of the national business register. Instead, the BER makes use of purposive (non-probability) sampling. However, it needs to be pointed out that if the same selection of firms is surveyed in repeated rounds as is customary in BTS, then the sample is no longer strictly random irrespective of the fact that random sampling was used to construct the sample at the beginning (OECD, 2003: 21). When the BER recruits new responding units every 2 to 3 years to replace those that have become inactive, invitations are sent to all the contacts on the purchased address lists that satisfy certain criteria. Given that the probability of selection is therefore the same for all units during recruitment, the adverse impact of the omission of sample weights on the accuracy of the results is likely to be smaller. Nevertheless, the quality of the results obtained from a purposive sample has to be monitored closely to ensure that the selection of firms is unbiased. The BER makes use of size weights as recommended by the OECD. Employment is used as firm weights. The BER distinguishes 9 employment size classes (see Table 1 below). For the purposes of this study, they had to be reconciled with Stats SA’s 4 turnover size classes so that the findings of the census about the structure of the population can be applied to the sample. For instance, Stats SA classifies firms with turnovers of more than R51 million in 2005 as large. The equivalent size group in the case of the BER are firms with more than 100 employees. Table 1 Size classes and firm weights BER Stats SA Size class Number of Firm weight Equivalent size Turnover in Rm employees class in 2005 1 1 – 19 1 Micro <5 2 20 – 49 4 Small 5 – 13 3 50 – 99 10 Medium 13 – 51 4 100 – 199 19 5 200 – 299 34 6 300 – 399 48 Large > 51 7 400 – 499 62 8 500 – 999 94 9 1 000+ 286 The BER uses the 3-digit SIC (Standard Industrial Classification) codes to distinguish 19 sectors (see Table 3 in the Appendix). The petroleum sector is not covered. The leather, footwear and rubber sectors are included in the total, but their results are not published. Employment is also used as sector weights. The sector weights were last updated in 1996. The sector weights were changed to the percentages of domestic sales volumes in this study, because domestic sales were selected as reference series to monitor the quality of the survey results. Various data sources were accessed to calculate domestic sales volumes. Stats SA publishes monthly manufacturing sales and production statistics. The manufacturing sales figures are available as actual and seasonally adjusted current price values per sector. The statistics on manufacturing production volumes are published in index form. Stats SA also publishes a monthly producer price index (PPI) for domestic output and export commodities. The South African Revenue Service (SARS) publishes export data per HS (harmonized system) category. Fortunately Quantec Research South Africa publishes the same data also per SIC category. 5
  • 6.
    The impact ofweight adjustment on the accuracy of business tendency surveys Domestic sales volumes were calculated as the difference between total and export sales and deflated by the relevant PPI for domestic output. The sector weights reflecting domestic sales volumes differ from those based on employment (see Table 3 in the Appendix). Some sectors (such as food, beverages, paper and transport equipment) are responsible for a bigger share of total sales than for employment. For example, transport equipment represents 18% of domestic sales volumes compared to 7% of employment. Other sectors (such as textiles, clothing, footwear, non-metal mineral products and metal products) in turn account for a bigger share of employment than for sales. Stats SA (2005: 19-25) publishes information on income per sector and firm size class, but not for sales. For instance, large meat producers generated 82% of the income created by all meat producers in 2005. In contrast, large plastic producers accounted for only 58%. In this study, it is assumed that sales are distributed identical to income across firm size classes and that the distribution remained stable over the period under review (2001 – 2009). It is reasonable to use income as a proxy for sales given that sales make up the largest share of turnover by far1. Table 2 Example of how weights are employed to calculate the survey results Respondents per Size Firm Sector Combi Response sector class weight weight ned 1 weight Up Same Down Total Meat A. Small 2 4 0.051 0.204 0.204 B. Medium 3 10 0.051 0.510 0.510 C. Large 6 48 0.051 2.448 2.448 D. Large 8 94 0.051 4.794 4.794 Sector: Sum of weights 0.204 2.958 4.794 7.956 Sector: Percentage 3 37 60 100 Motor vehicles E. Medium 3 10 0.106 1.060 1.060 F. Large 8 94 0.106 9.964 9.964 G. Large 8 94 0.106 9.964 9.964 Sector: Sum of weights 11.024 0.000 9.964 20.988 Sector: Percentage 53 0 47 100 Total Total: Sum of weights 11.228 2.958 14.758 28.944 Total: Percentage 39 10 51 100 1 See Table 1. An example of how the BER calculates the results in practice is provided in Table 2 above. The value of 0.204 attached to the “up” response of a small meat producer (identified as respondent “A”) is calculated as the product of the firm weight (4) and the sector weight (0.051). The BER calculates the results per sector as the sum of the weights per variable and per sector. In the example above, the results for the meat sector are calculated by first computing the sums of the weights of the “up” (0.204 in the example above), “same” (2.958), “down” (4.794) and all responses (7.956). In a second step, 1 Definitions for sales and turnover are provided in the glossary of Stats SA’s monthly manufacturing data releases. 6
  • 7.
    The impact ofweight adjustment on the accuracy of business tendency surveys these totals are transformed to percentages, namely 3% (0.204 / 7.956 * 100) “up”, 37% “same” and 60% “down”. In the final step, the net balance (+57) is calculated as the percentage “up” (60%) less the percentage “down” (3%). The results for the total are calculated in the same manner. The sums of weights of all the “up”, “same” and “down” responses are calculated in a first step. These are then expressed as percentages in a second step. The net balance is calculated in the final step. Changes in the number and composition of responses An analysis of the representativeness of a sample is of little value if the response rate is low, because then the characteristics of the reporting units are likely to differ from those of the sample units. In such a case, it is more useful to study the representativeness of the actual responses. From time to time it is necessary to examine the impact of changes in the number and composition of responses on the reliability of the survey results. It is also necessary to find out if non-responses are causing a bias that needs to be corrected. The number of responses to the BER’s manufacturing survey varies from one quarter to the next. Not everybody participating in a particular survey has necessarily participated in the previous one or will participate in the next one. Currently the BER does not allow for questionnaires reaching it after the date of return by subsequently revising the initially published results. An analysis of the number of responses included in the published results, therefore, underestimates the actual response rate. In addition, the BER currently does not take any additional steps (such as imputation or weight adjustment) to account for missing data other than following up all unit non-responses once before the date of return. It is implicitly assumed that the characteristics and responses of those that did not respond are identical to those that did respond. Figure 1 Number of responses per size class, quarterly average 400 350 300 250 200 Sector Total - Large 150 Sector Total - Small (<100) 100 50 0 2001 2002 2003 2004 2005 2006 2007 2008 2009 7
  • 8.
    The impact ofweight adjustment on the accuracy of business tendency surveys The number of responses increased from an average of 250 per quarter in 2001 to 350 in 2002 due to the recruitment of new responding units to replace inactive ones (see Figure 1). Bar 2005, 2008 and 2009 when recruitment also took place, the number of actual responses drifted steadily downwards to an average of 220 per quarter in 2009. The composition of responses is also of interest, because changes in the number of large firms in important sectors, in particular, could have a big impact on representativeness. The increase in the total number of responses between 2001 and 2005 can be attributed to a rise in the number of small (i.e. firms with less than 100 employees) responding units (see Table 4 in the Appendix). However, both the number of small and large responding units declined between 2005 and 2009. The textiles, clothing, paper and transport equipment sectors registered particularly large declines. Weighting is supposed to rectify deficiencies in the representativeness of the sample or the actual responses when the response rate is low. To establish if this happens in the case of the BER’s surveys, the sector shares of the BER’s surveys are compared to a benchmark. To conduct the comparison, the sum of weights per sector first has to be expressed as a percentage of the total. In the example provided earlier of how the survey results are calculated (see Table 2), the sum of the weights of the meat sector makes up 27% (7.956 / 28.944 *100) of the total. The share of transport equipment (73%) can be calculated in the same manner. The selected benchmark is the composition of domestic sales volumes per sector. The analysis reveals that the sector composition of the BER’s surveys not only deviate noticeably from those of Stats SA, but also fluctuate significantly more from one year to the next. The relative shares of the beverage, paper, printing, plastics, machinery, transport equipment, furniture and other goods sectors are too low (see Table 5 in the Appendix). In contrast, the relative shares of the textiles, clothing, non-metal mineral products and metal products sectors are too high. Furthermore, the relative shares of the clothing, transport equipment and machinery sectors do not respectively decline, increase and decline over the period 2001 to 2009 in the case of the BER’s surveys as in the case of the benchmark. The fluctuations in the sector ratios of the BER’s surveys can partly be attributed to the non- treatment of missing data. Returning once more to the example provided earlier (see Table 2), if the respondent marked “D” (i.e. a large meat producer) fails to respond during a particular quarter, then the sum of weights of the meat sector declines from 7.956 to 3.162 and that of all sectors from 28.944 to 24.150. As a result, the relative share of the meat sector declines from 27% to 13% (3.162 / 24.15 *100). Fixed weights, therefore, do not compensate sufficiently for shortcomings / weaknesses in the representativeness of the responses to the BER’s surveys. Do weight adjustments improve accuracy? One way of aligning the composition of the sum of weights and that of the population (in practice represented by the reference series) is to adjust the weights of all the responses ex post. The combined weight of each response is thus calculated as a firm weight multiplied by a sector weight multiplied by an adjustment. The adjustment can only be done ex post, i.e. when all the available responses can be assessed and before the results are processed for the first time. The purpose of the adjustment is to rectify deviations (over and under representation) between the structure of the responses and that of the population. Non-responses (missing data) are in effect treated by increasing the weights of those that responded. Instead of applying permanent / fixed weights between consecutive quarters, this method requires that each respondent has a unique weight every quarter. This unique weight depends on how many units per sector and size class respond during a particular quarter. 8
  • 9.
    The impact ofweight adjustment on the accuracy of business tendency surveys Returning to the example of how the BER computes the survey results (see Table 2), if the benchmark indicates that the share of the meat sector is actually 35% and not 27% (i.e. meat producers are underrepresented in the survey), then an adjustment will consist of multiplying the weights of all meat producing respondents by 1.42 (= 11.3012 / 7.956) to align the sector shares of the surveys with those of the benchmark. Likewise, the missing response of respondent “D” can be handled by multiplying the weights of the remaining respondents “A”, “B” and “C” by 2.5 (7.956 / 3.162) to restore the sum of weights of the meat sector to 7.956 and its share to 27%. The ultimate goal of this study is to find out if such weight adjustments improve the accuracy of the BTS results. In order to do this, the BER’s survey results over the period 2001 to 2009 were recalculated after adjusting all weights in such a manner that the sector and size structure of the survey results agree with that of the reference series, namely domestic sales volumes. The 343 quarterly surveys produced 12 952 responses. These responses were adjusted so that the structure of every quarter agrees with that of the benchmark classified according to 38 sectors4 and 4 size classes5. The compositions of the sum of weights per sector and per quarter before and after the adjustment are shown in Figure 2 and Figure 3. Figure 2 The sector composition of the survey data without weight adjustment 100% Not publ - 90% Transp equip - 80% Elec machin - Machinery - 70% Metal products - Basic metals - 60% Non-metal min - 50% Chemicals - Wood - 40% Clothing - Textiles - 30% Beverages - 20% Food - Plastics - 10% Printing - Paper - 0% Furn & other - 04q3 05Q3 08q2 01Q2 01Q3 01Q4 02Q1 02Q2 02Q3 02Q4 03Q1 03Q2 03Q3 03Q4 04Q1 04Q2 04Q4 05Q1 05Q2 06Q1 06Q2 06Q3 06Q4 07Q1 07Q2 07Q3 07Q4 08Q1 08Q3 08Q4 09Q1 09Q2 09Q3 09Q4 2 If the share of the meat sector is increased from 27% to 35%, then the share of the motor vehicle sector declines from 73% to 65%. The sum of weights of the total must be 32.289 (= 20.988 / 0.65) for the share of motor vehicles to be 65%. The sum of weights of the meat sector is then 11.301 (= 0.35 * 32.289). 3 No data was available for the first quarter of 2001 and fourth quarter of 2005. 4 The sectors agree with the 3-digit SIC code level in Table 3 except for a few cases where sectors were combined. 5 See Table 1. 9
  • 10.
    The impact ofweight adjustment on the accuracy of business tendency surveys Figure 3 The sector composition of the survey data with weight adjustment 100% Not publ - 90% Transp equip - 80% Elec machin - Machinery - 70% Metal prod - Basic metals - 60% Non-metal min - 50% Chemicals - Wood - 40% Clothing - Textiles - 30% Beverages - 20% Food - Plastics - 10% Printing - Paper - 0% Furn & other - 02Q3 05Q1 01Q2 01Q3 01Q4 02Q1 02Q2 02Q4 03Q1 03Q2 03Q3 03Q4 04Q1 04Q2 04Q4 05Q2 05Q3 06Q1 06Q2 06Q3 06Q4 07Q1 07Q2 07Q3 07Q4 08Q1 08Q3 08Q4 09Q1 09Q2 09Q3 09Q4 04q3 08q2 Figure 2 indicates that the sector shares of the survey results deviate noticeably from those of the reference series shown in Figure 3 and brought about by the adjustment. To assess the impact of weight adjustment on the accuracy of the BTS results, the relationship between a reference series and the survey results calculated by using only firm and sector weights (i.e. the method currently employed by the BER) is compared to the one between the same reference series and the BTS results calculated by also ex post adjusting the weights. In this case accuracy is not derived from the application of random sampling and weighting, but is inferred from the strength of the relationship between the BTS results and the reference series. This approach implicitly assumes that the reference series is accurate. However, one must bear in mind that this is not always the case in reality. The standard way of determining the strength of the relationship between two properties is to calculate the correlation coefficient (r). The method that produces the most reliable results is therefore the one delivering the highest positive correlation coefficient between the survey and quantitative data. The survey data is presented in the form of net balances, i.e. the difference between the percentage “up” and percentage “down” responses. The reference series is taken as the year on year percentage change in domestic sales volumes6. The quantitative data was transformed in this manner to make it comparable to the survey data, which stems from the question “Did the volume of domestic sales increase, remain the same or decrease during the current quarter compared to the same quarter of a year ago?” Both series were not adjusted for seasonality. A visual inspection reveals little difference between the survey results based on the data with and without weight adjustment (see Figure 4). The correlation between the survey results based on the adjusted data and the reference series (0.69) is actually lower than the one between the results 6 See page 6 for how domestic sales volumes were calculated. 10
  • 11.
    The impact ofweight adjustment on the accuracy of business tendency surveys based on the unadjusted data and the reference series (0.75). The survey results and the reference series must move in opposite directions during fewer quarters for the positive correlation to be higher (see Figure 5). Figure 4 Domestic sales volumes – BER survey results based on data with and without weight adjustment 100 80 Net % = % up less % down 60 40 20 0 -20 -40 -60 -80 Mar-01 Mar-02 Mar-03 Mar-04 Mar-05 Mar-06 Mar-07 Mar-08 Mar-09 Sep-01 Sep-02 Sep-03 Sep-04 Sep-05 Sep-06 Sep-07 Sep-08 Sep-09 Without weight adjustment (lhs) With weight adjustment (lhs) Figure 5 Domestic sales volumes – the adjusted survey data compared to the reference series 100 30 80 Net % = % up less % down 20 Year on year % change 60 40 10 20 0 0 -20 -40 -10 -60 -20 -80 -100 -30 Mar-01 Jun-06 Mar-08 Oct-01 May-02 Jan-07 Oct-08 May-09 Apr-05 Nov-05 Aug-07 Dec-02 Jul-03 Feb-04 Sep-04 Dec-09 With weight adjustment (lhs) Reference series (rhs) Conclusion The finding that weight adjustment does not improve the accuracy of the BTS results is comforting in so far as it backs the method applied by the BER to calculate the survey results. Contrary to expectations, the results are therefore not highly sensitive to weighting and can therefore 11
  • 12.
    The impact ofweight adjustment on the accuracy of business tendency surveys be regarded as quite robust. This finding stands in contrast to that of the volume of retail sales, where the same analysis yielded an improvement in accuracy. The correlation between the survey results and reference series increased from 0.73 to 0.81 when weight adjusted data was used (Kershoff, 2009: 8). Donzé et al (2004 : 29) found that three of the six European countries they studied make use of weight adjustment. They also recommended that “sampling weights should be adjusted by constructing nonresponse weights to tackle the problem of unit nonresponse” (Donzé et al, 2004: 46). Although this study weakens the case for the universal application of weight adjustment, it must be kept in mind that the findings from a study of one variable of a particular sector of a specific country over a limited time period cannot be applied unquestioningly to all questions of all sectors in all countries over all periods. References Donzé L, Etter R, Sydow N & O Zellweger. (2004). Study on Sample Design for Industry Surveys. Final Report ECFIN/2003/A3-03, November 2004. Kershoff G. (2009) What impact does the response rate and weighting have on the reliability of South Africa’s retail survey? Paper presented at the fourth joint EC-OECD workshop on business and consumer opinion surveys held in Brussels, 12-13 October 2009. OECD (Organisation for Economic Co-operation and Development). (2003). Business Tendency Surveys. A Handbook. Paris: OECD. Potgieter, L.J. du P., R. Nänny and S.J.J. van Zyl. (1997). A Guide to the Fifth Edition of the Industrial Classification of all Economic Activities (SIC). Research Report No. 245. Pretoria: Bureau for Market Research (BMR). Stats SA (Statistics South Africa). Manufacturing: Production and Sales. Statistical release P3041.2. Stats SA (Statistics South Africa).(2005). Manufacturing Industry, 2005. Report no. 30-02-02 (2005) Stats SA (Statistics South Africa). Producer Price Index (PPI). Statistical release P0142.1 12
  • 13.
    The impact ofweight adjustment on the accuracy of business tendency surveys Appendix Table 3 Sector classification and sector weights SIC Description BER sectors Sector weights, % codes Employm Domestic 1 ent sales 2 volume 301 Meat, fish, fruit, vegetables, oils 302 Dairy products Food 13.0 15.1 303 Grain mill products 304 Other food 305 Beverages Beverages 2.6 4.7 311 Spinning, weaving, yarns Textiles 6.3 2.4 312 Other textiles 313 Knitted & crocheted articles Clothing 9.7 2.3 314-315 Wearing apparel & articles of fur 3 316 Leather & leather products Leather 0.7 0.6 3 317 Footwear Footwear 2.6 0.4 321 Sawmilling Wood 3.9 2.3 322 Wood & wood products 323 Paper & paper products Paper 3.3 4.6 324 Publishing Printing 3.5 4.0 325-326 Printing & reproduction of recorded media 4 331-333 Petroleum Not covered – – 334 Chemical products Chemicals 7.7 8.7 335-336 Other chemical products 3 337 Rubber Rubber 1.4 1.2 338 Plastic Plastic 2.9 3.3 341 Glass Non-metal 5.6 3.3 342 Other non-metallic mineral products minerals 351 Basic iron & steel Basic metals 6.9 7.6 352 Precious & non-ferrous metal products 353-354 Structural metal products Metal products 9.1 5.4 355 Other fabricated metal products 356 General purpose machinery Machinery 6.0 6.0 357 Special purpose machinery 13
  • 14.
    The impact ofweight adjustment on the accuracy of business tendency surveys 358 Domestic appliances 359 Office machinery, computers 361 Electrical motors, generators, transformers 362 Electricity distribution apparatus 363 Insulated wire & cables Electrical 5.0 4.5 364 Batteries machinery 365 Electric bulbs & tubes 366 Other electrical equipment 371-373 Radio, TV & communication apparatus 374-376 Medical appliances, photographic equipment, watches 381 Motor cars 382 Trailers & bodies for motor vehicles Transport 7.0 18.1 383 Parts & accessories for motor vehicles equipment 384-387 Other transport equipment 391 Furniture 392, Other (incl. tobacco) Furniture & other 3.0 5.3 395, 306 4 Total excluding petroleum 100.0 100.0 1 Employment according to the 1991 census 2 Domestic sales volume = total less foreign sales, which is then deflated by the relevant PPI for domestic output 3 Not published 4 Petroleum accounted for 5.5% of domestic sales volumes in 2005 th SIC = The Standard Industrial Classification of all Economic Activities, 5 edition. Source of codes and description: Potgieter et al, 1997 14
  • 15.
    The impact ofweight adjustment on the accuracy of business tendency surveys Table 4 Number of responses per sector and size class, quarterly average 1 1 Small Large Total Food 2001 8 11 18 2005 8 10 18 2009 7 10 17 Beverages 2001 1 6 7 2005 3 3 6 2009 2 5 7 Textiles 2001 3 9 12 2005 5 7 12 2009 3 3 7 Clothing 2001 7 19 26 2005 6 14 20 2009 5 6 11 Wood 2001 5 5 10 2005 3 6 9 2009 4 7 11 Paper & products 2001 3 10 14 2005 6 18 24 2009 5 8 12 Printing & publishing 2001 4 7 11 2005 4 5 9 2009 3 4 7 Chemicals 2001 8 13 21 2005 11 17 28 2009 13 16 29 Plastics 2001 4 7 11 2005 6 6 12 2009 9 10 19 Non-metal minerals 2001 6 18 23 2005 7 19 26 2009 6 15 20 15
  • 16.
    The impact ofweight adjustment on the accuracy of business tendency surveys 1 1 Small Large Total Basic metals 2001 2 7 9 2005 2 10 12 2009 3 7 10 Metal products 2001 9 16 25 2005 12 17 29 2009 8 18 26 Machinery 2001 3 7 9 2005 6 6 12 2009 4 9 13 Electrical machinery 2001 5 9 13 2005 7 5 13 2009 4 5 9 Transport equipment 2001 4 14 18 2005 6 15 22 2009 2 6 8 Furniture & other 2001 6 9 15 2005 5 8 13 2009 5 4 9 1 Not published 2001 3 7 10 2005 6 6 12 2009 3 4 7 Total 2001 81 172 253 2005 104 172 276 2009 85 135 220 1 Small refers to all responding units with less than 100 employees. Large depicts units with 100 and more employees. 16
  • 17.
    The impact ofweight adjustment on the accuracy of business tendency surveys Table 5 The composition of the survey results vis-à-vis domestic sales volumes, average percentage S/B 2001 2002 2003 2004 2005 2006 2007 2008 2009 Ave S 15.8 14.6 14.7 15.2 15.1 14.7 14.6 15.0 17.6 15.3 Food B 14.9 20.6 17.4 20.5 17.7 15.7 21.2 17.3 18.3 18.2 S 4.4 4.1 4.5 4.7 4.8 4.6 4.6 4.7 5.6 4.7 Beverages B 1.8 1.4 1.3 1.2 1.2 1.7 1.1 2.2 1.8 1.5 S 2.7 2.7 2.5 2.5 2.4 2.3 2.2 2.1 2.0 2.4 Textiles B 3.3 3.8 4.0 3.5 3.8 4.2 3.4 3.1 2.1 3.5 S 2.4 2.2 2.3 2.3 2.3 2.2 2.3 2.4 2.6 2.3 Clothing B 18.1 14.0 14.5 12.5 15.2 12.0 13.2 8.6 7.4 12.8 S 1.9 1.9 2.0 2.1 2.3 2.3 2.4 2.3 2.2 2.2 Wood B 1.6 1.9 1.2 2.1 1.9 2.6 1.7 4.1 4.7 2.4 S 4.7 4.7 4.8 4.7 4.6 4.6 4.5 4.6 5.0 4.7 Paper &products B 3.2 3.0 3.9 3.9 3.9 3.4 3.9 2.4 2.2 3.3 S 4.1 3.8 4.0 3.9 4.0 4.0 3.9 3.7 3.9 3.9 Printing & publishing B 1.6 0.7 1.6 0.6 1.5 2.3 1.3 1.2 1.7 1.4 S 9.2 8.9 9.4 8.9 8.7 8.8 9.5 9.8 10.8 9.3 Chemicals B 8.6 10.5 11.0 9.9 10.3 8.9 9.8 8.6 10.4 9.8 S 3.2 3.4 3.5 3.4 3.3 3.5 4.0 4.2 5.1 3.7 Plastics B 1.1 1.4 1.3 1.1 1.4 1.3 1.2 1.9 2.8 1.5 S 3.3 3.1 3.2 3.2 3.3 3.3 3.2 3.3 3.3 3.2 Non-metal minerals B 6.2 7.3 7.2 8.8 8.1 7.8 7.6 10.4 11.2 8.3 S 9.7 10.2 9.3 8.9 7.6 8.3 8.1 7.8 5.4 8.4 Basic metals B 6.5 6.5 6.0 5.0 4.5 6.4 5.8 7.3 6.8 6.1 S 5.4 5.7 6.0 5.8 5.4 5.4 5.6 5.8 5.8 5.7 Metal products B 8.5 9.2 8.7 8.2 10.8 15.0 13.8 14.7 14.5 11.5 S 5.2 5.9 6.3 6.4 6.0 5.2 4.1 2.7 3.9 5.1 Machinery B 2.7 3.0 3.1 2.8 2.8 2.1 3.0 4.4 7.4 3.5 S 5.1 4.8 4.8 4.6 4.5 4.2 3.7 4.1 4.4 4.5 Electrical machinery B 7.4 4.8 5.2 4.7 5.1 6.1 4.7 4.1 2.2 4.9 S 15.3 16.5 15.8 16.3 18.1 19.2 20.6 20.2 15.3 17.5 Transport equipment B 9.9 7.7 9.8 12.2 8.6 7.5 5.2 7.2 4.7 8.1 S 5.0 5.0 4.5 4.7 5.3 5.2 4.9 5.3 5.1 5.0 Furniture & other B 2.3 1.8 1.8 1.2 1.3 1.3 1.2 1.0 1.1 1.4 S 2.6 2.5 2.4 2.4 2.2 2.0 1.9 2.0 2.1 2.2 Not published B 2.2 2.4 2.0 1.8 1.7 1.7 1.8 1.4 0.8 1.8 S 100.0 100.0 100.0 100.0 100.0 100.0 100.0 100.0 100.0 100.0 Total B 100.0 100.0 100.0 100.0 100.0 100.0 100.0 100.0 100.0 100.0 S = Domestic sales volume, B = BER surveys Ave = average for the period 2001 – 2009 17