SlideShare a Scribd company logo
Following the large sell off in the Energy sector pace, XEC’s stock price has depreciated over the
past three months. In our view, this massive sell off is unwarranted and creates a buying opportunity
in a company that has strong growth potential with prime oil & gas assets and is trading at 0.86x to
its Net Asset Value (NAV) assuming a next year price of 50$ and 65$ flat WTI oil prices for the
next five years and a discount rate of 10%. Under these assumptions, we believe that there is 17%
potential upside in purchasing shares in Cimarex Energy.
Main Contributors
 Undervalued by the market due to relatively slower growth rates: Historically,
Cimarex has been trading lower/in line with its peers despite having one of the largest
Permian acreage positions, stronger balance sheet and pas production growth rates. His was
mainly attributed to the fact ha hey had lower than average projected production growth
rates. Due to the recent decline in oil prices, we believe ha his situation will change since
Cimarex has the financial flexibility o grow production whereas their peers will have
difficulty even sustaining current production levels due o a lack of financial capacity.
 Economic improvements in the company’s existing asset base: Through increasing
proppant loads and frac stages, XEC has consistently reported improved 30-day IP rates
across their three major portfolio assets. In 2014, XEC-operated Bone Spring wells have
posted an average 30-day IP of 1090 boe/d, an increase of 36% year-over-year while well
costs have only increased 15%.
 Margin expansion potential: Cimarex has been allocating most of its capital to the
Permian basin where the reserves have a higher weighting towards oil and therefore provide
higher netbacks, higher margins and IRR’s. By the end of 2019, we expect the company’s
annual production mix to be weighted 55% in favor of oil
 A strong balance sheet and financial flexibility is coveted in the current market
environment: Compared to its peers Cimarex has a great flexibility with regards to its
balance sheet. The company has a net debt/market capitalization ratio of ~11% vs. is peer
group average of ~45% as well and an LTM net debt/Ebitda of 0.5x vs. is peer group
average of 1.2x.
Cimarex Energy, NYSE: XEC ($100.25) AlexandreTang
Buy – Target Price $117.3 Alvy Mizelle
January 27th
2015
Kenneth Woods
Portfolio Management Program
Business Metrics
Price (January 27th
2015) 100.25
52 Low 91.74
52 Week High 150.74
Shares Outstanding (M) 87.2
Market Cap ($M) 8,591
Enterprise Value ($M) 9,528
Proven Reserves (MMcfe) 1944.7
Fiscal Year End Dec 31st
2013A Reserve % Gas 68.2%
2013A Production (BCFE) 252.8
Financial Metrics ($M)
2013A Operating
Income
895.6
2014E Operating
Income
938.0
2013A Ebitda 1,534.0
2014E Ebitda 1,763.8
Trading multiples
LTM EV/ Ebitdax 4.9x
2015E EV/ Ebitdax 9.1x
EV/Proved Reserves 22.9
EV/Daily Production 82.6
Company Description
Cimarex Energy Co. operates as an
independent oil and gas exploration and
production company primarily in Texas,
Oklahoma, and New Mexico. The company
owns interests in 4,160 net productive oil
and gas wells. As of December 31, 2013, it
had a total proved oil and gas reserves of 2.5
trillion cubic feet equivalent, consisting of
1.3 trillion cubic feet of natural gas; 108,533
thousand barrels (MBbls) of oil; and 92,044
MBbls of natural gas liquids primarily
located in the Permian Basin and Mid-
Continent regions. The company was
founded in 2002 and is headquartered in
Denver, Colorado.
0
1,000,000
2,000,000
3,000,000
4,000,000
5,000,000
6,000,000
7,000,000
8,000,000
9,000,000
0
20
40
60
80
100
120
140
160
Avg Vol Close
One Year Stock Price Performance
2 January 27th
2015| KWPMP Energy Team
Contents
Investment Thesis.......................................................................................................................................... 3
Company Overview....................................................................................................................................... 4
Asset Overview.............................................................................................................................................. 5
Permian Basin............................................................................................................................................ 5
Delaware Basin.......................................................................................................................................... 7
Increased efficiency in drilling techniques................................................................................................ 9
Cana Woodford Shale................................................................................................................................ 9
Production Overview................................................................................................................................... 11
Margin Expansion Potential .................................................................................................................... 11
Capital Expenditures Budget & Allocation .................................................................................................. 12
Balance Sheet Flexibility.............................................................................................................................. 12
Valuation ..................................................................................................................................................... 15
Production Schedule ............................................................................................................................... 15
Expense Projections ................................................................................................................................ 16
Income Statement................................................................................................................................... 17
EBITDA Schedule ..................................................................................................................................... 17
Net Asset Value ....................................................................................................................................... 18
Net Asset Value Sensitivity Analysis........................................................................................................ 19
Appendix...................................................................................................................................................... 20
Management........................................................................................................................................... 20
Cash Flow Statement............................................................................................................................... 21
Ownership ............................................................................................................................................... 22
Horizontal Wells ...................................................................................................................................... 22
Comparable Company Analysis............................................................................................................... 23
References............................................................................................................................................... 24
3 January 27th
2015| KWPMP Energy Team
Investment Thesis
We believe Cimarex Energy (XEC) is currently undervalued by the market as it continues to discount
lower growth E&P`s. Historically, the company traded at a discount relative to its peers due to
substandard production growth and the lack of exploration success in the Gulf Coast. However,
moving forward XEC should benefit from an improving resource base supported by a disciplined
spending program and a strong balance sheet. Once considered a weakness, accepting slower growth
rates in order to keep a clean balance sheet, is now coveted. North American companies who took
on huge levels of debt in order to take full advantage of the energy revolution are now faced with a
limited number of options and may even fall into bankruptcy. Additionally, the recent decline in
XEC’s stock price provides for an interesting entry point.
Main Highlights:
Economic improvements in the company’s existing asset base:
Horizontal Volume growth is driving earnings and cash flow:
Through increasing proppant loads and frac stages, XEC has consistently reported improved 30-day
IP rates across their three major portfolio assets. In 2014, XEC-operated Bone Spring wells have
posted an average 30-day IP of 1090 boe/d, an increase of 36% year-over-year while well costs have
only increased 15%.
Emerging long-lateral Wolfcamp potential provides risk/reward upside:
While XEC has only drilled a handful of long-lateral Wolfcamp D wells to-date, the initial results
have been outstanding: 30-day IPs over 2,500 boe/d (27% oil) from a 10,000’ lateral are sizeable
improvements over XEC’s typical 1,500 boe/d IP from a 5,000’ lateral.
Margin expansion potential:
Initially, Cimarex’s annual production was 70% weighted towards natural gas. Due to successful
drilling results in the Permian basin which is more weighted towards liquids, the company’s current
production mix is 51% liquids. The company should be able to further increase its annual production.
Recently has been allocating most of its capital to the Permian basin and this trend should remain
constant going forward. The stacked and multi-zone reserve characteristics of this are make it more
attractive for drilling operations since they generate higher EUR’s and IP rates. Also, these reserves
have a higher weighting towards oil and therefore provide higher netbacks, higher margins and
IRR’s. By the end of 2019, we expect the company’s annual production mix to be weighted 55% in
favor of oil.
A strong balance sheet and financial flexibility is coveted in the current market environment:
Compared to its peers Cimarex has a great flexibility with regards to its balance sheet. The company
has one of the lowest net debt/market capitalization ratios as well as the lowest net debt/Ebitda. This
will allow the company to raise more debt if needed, enable the company to remain in line with its
credit covenants or acquire distressed companies if the opportunity arises.
The company also has ~$1.5B of capital flexibility with its undrawn $1.0B revolver and ~$500M
of cash on its balance sheet. Also, both of the company’s senior notes expire after 2020 with one
expiring in 2022 and the other expiring in 2024.
4 January 27th
2015| KWPMP Energy Team
Company Overview
Cimarex Energy is a mid-cap E&P based in the U.S focused on developing, producing, and
marketing crude oil and natural gas. Historically, Cimarex has drilled in the Mid-Continent and
Permian Basin, while also maintaining an exploration program along the Gulf Coast. As of January
2015, the company maintains 2.5 Tcfe of proved reserves, 52% of which is weighted towards natural
gas. Additionally, Cimarex has increased daily production to ~870 MMcfe from 627 MMcfe in 2012.
Furthermore, one of the most appealing aspects of Cimarex is the company’s strong balance sheet.
As of its latest filings (Q4/14) the company harbours no bank debt, and maintains a debt to
capitalization ratio of only 18%.
Source: Societe Generale – Cross Asset Research
5 January 27th
2015| KWPMP Energy Team
Asset Overview
Permian Basin
The Permian Basin spans 75,000 square miles and is composed of three sub-basins: the Midland
Basin, Central Basin Platform, and Delaware Basin. This basin has been pumping oil since the 1920s,
with production peaking at about 2 million barrels a day in the early 1970s. For decades, geologists
have known that oil could be found in different layers of rock, but now drillers are starting to tap
those layers simultaneously from a single site and are committing billions of dollars to do so. Unlike
the more continuous nature of the Eagle Ford and Bakken Shales, the Permian has several stacked
formations, from the shallow Spraberry (at 5,000-7,000 feet) to the deeper Wolfcamp Shale (at
7,000-10,000 feet) and the Mississippian (at below 11,000 feet). The multiple stacked formations
lower the drilling risk for the Permian, given that if one formation is non-commercial, another one
might be commerciable.
Source: Energy Information Administration
Also, by using horizontal drilling techniques, companies are able to drill one well with multiple
laterals in multiple stacked formations, generating higher IP’s and higher EUR’s. The EIA estimates
technically recoverable resources from tight oil Bone Springs and Spraberry formations at slightly
less than 2 billion barrels, while Pioneer Natural Resources (one of the largest Permian operators)
estimates the Midland Basin Wolfcamp Shale and Spraberry hold 50 billion barrels of resource
potential.
In shale formations of the Permian Basin of Texas and New Mexico, the rate of growth for oil
production is set to increase for the sixth consecutive month, according to data from the EIA's drilling
productivity report. The formation's growth rate is outpacing Texas' Eagle Ford, where growth
slowed between February and August, and North Dakota's Bakken fields, where growth has been
Permian Basin Map
6 January 27th
2015| KWPMP Energy Team
relatively stable in recent months. Rig counts and production has been increasing significantly over
the past years, due to increased technology and new oil discoveries. The increases in rig counts and
production results are a testament to this area’s growth and reserve potential.
The company also has one of the highest net acreage positions in the Permian Basin. Due to its strong
financial flexibility and its ability to maintain its capital expenditure, Cimarex is one of the rare
Permian producers that could significantly increase its production base and as a result, we believe it
could out grow its peers.
Source: Cimarex Energy
The company has three main drilling areas: Culberson Area, Reeves County and in Ward County.
Combined, the company has over 200K net acres in those areas and has drilled 2-3 horizontal well
locations. In the coming years, the company plans on spending more than 75% of its capital
expenditure program in these three areas with the Culberson having the biggest upside potential.
Source: Cimarex Energy
80
130 135 135
150
220
0
50
100
150
200
250
Rose CWEI EGN EOG CXO XEC
NetAcreagein000
Permian Drilling Areas
Permian Acreage vs. Peers
7 January 27th
2015| KWPMP Energy Team
Delaware Basin
Cimarex’s two main operating areas are the Delaware basin (west Texas and southern New Mexico)
and the Mid-Continent (primarily Oklahoma). Historically speaking, Cimarex began as a gas-
focused company until it began focusing on the Delaware Basin. The Delaware basin recently has
become a hotbed of industry activity, with multiple operators adding drilling rigs in pursuit of high-
return oil-focused drilling. In 2014, XEC began to increase the number of frac stages and proppant
amounts in its Bone Springs wells and has received positive results to date, reporting a 2014 average
30-day IP of 1090 boe/d per well vs. an average of 800 boe/d in 2013. In mid-2013, XEC entered
into a joint venture with Chevron in order to drill long-lateral wells on its Culberson acreage. Having
struggled in the past, the initial results were significant as two Wolfcamp D long-lateral wells
produced 2-stream 30-day IPs over 2,500 boe/d (26% oil).
Source: Cimarex Energy
Wolfcamp: XEC’s Wolfcamp drilling is largely focused in Culberson, Reeves, and Ward counties
(TX), where the industry is still delineating the multi-zone potential of the Wolfcamp formation. In
mid-2013, XEC entered into a joint venture with Chevron (CVX) on its checkerboard Culberson
county acreage in order to optimally drill long-lateral Wolfcamp wells, and the initial results were
significant as two Wolfcamp D long-lateral wells produced 2-stream 30-day IPs over 2,500 boe/d
(26% oil). XEC’s Culberson Wolfcamp A wells have also posted encouraging results with higher
initial oil cuts (54% oil) vs. Wolfcamp D wells (26% oil). In Reeves and Ward counties, XEC has
been drilling in the Wolfcamp A with notable short and long-lateral success in Reeves, though XEC
is still working to optimize its landing zone in the Ward Wolfcamp A as its initial well result was
mildly disappointing and contrary to broader industry results.
Cimarex Delaware Basin Map
8 January 27th
2015| KWPMP Energy Team
Source: Cimarex Energy
Culberson: XEC believes its Culberson JV acreage is 100% prospective for long-lateral development
while its Reeves acreage is only 50% prospective, primarily limited by lease configuration. In 2014,
XEC began drilling 4 Wolfcamp down spacing pilots, with XEC’s initial 80-acre Culberson down
spacing pilot producing a 4-well 30-day average of 1,100 boe/d. In 3Q14, XEC announced that its
most recent 4-well 80-acre Reeves Wolfcamp A down spacing pilot produced 1,029 boe/d (49% oil),
and additional results from XEC’s stacked Reeves Wolfcamp A pilot are expected later this year.
Lastly, over the past few years XEC has built the Triple Crown gas gathering and processing system
in Culberson and Eddy counties, enabling XEC to reduce gathering costs and provide a reliable
means for gas takeaway.
Furthermore, the company has nearly tripled its Permian daily production over the past years. Since,
their Permian reserves have a higher weighting towards oil compared to their Mid-Continent
reserves, Cimarex has been able to shift its production mix to 50% liquids and generate higher
margins and netbacks
Source: Cimarex Energy
29 30
34
36
40 41
46
49
43
53
59
55
58
66 68
0
10
20
30
40
50
60
70
Q1 11 Q2 11 Q3 11 Q4 11 Q1 12 Q2 12 Q3 12 Q4 12 Q1 13 Q2 13 Q3 13 Q4 13 Q1 14 Q2 14 Q3 14
Oil NGL Gas Total
Q1 2011 - Q3 2014 Permian Production Growth
New Mexico and Southern Texas Basins
9 January 27th
2015| KWPMP Energy Team
Increased efficiency in drilling techniques
Horizontal Volume growth is driving earnings and cash flow:
Through increasing proppant loads and frac stages, XEC has consistently reported improved 30-day
IP rates across their three major portfolio assets. In 2014, XEC-operated Bone Spring wells have
posted an average 30-day IP of 1090 boe/d, an increase of 36% year-over-year while well costs have
only increased 15%.
Emerging long-lateral Wolfcamp potential provides risk/reward upside:
While XEC has only drilled a handful of long-lateral Wolfcamp D wells to-date, the initial results
have been outstanding: 30-day IPs over 2,500 boe/d (27% oil) from a 10,000’ lateral are sizeable
improvements over XEC’s typical 1,500 boe/d IP from a 5,000’ lateral.
Source: Cimarex Energy
Cana Woodford Shale
In the Mid-Continent, XEC’s focus is in the core of the Cana Woodford shale, a wet gas play in the
Anadarko basin of western Oklahoma. XEC began drilling in the Cana in 2007 and is one of two
major operators that have transitioned to full-field development in the core, drilling 9 wells per
section (8 new wells + 1 parent well). XEC and its partner (DVN) reduced drilling in the Cana after
natural gas prices collapsed in 2012, but recent improvements in fracking alongside a recovery in
natural gas prices have rejuvenated the economics of Cana drilling, and XEC now believes its
opportunities in the Cana can compete with the returns from its Permian drilling program. The
majority of the improvement has come in the form of additional frac stages (now 20 stages per well,
Wolfcamp long-lateral results
10 January 27th
2015| KWPMP Energy Team
up from 10) and higher sand amounts (now 6mm lbs per well, up from 3.5mm), but XEC has also
had success drilling wells on the outskirts of the core as well as drilling an extended lateral to the
north of the field. These results point to further improvements in the economics and prospectively
of the Cana, and XEC has chosen to take advantage by increasing their 2015 rig count and embarking
on a 10-section development row in the heart of the Cana field utilizing the upsized frac technique.
Source: Cimarex Energy
Cimarex derives the majority of its daily production from its Cana Woodford Shale reserves. Even
if this portion of their reserves is more of their legacy production, the company has more than doubled
its production in this area. These reserves are also more weighted towards natural gas and has also
enabled them to withstand the recent oil price decreases. The wells in this area are also less capital
intensive to drill and will continue to be a large growth contributor for the coming years
160 156
184
214
230
216 216 225
255
310
404
0
50
100
150
200
250
300
350
400
450
Q1 12 Q2 12 Q3 12 Q4 12 Q1 13 Q2 13 Q3 13 Q4 13 Q1 14 Q2 14 Q3 14
Dailyproducion(MMcfe/d)
Gas NGL Oil
Cana Woodford Shale Drilling Operations
Q1 12 – Q3 14 Cana Woodford Shale Production Growth
11 January 27th
2015| KWPMP Energy Team
Production Overview
Initially, Cimarex’s annual production was 70% weighted towards natural gas. Due to successful
drilling results in the Permian basin which is more weighted towards liquids, the company’s current
production mix is 51% liquids. Also, the company has nearly doubled its annual production since
2009, and with strong capital flexibility, the company should be able to further increase its annual
production
Margin Expansion Potential
Cimarex has been allocating most of its capital to the Permian basin and this trend should remain
constant going forward. The stacked and multi-zone reserve characteristics of this are make it more
attractive for drilling operations since they generate higher EUR’s and IP rates. Also, these reserves
have a higher weighting towards oil and therefore provide higher netbacks, higher margins and
IRR’s. By the end of 2019, we expect the company’s annual production mix to be weighted 55% in
favor of oil.
51.0 84.8 96.1 110.8 127.5 161.4
118.0
132.8 120.1 118.5
125.2
153.2
169.0
217.6 216.3
229.3
252.8
314.6
30%
39%
44%
48%
50% 51%
0%
10%
20%
30%
40%
50%
60%
0.0
100.0
200.0
300.0
400.0
500.0
600.0
2009A 2010A 2011A 2012A 2013A 2014E
AnnualProduction(Bcfe)
Gas Oil+ NGL Liquids % Annual Production
161.4 176.9 192.0 204.5 216.1 222.7
153.2 163.3 170.2 174.2 176.8 182.2
314.6
340.1
362.2 378.6 393.0 404.8
51%
52%
53%
54%
55% 55%
44%
46%
48%
50%
52%
54%
56%
0.0
100.0
200.0
300.0
400.0
500.0
600.0
700.0
800.0
900.0
2014E 2015E 2016E 2017E 2018E 2019E
AnnualProduction(Bcfe)
Gas Oil+ NGL Liquids % Annual Production
2009A-2014E Production Profile
2014E-2019E Production Profile
12 January 27th
2015| KWPMP Energy Team
Capital Expenditures Budget & Allocation
Cimarex is budgeting $1.95B for its exploration and development this year. This includes 80% for
drilling, 14% for land, seismic, and overhead, and 6% for facilities and other expenses. The company
has not approved a CAPEX budget for 2015, which will be based on several factors. The economics
of all plays will be tested at both the current strip and in a bear case of $60/b oil and $3/mcf gas to
determine which plays best compete for capital. Currently, its highest economic areas are Culberson
County in the Permian and the Cana-Woodford, particularly with the use of new completion
techniques.
Source: Cimarex Energy
Balance Sheet Flexibility
Compared to its peers Cimarex has a great flexibility with regards to its balance sheet. The company
has one of the lowest net debt/market capitalization ratios as well as the lowest net debt/ebitda.
This will allow the company to raise more debt if needed, enable the company to remain in line
with its credit covenants or acquire distressed companies if the opportunity arises.
Mid Continent
24%
Permian
74%
Company MKt. Cap EV Net Debt Net Debt/Market Cap Net Debt/EBITDA
Energen Corporation 4,650 5,282 631 13.6% 0.6x
Concho Resources 12,345 17,410 5,066 41.0% 2.5x
Laredo Petroleum 1,382 2,046 664 48.0% 1.1x
Pioneer Natural Resources 21,997 23,709 1,712 7.8% 0.8x
Newfield Exploration 3,882 6,532 2,650 68.3% 1.8x
SM Energy 2,544 4,534 1,990 78.2% 1.3x
Low 1,382 2,046 631 7.8% 0.6x
Median 4,266 5,907 1,851 44.5% 1.2x
High 21,997 23,709 5,066 78.2% 2.5x
Cimarex 8,591 9,528 937 10.9% 0.5x
2014 Capital Allocation
13 January 27th
2015| KWPMP Energy Team
The company also has ~$1.5B of capital flexibility with its undrawn $1.0B revolver and ~$500M
of cash on its balance sheet. Also, both of the company’s senior notes expire after 2020 with one
expiring in 2022 and the other expiring in 2024. This will enable the company to increase its
annual production and pursue M&A activity if desired.
Due to its strong production base and management’s ability to keep capital efficiency high, the
company has and will be able to generate a significant amount of cash flow from operations
internally. In the past years, the company has been able to fund he majority of its capital
expenditures with internally generated cash and this has enabled them to maintain a strong balance
sheet. In the next five years, the company will have to dip into its revolver since natural gas and oil
prices should remain low in the coming year, but as oil prices rebound, the company should be able
to fund the majority of its capital expenditures with internally generated cash flow.
1,000
750 750
0
200
400
600
800
1,000
1,200
2015F 2016F 2017F 2018F 2019F 2020F 2021F 2022F 2023F 2024F
$M
Undrawn Revolver 5.88% Senior Notes 4.44% Senior Notes
1.69
1.20
1.45
1.54 1.60 1.65
2.13
1.80 1.80 1.80 1.80 1.80
0.00
0.50
1.00
1.50
2.00
2.50
2014E 2015E 2016E 2017E 2018E 2019E
$B
Cash Flow from Operations Capex
Debt Obligations
2014E-2019E Cash Flow from Operations vs. Capital Expenditures
14 January 27th
2015| KWPMP Energy Team
Due to the company’s ability to generate cash internally, the company will be able to
withstand the recent drop in commodity prices with the cash it has on its balance sheet
and its $1.5B revolver facility.
28% 28%
50%
70%
86%
98%
0.0%
20.0%
40.0%
60.0%
80.0%
100.0%
120.0%
2014A 2015F 2016F 2017F 2018F 2019F
Revolver Capacity
15 January 27th
2015| KWPMP Energy Team
Valuation
Production Schedule
 In order to forecast production, we analyzed the companies capital efficiency which is calculated by dividing
how many barrels replaced and added by the capital expenditures for that year
o This number has been increasing in the past years since the company has been drilling more capital
intensive wells in the Permian Basin and should remain constant thereafter
 We also looked at the yearly decline rates and since the company is shifting most of its production towards
oil, their decline rates will increase as well to 17.5% and remain constant thereafter
 The company has not released their new capital budgets in light of the recent drop in oil price but according
to analyst reports, capital expenditures should not be altered due to the company’s capital availability and
cash flow generating ability.
o Capital expenditures are expected to remain at $1.8B in the coming years
 The company should be able to replace declining production as well as add ~250 MMcfe/d from 2015-2019
Cimarex Energy - Production Profile
Projected Fiscal Years Ending December 31st
2009A 2010A 2011A 2012A 2013A 2014E 2015F 2016F 2017F 2018F 2019F
Days in Year 365 365 365 366 365 365 365 366 365 365 365
Average Daily Production
Gas (MMcf) 323.2 363.9 329.1 323.8 343.1 419.7 447.3 465.1 477.2 484.5 499.1
Natural Gas Liquids (MMBbls) 0.6 11.7 17.1 19.0 21.6 31.4 35.7 39.6 41.5 44.9 46.2
Oil (MMBbls) 22.7 27.0 26.8 31.5 36.7 42.3 45.0 47.8 51.9 53.8 55.5
Total Daily MMcfe 463.0 596.1 592.5 626.5 692.5 861.8 931.9 989.6 1,037.3 1,076.7 1,109.1
Total Annual Production
Gas (Bfce) 118.0 132.8 120.1 118.5 125.2 153.2 163.3 170.2 174.2 176.8 182.2
Natural Gas Liquids (MMBbls) 0.2 4.3 6.2 7.0 7.9 11.4 13.0 14.5 15.1 16.4 16.9
Oil (MMBbls) 8.3 9.9 9.8 11.5 13.4 15.4 16.4 17.5 18.9 19.6 20.2
Total Bcfe 169.0 217.6 216.3 229.3 252.8 314.6 340.1 362.2 378.6 393.0 404.8
Decline Rate 14.00% 15.00% 15.50% 17.00% 17.00% 17.50% 17.50% 17.50% 17.50% 17.50% 17.50%
Production Decline (MMcfe) 65 69 92 101 107 162 151 163 173 182 188
Production additions - 133 (4) 34 66 169 70 58 48 39 32
Capital efficieny - 10,398 5,685 8,104 7,500 8,150 8,150 8,150 8,150 8,150 8,150
Capital Expenditures
Maintenance Capex (US $M) 1,320 1,229 1,329 1,411 1,479 1,536
Growth Capex (US $M) 679.9 570.9 471.0 388.6 320.6 264.5
Total Capex Spending (US $M) 535.0 960.0 1,562.0 1,663.0 1,572.0 2,000.0 1,800.0 1,800.0 1,800.0 1,800.0 1,800.0
Total Wells Drilled
Proved Reserves
Gas (Bcf) 1,186.6 1,254.2 1,216.4 1,251.9 1,293.5
Natural Gas Liquids (MMBbls) 1.3 41.3 65.8 89.9 92.0
Oil (MBBls) 56.8 63.7 72.3 77.9 108.6
Total Proved Reserves (Bcfe) 1,534.7 1,884.0 2,045.3 2,258.8 2,497.1
Total Proved Reserves (MMBOE) 255.8 314.0 340.9 376.5 416.2
Reserve Life Ratio (Years) 9.1 8.7 9.5 9.9 9.9
Proved Reserves % Oil 22.2% 20.3% 21.2% 20.7% 26.1%
16 January 27th
2015| KWPMP Energy Team
Expense Projections
 Excluding depreciation, Cimarex’s per MMcfe production expenses have remained constant throughout the
years
 A five year average of per MMcfe expenses was used in order to project future expenses
Cimarex Energy - Expense Projections
Projected Fiscal Years Ending December 31st
($ in Millions or Per Mcfe Where Noted) 2009A 2010A 2011A 2012A 2013A 2014E 2015F 2016F 2017F 2018F 2019F
Expenses Per MMcfe of Production ($ as Stated)
Production 1.1 0.9 1.1 1.1 1.1 1.1 1.1 1.1 1.1 1.1 1.1
DD&A 1.6 1.4 1.8 2.2 2.4 2.5 2.5 2.5 2.5 2.5 2.5
Accr. of Asset Retirement Obli. 0.1 0.0 0.1 0.1 0.0 0.0 0.0 0.0 0.0 0.0 0.0
Transportation and other operating 0.2 0.2 0.3 0.3 0.4 0.4 0.3 0.3 0.3 0.3 0.3
Taxes other than income 0.4 0.6 0.6 0.4 0.4 0.5 0.5 0.5 0.5 0.5 0.5
G&A (Exc. Stock-Based Comp.) 0.2 0.2 0.2 0.2 0.3 0.3 0.2 0.2 0.2 0.2 0.2
Other operating expenses 0.1 0.0 0.0 0.1 (0.5) - - - - - -
Total Expenses Per MMcfe 3.7 3.4 4.1 4.4 4.2 4.7 4.6 4.6 4.6 4.6 4.6
Total Expenses Per Mmcfe excluding depreciation 2.2 2.0 2.3 2.2 1.8 2.3 2.1 2.1 2.1 2.1 2.1
Non-Production-Linked Expenses ($ in Millions)
Gas gathering and processing 20.6 22.2 18.2 22.0 25.9 35.5 35.5 35.5 35.5 35.5 35.5
Derivative FV Gain / (Loss) (13.1) 62.7 10.3 0.2 (0.2) 0.2 0.2 0.2 0.2 0.2 0.2
Impairements 791.1 - - - - - - - - - -
Total Non-Prod.-Linked Expense 798.6 84.9 28.5 22.2 25.7 35.8 35.8 35.8 35.8 35.8 35.8
Total Production-Linked Expenses ($ in Millions)
Production 178.2 194.0 247.0 258.6 286.7 337.8 364.0 387.6 405.2 420.5 433.2
DD&A 265.7 304.2 390.5 513.9 615.9 777.8 841.0 895.6 936.2 971.7 1,000.9
Accr. of Asset Retirement Obli. 12.3 7.3 11.5 13.0 8.0 11.8 16.9 18.0 18.8 19.5 20.1
Transportation and other operating 33.8 50.0 61.8 57.4 93.6 182.3 90.9 96.8 101.1 105.0 108.1
Taxes other than income 75.6 121.8 126.5 87.0 112.7 139.4 164.4 175.1 183.1 190.0 195.7
G&A (Exc. Stock-Based Comp.) 41.7 48.6 45.3 54.4 77.5 78.7 83.2 88.6 92.6 96.2 99.1
Other operating expenses 24.3 4.6 10.3 25.0 (132.3) 0.0 - - - - -
Total Production-Linked Exp 631.6 730.5 892.8 1,009.3 1,062.0 1,527.7 1,560.3 1,661.7 1,736.9 1,802.8 1,857.1
17 January 27th
2015| KWPMP Energy Team
Income Statement
 In terms of oil price projections, a price of 50$ was used for 2015 and $65 thereafter
 Despite the decline in oil prices, the company should still be able to generate positive net income in the
coming years
EBITDA Schedule
Cimarex Energy - Income Statement
Projected Fiscal Year Ending December 31st
($ in Millions Except Per Share Data) 2009A 2010A 2011A 2012A 2013A 2014E 2015F 2016F 2017F 2018F 2019F
Revenue
Gas 485.4 653.8 530.3 340.7 471.0 693.1 587.7 612.9 627.0 636.6 655.8
Natural Gas Liquids 8.2 149.2 263.8 213.1 231.2 404.5 347.5 386.2 403.6 436.4 449.6
Oil & Condensate 468.8 755.6 909.3 1,027.8 1,250.2 1,363.6 946.9 1,176.5 1,272.2 1,320.4 1,360.2
Gas, gathering, processing and other 47.4 55.1 54.4 42.3 45.5 54.4 54.4 54.4 54.4 54.4 54.4
Total Revenue 1,009.8 1,613.7 1,757.9 1,623.9 1,998.1 2,515.6 1,936.5 2,229.8 2,357.2 2,447.8 2,519.9
Expenses
Impairment of property and equipment 791.1 - - - - - - - - - -
DD&A 265.7 304.2 390.5 513.9 615.9 777.8 841.0 895.6 936.2 971.7 1,000.9
Accr. of Asset Retirement Obli. 12.3 7.3 11.5 13.0 8.0 11.8 16.9 18.0 18.8 19.5 20.1
Production 178.2 194.0 247.0 258.6 286.7 337.8 364.0 387.6 405.2 420.5 433.2
Transportation and other operating 33.8 50.0 61.8 57.4 93.6 182.3 90.9 96.8 101.1 105.0 108.1
Gas gathering and processing 20.6 22.2 18.2 22.0 25.9 35.5 35.5 35.5 35.5 35.5 35.5
Taxes other than income 75.6 121.8 126.5 87.0 112.7 139.4 164.4 175.1 183.1 190.0 195.7
G&A (Exc. Stock-Based Comp.) 41.7 48.6 45.3 54.4 77.5 78.7 83.2 88.6 92.6 96.2 99.1
Stock based compensation 9.3 12.4 18.9 21.9 14.3 24.3 18.7 21.5 22.7 23.6 24.3
Derivative FV Gain / (Loss) 13.1 (62.7) (10.3) (0.2) 0.2 (0.2) - - - - -
Other operating expenses 24.3 4.6 10.3 25.0 (132.3) 0.0 - - - - -
Total Expenses 1,465.7 702.3 919.6 1,052.9 1,102.4 1,587.3 1,614.6 1,718.7 1,795.2 1,861.9 1,917.0
Operating Income (455.9) 911.4 838.3 571.0 895.6 938.0 322.0 511.1 562.0 585.8 603.0
Other (Income) / Expense
Loss on early extinguishment of long-term debt - (3.8) - 16.2 - - - - - - -
Net Interest Expense 39.8 36.6 35.6 49.3 55.0 50.3 54.7 61.3 71.3 81.1 90.7
Capitalized Interest (23.4) (29.2) (29.1) (35.2) (31.5) (37.7) (41.0) (46.0) (53.4) (60.8) (68.0)
Other income 16.3 (6.0) (9.8) (19.9) (21.5) (22.2) - - - - -
Total Other (Income) / Exp. 32.7 (2.4) (3.2) 10.5 1.9 (9.6) 13.7 15.3 17.8 20.3 22.7
Pre-Tax Income (488.5) 913.7 841.5 560.6 893.7 947.7 308.3 495.8 544.1 565.6 580.3
Income tax expense (benefit) (176.5) 338.95 311.5 206.7 329.0 348.6 113.4 182.4 200.2 208.0 213.5
Net Income (312.0) 574.8 529.9 353.8 564.7 599.1 194.9 313.4 344.0 357.5 366.8
Earnings Per Basic Share (3.81) 6.86 6.32 4.17 6.58 6.99 2.27 3.64 3.99 4.14 4.24
Earnings Per Diluted Share (3.81) 6.86 6.29 4.16 6.61 7.00 2.27 3.65 4.00 4.15 4.25
Cimarex Energy - Non-Cash and One-Time Expenses and EBITDA
Projected Fiscal Years Ending December 31st
($ in Millions) 2009A 2010A 2011A 2012A 2013A 2014E 2015F 2016F 2017F 2018F 2019F
Operating Income (455.9) 911.4 838.3 571.0 895.6 938.0 165.7 511.1 562.0 585.8 603.0
Plus Non-Cash Deriv. Change 14.5 (10.6) (3.6) (0.2) 0.2 11.9 3.0 4.5 2.3 3.0 2.0
Plus Impairment Charge 791.1 - - - - - - - - - -
Plus DD&A 265.7 304.2 390.5 513.9 615.9 777.8 841.0 895.6 936.2 971.7 1,000.9
Plus Asset Retirement Accr. 12.3 7.3 11.5 13.0 8.0 11.8 16.9 18.0 18.8 19.5 20.1
Plus Stock-Based Comp. 9.3 12.4 18.9 21.9 14.3 24.3 17.2 21.5 22.7 23.6 24.3
EBITDA 637.0 1,224.7 1,255.5 1,119.7 1,534.0 1,763.8 1,043.7 1,450.7 1,541.9 1,603.6 1,650.3
18 January 27th
2015| KWPMP Energy Team
Net Asset Value
Key Assumptions:
 LT decline rates: 7.0%
 Discount Rate: 10.0%
 Future development costs: $700M
 Proved Reserves: 2.5 Tcfe
 Per acreage value:
o Permian: $12K
o Mid-continent per acreage value: $4k
o Other: $1K
Price Assumptions 2015 Oil Price LT Oil Price 2015 Gas Price LT Gas Price
50.0$ 65.00$ 3.0$ 3.75$
Value ($M) $/Share
Proved Reserves Cash Flow Undiscounted 12,468 145
PV-10 Proved Reserves Cash Flow 8,771 102
Undevelopped Acreage:
Permian 1,680 20
Mid-Continent 420 5
Other 120 1
Total UndevelopedAcreage 2,220 26
Net Asset Value (Enterprise Value) 10,991 128
Net Debt (937) (11)
Implied Equity Value 10,054
Diluted Shares Outstanding 85.7
Value/ Share 117.3
% premium / (discount) over market share price 17.0%
Cimarex Energy Net Asset Valuation
19 January 27th
2015| KWPMP Energy Team
Net Asset Value Sensitivity Analysis
Sensitivity Analysis
Cimarex Energy - Net Present Value Sensitivity - Oil Prices
117.32$ 7.0% 8.0% 9.0% 10.0% 11.0% 12.0% 13.0%
75.00 137.5 133.4 129.5 125.8 122.3 119.0 115.8
70.00 132.7 128.8 125.1 121.6 118.2 115.1 112.0
65.00 127.9 124.2 120.7 117.3 114.1 111.1 108.2
60.00 123.1 119.6 116.3 113.1 110.0 107.2 104.4
55.00 118.4 115.0 111.8 108.8 105.9 103.2 100.6
50.00 113.6 110.4 107.4 104.6 101.8 99.3 96.8
Cimarex Energy - Valuation Upside
0.17$ 7.0% 8.0% 9.0% 10.0% 11.0% 12.0% 13.0%
75.00 37% 33% 29% 26% 22% 19% 16%
70.00 32% 28% 25% 21% 18% 15% 12%
65.00 28% 24% 20% 17% 14% 11% 8%
60.00 23% 19% 16% 13% 10% 7% 4%
55.00 18% 15% 12% 9% 6% 3% 0%
50.00 13% 10% 7% 4% 2% -1% -3%
Cimarex Energy - Net Present Value Sensitivity - Oil & Natural Gas Prices
117.32$ 50.00 55.00 60.00 65.00 70.00 75.00 80.00
5.75 117.7 122.0 126.2 130.5 134.7 139.0 143.2
4.75 111.2 115.4 119.7 123.9 128.2 132.4 136.7
3.75 104.6 108.8 113.1 117.3 121.6 125.9 130.1
2.75 98.0 102.3 106.5 110.8 115.0 119.3 123.5
1.75 91.4 95.7 100.0 104.2 108.5 112.7 117.0
0.75 84.9 89.1 93.4 97.6 101.9 106.2 110.4
NaturalGasPrices
($/Mcfe)
OilPrices
($/Bbl)
OilPrices
Discount Rate
Oil Prices ($/Bbl)
Discount Rate
20 January 27th
2015| KWPMP Energy Team
Appendix
Management
Thomas E. Jorden – President & CEO
Tom Jorden was named President and Chief Executive Officer of Cimarex in September 2011 and Chairman of the
Board in August 2012. Mr. Jorden previously served as Executive Vice President of Exploration since the formation
of Cimarex in December 2003 and held that same position at Key Production Company, Inc., Cimarex’s predecessor.
He joined Key in November 1993 as Chief Geophysicist and later as Vice President of Exploration (October 1999 to
September 2002). Prior to joining Key, Mr. Jorden was with Union Pacific Resources and Superior Oil Company.
He is a graduate of the Colorado School of Mines where he earned B.S. and M.S. degrees in Geophysics.
Joseph R. Albi – Executive VP & COO
Joe Albi was named Executive Vice President and Chief Operating Officer of Cimarex and elected to its board of
directors in September 2011. He previously served as Executive Vice President of Operations since March 2005 and
Senior Vice President of Corporate Engineering since December 2003. He joined Key Production Company, Inc. in
1994 where he held positions of increasing responsibility prior to its merger with Cimarex. Prior to joining Key, Mr.
Albi was with Black Dome Energy Corporation, Apache Corporation and Nicor Exploration Company. Mr. Albi is a
graduate of the Colorado School of Mines where he earned a B.S. in Petroleum Engineering and a M.S. in Mineral
Economics.
Stephen P. Bell – Executive VP of Business Development
Steve Bell was named Executive Vice President of Business Development in September 2012. Mr. Bell was
appointed Senior Vice President of Business Development and Land in September 2002. Prior to its merger with
Cimarex, Mr. Bell was with Key Production Company, Inc. He joined Key in 1994 and in September 1999 was
appointed Senior Vice President of Business Development and Land. From February 1994 to September 1999 he
served as Vice President of Land.
21 January 27th
2015| KWPMP Energy Team
Cash Flow Statement
Cimarex Energy - Cash Flow Statement
Projected Fiscal Years Ending December 31st
($ in Millions) 2009A 2010A 2011A 2012A 2013A 2014E 2015F 2016F 2017F 2018F 2018F
Operating Activities
Net Income (312.0) 574.8 529.9 353.8 564.7 599.1 194.9 313.4 344.0 357.5 366.8
Adjustments to NI
Impairment of property and equipement 806.0 - - - - - - - - - -
DD&A 265.7 304.2 390.5 513.9 615.9 777.8 841.0 895.6 936.2 971.7 1,000.9
Accr. of abondment obligations obli. 12.3 7.3 11.5 13.0 8.0 11.8 16.9 18.0 18.8 19.5 20.1
Deferred Income Tax (164.8) 292.6 357.6 208.2 329.7 338.9 156.9 360.8 355.8 359.7 353.7
Stock based compensation 9.3 12.4 18.9 21.9 14.3 14.5 18.7 21.5 22.7 23.6 24.3
Derivative Instruments, net 14.5 (10.6) (3.6) (0.2) 0.2 11.9 3.0 4.5 2.3 3.0 2.0
Settlements on derivative instruments - - - - (4.1) - - - - - -
Loss on early extinguishment of debt - - - 16.2 - - - - - - -
Changes in non-current assets and liabilities 8.9 12.8 4.4 3.1 (141.2) (1.9) (1.9) (1.9) (1.9) (1.9) (1.9)
Other, net 18.5 (5.3) 5.7 4.7 0.8 - - - - - -
(Increase) decrease in receivables, net 29.9 (83.4) (48.6) 56.4 (64.8) (44.5) (1.6) (6.0) (4.4) (3.9) (3.2)
Decrease in oil and gas well equipment and supplies 49.9 34.3 32.6 4.2 14.2 - - - - - -
Other current assets - - - - - - - - - - -
Decrease in accounts payable (63.1) (8.6) (6.6) (2.6) (13.3) (14.8) (15.8) (18.0) (19.5) (25.6) (31.6)
Cash Flow from Operations 675.1 1,130.4 1,292.3 1,192.8 1,324.3 1,692.8 1,212.1 1,587.9 1,653.9 1,703.6 1,731.2
Investing Activities
Oil and gas expenditures (535.3) (959.8) (1,562.2) (1,662.7) (1,572.3) (2,130.9) (1,800.0) (1,800.0) (1,800.0) (1,800.0) (1,800.0)
Sales of oil and gas assets 119.7 34.1 117.3 311.6 61.5 451.7 - - - - -
Sale of other assets 3.3 - 112.0 1.1 31.7 8.2 - - - - -
Other capital expenditures (31.8) (51.9) (96.6) (65.0) (51.9) (76.8) - - - - -
Cash Flow from Investing (444.1) (977.6) (1,429.4) (1,415.1) (1,531.0) (1,747.8) (1,800.0) (1,800.0) (1,800.0) (1,800.0) (1,800.0)
Financing Activities
Net bank debt borrowings (195) (25) 55 (55) 174 (174.0) - - - - -
Proceeds from other long-term debt - (19.5) - 750.0 - - - - - - -
Other long-term debt payments - - - (363.6) - - - - - - -
Financing costs incurred (18.0) (0.1) (7.4) (13.8) (0.1) - - - - - -
Dividends paid (20.2) (25.5) (32.6) (39.6) (46.7) (53.8) (53.8) (53.8) (53.8) (53.8) (53.8)
Issuance of common stock and other 3.4 28.8 10.4 11.4 14.5 10.5 13.7 13.7 13.7 13.7 13.7
Cash Flow from Financing (229.8) (41.3) 25.5 289.4 141.7 (217.3) (40.1) (40.1) (40.1) (40.1) (40.1)
Credit Facility Borrowing 272.8 29.2 252.2 186.2 136.5 108.9
Cash Used for Debt Repayment - - - - - -
Cash Increase / (Decrease) 1.3 111.6 (111.7) 67.1 (65.0) 0.5 (598.9) - - - -
Beginning Cash 1.2 2.5 114.1 2.4 69.5 603.4 603.9 5.0 5.0 5.0 5.0
Ending Cash 2.5 114.1 2.4 69.5 4.5 603.9 5.0 5.0 5.0 5.0 5.0
22 January 27th
2015| KWPMP Energy Team
Ownership
Horizontal Wells
Owner Shares % Ownership
The Vanguard Group, Inc. 5,209,541 6.0%
BlackRock Institutional Trust Company, N.A. 5,004,906 5.8%
Fidelity Management & Research Company 4,446,002 5.1%
State Street Global Advisors (US) 3,030,813 3.5%
T. Rowe Price Associates, Inc. 2,557,991 2.9%
State Farm Insurance Companies 2,538,405 2.9%
Goldman Sachs Asset Management (US) 2,451,396 2.8%
Van Eck Associates Corporation 2,416,237 2.8%
Principal Global Investors (Equity) 2,209,055 2.5%
Diamond Hill Capital Management Inc. 2,205,776 2.5%
Systematic Financial Management, L.P. 2,030,703 2.3%
Lord, Abbett & Co. LLC 1,821,674 2.1%
Citadel Investment Group, L.L.C. 1,727,582 2.0%
Citi Investment Research (US) 1,579,682 1.8%
Harris Associates L.P. 1,493,219 1.7%
Artisan Partners Limited Partnership 1,446,864 1.7%
Goldman Sachs & Company, Inc. 1,123,879 1.3%
Millennium Management LLC 1,052,356 1.2%
International Value Advisers, LLC 965,706 1.1%
Fiduciary Management, Inc. 946,746 1.1%
Total 46,258,533 53.2%
Comparable Company Analysis
Capitalization EV/ EBITDAX EV/ EV/
Company Name Mkt. Cap ($M) EV ($M) TTM 31/12/2014 31/12/2015 Proved Reserves Daily Production
Energen Corporation 4,650 5,282 5.3 x 5.8 x 8.6 x 69.7 76.5
Concho Resources 12,345 17,410 8.7 x 7.5 x 10.2 x 34.6 188.9
Laredo Petroleum 1,382 2,046 3.3 x 3.8 x 6.6 x 10.0 66.6
Pioneer Natural Resources 21,997 23,709 10.5 x 9.1 x 13.3 x 29.7 61.7
Newfield Exploration 3,882 6,532 4.4 x 4.7 x 7.5 x 10.7 89.0
SM Energy 2,544 4,534 3.0 x 2.8 x 3.8 x 10.6 34.2
Maximum 21,997 23,709 10.5 x 9.1 x 13.3 x 69.7 188.9
75th Percentile 10,421 14,691 7.9 x 7.1 x 9.8 x 33.4 85.9
Median 4,266 5,907 4.9 x 5.3 x 8.0 x 20.2 71.6
25th Percentile 2,878 4,721 3.6 x 4.0 x 6.8 x 10.6 63.0
Minimum 1,382 2,046 3.0 x 2.8 x 3.8 x 10.0 34.2
Cimarex Energy 8,591 9,528 4.9 x 5.4 x 9.1 x 22.9 82.6
Capitalization EBITDAX Proved Reserves Daily Production Proved Developed Oil R / P Ratio
Company Name Mkt. Cap ($M) EV ($M) TTM 31/12/2014 31/12/2015 (MMBOE) (Mbbls) / Proved Mix % (Years)
Energen Corporation 4,650 5,282 997 903 813 75.7 69.0 459.4% 41.3% 3.0
Concho Resources 12,345 17,410 1,998 2,439 2,838 502.9 92.2 60.2% 62.8% 15.0
Laredo Petroleum 1,382 2,046 618 542 616 203.6 30.7 34.4% 48.9% 18.2
Pioneer Natural Resources 21,997 23,709 2,265 2,596 1,998 797.6 384.0 86.4% 43.9% 0.0
Newfield Exploration 3,882 6,532 1,468 1,386 1,184 612.0 73.4 54.7% 55.2% 2.2
SM Energy 2,544 4,534 1,496 1,609 1,396 428.7 132.4 49.9% 28.8% 8.9
Maximum 21,997 23,709 2,265 2,596 2,838 797.6 384.0 459.4% 62.8% 18.2
75th Percentile 10,421 14,691 1,873 2,232 1,847 584.7 122.3 79.8% 53.6% 13.4
Median 4,266 5,907 1,482 1,498 1,290 465.8 82.8 57.4% 46.4% 5.9
25th Percentile 2,878 4,721 1,115 1,024 905 259.9 70.1 51.1% 41.9% 2.4
Minimum 1,382 2,046 618 542 616 75.7 30.7 34.4% 28.8% 0.0
Cimarex Energy 8,591 9,528 1,958 1,764 1,044 416.2 115.4 84.1% 31.8% 9.9
24 January 27th
2015| KWPMP Energy Team
References
1. Capital IQ
2. XEC BAML Q4 Energy Conference
3. XEC FQ3 2014 Earnings Call Transcript
4. XEC FQ2 2014 Earnings Call Transcript
5. Oppenheimer Q1 2015 Equity Research Report
6. Societe Generale Q1 2015 Equity Research Report
7. S&P Oil Play Return Analysis

More Related Content

What's hot

Investor Presentation 2012
Investor Presentation 2012Investor Presentation 2012
Investor Presentation 2012PetroMagdalena
 
Bank of America Merrill Lynch
Bank of America Merrill LynchBank of America Merrill Lynch
Bank of America Merrill Lynch
Devon Energy Corporation
 
Teekay Tankers First Quarter 2013 Earnings Presentation
Teekay Tankers First Quarter 2013 Earnings PresentationTeekay Tankers First Quarter 2013 Earnings Presentation
Teekay Tankers First Quarter 2013 Earnings Presentation
Teekay Tankers Ltd
 
PVA Barclays Investor Presentation
PVA Barclays Investor PresentationPVA Barclays Investor Presentation
PVA Barclays Investor PresentationPennVirginiaCorp
 
PVA TOGC Investor Presentation
PVA TOGC Investor PresentationPVA TOGC Investor Presentation
PVA TOGC Investor PresentationPennVirginiaCorp
 
PVA TOGC Investor Presentation
PVA TOGC Investor PresentationPVA TOGC Investor Presentation
PVA TOGC Investor PresentationPennVirginiaCorp
 
Chesapeake energy by grace colavito
Chesapeake energy by grace colavitoChesapeake energy by grace colavito
Chesapeake energy by grace colavitomcolavito
 
PVA Investor Presentation
PVA Investor Presentation PVA Investor Presentation
PVA Investor Presentation PennVirginiaCorp
 
PVA Capital One Investor Presentation 2012
PVA Capital One Investor Presentation 2012PVA Capital One Investor Presentation 2012
PVA Capital One Investor Presentation 2012PennVirginiaCorp
 
Rengecy Energy Partners Analyst Day Presentation - Nov 2014 in Dallas, TX
Rengecy Energy Partners Analyst Day Presentation - Nov 2014 in Dallas, TXRengecy Energy Partners Analyst Day Presentation - Nov 2014 in Dallas, TX
Rengecy Energy Partners Analyst Day Presentation - Nov 2014 in Dallas, TX
Marcellus Drilling News
 
2017 1 q conference presentation tgt -final for posting
2017 1 q conference presentation tgt -final for posting2017 1 q conference presentation tgt -final for posting
2017 1 q conference presentation tgt -final for posting
investor_phillips66
 
PVA Investor Presentation December 2012
PVA Investor Presentation December 2012PVA Investor Presentation December 2012
PVA Investor Presentation December 2012PennVirginiaCorp
 
PVA Jefferies Investor Presentation 2012
PVA Jefferies Investor Presentation 2012PVA Jefferies Investor Presentation 2012
PVA Jefferies Investor Presentation 2012PennVirginiaCorp
 
PVA Wells Fargo Investor Presentation
PVA Wells Fargo Investor PresentationPVA Wells Fargo Investor Presentation
PVA Wells Fargo Investor PresentationPennVirginiaCorp
 
PVA Howard Weil Presentation
PVA Howard Weil PresentationPVA Howard Weil Presentation
PVA Howard Weil PresentationPennVirginiaCorp
 

What's hot (17)

Investor Presentation 2012
Investor Presentation 2012Investor Presentation 2012
Investor Presentation 2012
 
Bank of America Merrill Lynch
Bank of America Merrill LynchBank of America Merrill Lynch
Bank of America Merrill Lynch
 
Teekay Tankers First Quarter 2013 Earnings Presentation
Teekay Tankers First Quarter 2013 Earnings PresentationTeekay Tankers First Quarter 2013 Earnings Presentation
Teekay Tankers First Quarter 2013 Earnings Presentation
 
PMD February
PMD FebruaryPMD February
PMD February
 
PVA Barclays Investor Presentation
PVA Barclays Investor PresentationPVA Barclays Investor Presentation
PVA Barclays Investor Presentation
 
PVA TOGC Investor Presentation
PVA TOGC Investor PresentationPVA TOGC Investor Presentation
PVA TOGC Investor Presentation
 
PVA TOGC Investor Presentation
PVA TOGC Investor PresentationPVA TOGC Investor Presentation
PVA TOGC Investor Presentation
 
PVA Investor Presentation
PVA Investor PresentationPVA Investor Presentation
PVA Investor Presentation
 
Chesapeake energy by grace colavito
Chesapeake energy by grace colavitoChesapeake energy by grace colavito
Chesapeake energy by grace colavito
 
PVA Investor Presentation
PVA Investor Presentation PVA Investor Presentation
PVA Investor Presentation
 
PVA Capital One Investor Presentation 2012
PVA Capital One Investor Presentation 2012PVA Capital One Investor Presentation 2012
PVA Capital One Investor Presentation 2012
 
Rengecy Energy Partners Analyst Day Presentation - Nov 2014 in Dallas, TX
Rengecy Energy Partners Analyst Day Presentation - Nov 2014 in Dallas, TXRengecy Energy Partners Analyst Day Presentation - Nov 2014 in Dallas, TX
Rengecy Energy Partners Analyst Day Presentation - Nov 2014 in Dallas, TX
 
2017 1 q conference presentation tgt -final for posting
2017 1 q conference presentation tgt -final for posting2017 1 q conference presentation tgt -final for posting
2017 1 q conference presentation tgt -final for posting
 
PVA Investor Presentation December 2012
PVA Investor Presentation December 2012PVA Investor Presentation December 2012
PVA Investor Presentation December 2012
 
PVA Jefferies Investor Presentation 2012
PVA Jefferies Investor Presentation 2012PVA Jefferies Investor Presentation 2012
PVA Jefferies Investor Presentation 2012
 
PVA Wells Fargo Investor Presentation
PVA Wells Fargo Investor PresentationPVA Wells Fargo Investor Presentation
PVA Wells Fargo Investor Presentation
 
PVA Howard Weil Presentation
PVA Howard Weil PresentationPVA Howard Weil Presentation
PVA Howard Weil Presentation
 

Viewers also liked

Trabalho de educação ambiental
Trabalho de educação ambiental Trabalho de educação ambiental
Trabalho de educação ambiental
lanahana
 
Ambientes de-aprendizaje-propicios-para-la-enseñanza-y
Ambientes de-aprendizaje-propicios-para-la-enseñanza-yAmbientes de-aprendizaje-propicios-para-la-enseñanza-y
Ambientes de-aprendizaje-propicios-para-la-enseñanza-y
Kevin Andrid
 
Isha deshpande 8 dahlia AVEMHS
Isha deshpande 8 dahlia AVEMHSIsha deshpande 8 dahlia AVEMHS
Isha deshpande 8 dahlia AVEMHSishadeshpande10
 
Parag Parikh Long Term Value Fund - Factsheet for November 2016
Parag Parikh Long Term Value Fund - Factsheet for November 2016 Parag Parikh Long Term Value Fund - Factsheet for November 2016
Parag Parikh Long Term Value Fund - Factsheet for November 2016
PPFAS Mutual Fund
 
ETDP 2015 D1 Future Proofing and Bim for Owner Operators - Ilias Krystallis, ...
ETDP 2015 D1 Future Proofing and Bim for Owner Operators - Ilias Krystallis, ...ETDP 2015 D1 Future Proofing and Bim for Owner Operators - Ilias Krystallis, ...
ETDP 2015 D1 Future Proofing and Bim for Owner Operators - Ilias Krystallis, ...
Comit Projects Ltd
 
Robot segundo
Robot segundoRobot segundo
Robot segundo
Heiner Mora Morales
 
ETDP 2015 D1 SMAC & the Journey from Automation to Digital Factory - Snjeev K...
ETDP 2015 D1 SMAC & the Journey from Automation to Digital Factory - Snjeev K...ETDP 2015 D1 SMAC & the Journey from Automation to Digital Factory - Snjeev K...
ETDP 2015 D1 SMAC & the Journey from Automation to Digital Factory - Snjeev K...
Comit Projects Ltd
 
ETDP 2015 D1 Smart City Concept at Sellafield - John Robison, Sellafield Ltd
ETDP 2015 D1 Smart City Concept at Sellafield - John Robison, Sellafield LtdETDP 2015 D1 Smart City Concept at Sellafield - John Robison, Sellafield Ltd
ETDP 2015 D1 Smart City Concept at Sellafield - John Robison, Sellafield Ltd
Comit Projects Ltd
 
Conventional Wells.ppt
Conventional Wells.pptConventional Wells.ppt
Conventional Wells.pptJerry Beets
 
SCOOP - STACK play.ppt
SCOOP - STACK play.pptSCOOP - STACK play.ppt
SCOOP - STACK play.pptJerry Beets
 
Top 5 benefits of transforming your dev environment on cloud
Top 5 benefits of transforming your dev environment on cloudTop 5 benefits of transforming your dev environment on cloud
Top 5 benefits of transforming your dev environment on cloud
Aspire Systems
 

Viewers also liked (12)

Trabalho de educação ambiental
Trabalho de educação ambiental Trabalho de educação ambiental
Trabalho de educação ambiental
 
Ambientes de-aprendizaje-propicios-para-la-enseñanza-y
Ambientes de-aprendizaje-propicios-para-la-enseñanza-yAmbientes de-aprendizaje-propicios-para-la-enseñanza-y
Ambientes de-aprendizaje-propicios-para-la-enseñanza-y
 
Isha deshpande 8 dahlia AVEMHS
Isha deshpande 8 dahlia AVEMHSIsha deshpande 8 dahlia AVEMHS
Isha deshpande 8 dahlia AVEMHS
 
Parag Parikh Long Term Value Fund - Factsheet for November 2016
Parag Parikh Long Term Value Fund - Factsheet for November 2016 Parag Parikh Long Term Value Fund - Factsheet for November 2016
Parag Parikh Long Term Value Fund - Factsheet for November 2016
 
ETDP 2015 D1 Future Proofing and Bim for Owner Operators - Ilias Krystallis, ...
ETDP 2015 D1 Future Proofing and Bim for Owner Operators - Ilias Krystallis, ...ETDP 2015 D1 Future Proofing and Bim for Owner Operators - Ilias Krystallis, ...
ETDP 2015 D1 Future Proofing and Bim for Owner Operators - Ilias Krystallis, ...
 
Robot segundo
Robot segundoRobot segundo
Robot segundo
 
ETDP 2015 D1 SMAC & the Journey from Automation to Digital Factory - Snjeev K...
ETDP 2015 D1 SMAC & the Journey from Automation to Digital Factory - Snjeev K...ETDP 2015 D1 SMAC & the Journey from Automation to Digital Factory - Snjeev K...
ETDP 2015 D1 SMAC & the Journey from Automation to Digital Factory - Snjeev K...
 
ETDP 2015 D1 Smart City Concept at Sellafield - John Robison, Sellafield Ltd
ETDP 2015 D1 Smart City Concept at Sellafield - John Robison, Sellafield LtdETDP 2015 D1 Smart City Concept at Sellafield - John Robison, Sellafield Ltd
ETDP 2015 D1 Smart City Concept at Sellafield - John Robison, Sellafield Ltd
 
Conventional Wells.ppt
Conventional Wells.pptConventional Wells.ppt
Conventional Wells.ppt
 
SCOOP - STACK play.ppt
SCOOP - STACK play.pptSCOOP - STACK play.ppt
SCOOP - STACK play.ppt
 
Top 5 benefits of transforming your dev environment on cloud
Top 5 benefits of transforming your dev environment on cloudTop 5 benefits of transforming your dev environment on cloud
Top 5 benefits of transforming your dev environment on cloud
 
Errors in research
Errors in researchErrors in research
Errors in research
 

Similar to Cimarex Energy Buy Report

PVA BMO Investor Presentation a2013
PVA BMO Investor Presentation a2013PVA BMO Investor Presentation a2013
PVA BMO Investor Presentation a2013PennVirginiaCorp
 
PVA Investor Presentation (May 2012)
PVA Investor Presentation (May 2012)PVA Investor Presentation (May 2012)
PVA Investor Presentation (May 2012)PennVirginiaCorp
 
Energen 2012 Annual Report, Photography by Billy Brown
Energen 2012 Annual Report,  Photography by Billy BrownEnergen 2012 Annual Report,  Photography by Billy Brown
Energen 2012 Annual Report, Photography by Billy Brown
Brownroth
 
PVA Investor Presentation November
PVA Investor Presentation NovemberPVA Investor Presentation November
PVA Investor Presentation NovemberPennVirginiaCorp
 
Penn Virginia RBC Presentation
Penn Virginia RBC PresentationPenn Virginia RBC Presentation
Penn Virginia RBC PresentationPennVirginiaCorp
 
Victory Energy (VYEY) Investor Presentation
Victory Energy (VYEY) Investor PresentationVictory Energy (VYEY) Investor Presentation
Victory Energy (VYEY) Investor PresentationDerek Gradwell
 
Chevron (TMF)
Chevron (TMF)Chevron (TMF)
Chevron (TMF)Ben Black
 
I Bytes Energy Industry
I Bytes Energy IndustryI Bytes Energy Industry
I Bytes Energy Industry
EGBG Services
 
PVA June Investor Presentation
PVA June Investor PresentationPVA June Investor Presentation
PVA June Investor PresentationPennVirginiaCorp
 
PVA Howard Weil Investor Presentation
PVA Howard Weil Investor PresentationPVA Howard Weil Investor Presentation
PVA Howard Weil Investor PresentationPennVirginiaCorp
 
PVA Investor Presentation 10/12
PVA Investor Presentation 10/12PVA Investor Presentation 10/12
PVA Investor Presentation 10/12PennVirginiaCorp
 
PPT presentation 1-16
PPT presentation 1-16PPT presentation 1-16
PPT presentation 1-16Chip Whittier
 
PVA Credit Suisse Investor Presentation
PVA Credit Suisse Investor PresentationPVA Credit Suisse Investor Presentation
PVA Credit Suisse Investor PresentationPennVirginiaCorp
 
PVA IPAA OGIS NY Presentation
PVA IPAA OGIS NY PresentationPVA IPAA OGIS NY Presentation
PVA IPAA OGIS NY PresentationPennVirginiaCorp
 
Analysis of northern oil
Analysis of northern oilAnalysis of northern oil
Analysis of northern oilJustin Teo
 
PVA Howard Weil Presentation
PVA Howard Weil PresentationPVA Howard Weil Presentation
PVA Howard Weil PresentationPennVirginiaCorp
 
PVA Investor Presentation 9 -2012
PVA Investor Presentation 9 -2012PVA Investor Presentation 9 -2012
PVA Investor Presentation 9 -2012PennVirginiaCorp
 

Similar to Cimarex Energy Buy Report (20)

Chevron Stock Report
Chevron Stock ReportChevron Stock Report
Chevron Stock Report
 
PVA Investor Presentation
PVA Investor PresentationPVA Investor Presentation
PVA Investor Presentation
 
PVA BMO Investor Presentation a2013
PVA BMO Investor Presentation a2013PVA BMO Investor Presentation a2013
PVA BMO Investor Presentation a2013
 
PVA Investor Presentation (May 2012)
PVA Investor Presentation (May 2012)PVA Investor Presentation (May 2012)
PVA Investor Presentation (May 2012)
 
Energen 2012 Annual Report, Photography by Billy Brown
Energen 2012 Annual Report,  Photography by Billy BrownEnergen 2012 Annual Report,  Photography by Billy Brown
Energen 2012 Annual Report, Photography by Billy Brown
 
PVA Investor Presentation November
PVA Investor Presentation NovemberPVA Investor Presentation November
PVA Investor Presentation November
 
Penn Virginia RBC Presentation
Penn Virginia RBC PresentationPenn Virginia RBC Presentation
Penn Virginia RBC Presentation
 
Victory Energy (VYEY) Investor Presentation
Victory Energy (VYEY) Investor PresentationVictory Energy (VYEY) Investor Presentation
Victory Energy (VYEY) Investor Presentation
 
Chevron (TMF)
Chevron (TMF)Chevron (TMF)
Chevron (TMF)
 
I Bytes Energy Industry
I Bytes Energy IndustryI Bytes Energy Industry
I Bytes Energy Industry
 
PVA June Investor Presentation
PVA June Investor PresentationPVA June Investor Presentation
PVA June Investor Presentation
 
exxonmobi 2005 Annual Report
exxonmobi 2005 Annual Reportexxonmobi 2005 Annual Report
exxonmobi 2005 Annual Report
 
PVA Howard Weil Investor Presentation
PVA Howard Weil Investor PresentationPVA Howard Weil Investor Presentation
PVA Howard Weil Investor Presentation
 
PVA Investor Presentation 10/12
PVA Investor Presentation 10/12PVA Investor Presentation 10/12
PVA Investor Presentation 10/12
 
PPT presentation 1-16
PPT presentation 1-16PPT presentation 1-16
PPT presentation 1-16
 
PVA Credit Suisse Investor Presentation
PVA Credit Suisse Investor PresentationPVA Credit Suisse Investor Presentation
PVA Credit Suisse Investor Presentation
 
PVA IPAA OGIS NY Presentation
PVA IPAA OGIS NY PresentationPVA IPAA OGIS NY Presentation
PVA IPAA OGIS NY Presentation
 
Analysis of northern oil
Analysis of northern oilAnalysis of northern oil
Analysis of northern oil
 
PVA Howard Weil Presentation
PVA Howard Weil PresentationPVA Howard Weil Presentation
PVA Howard Weil Presentation
 
PVA Investor Presentation 9 -2012
PVA Investor Presentation 9 -2012PVA Investor Presentation 9 -2012
PVA Investor Presentation 9 -2012
 

Cimarex Energy Buy Report

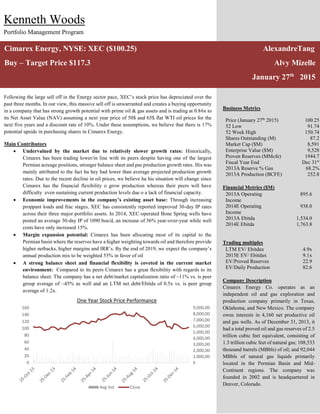
  • 1. Following the large sell off in the Energy sector pace, XEC’s stock price has depreciated over the past three months. In our view, this massive sell off is unwarranted and creates a buying opportunity in a company that has strong growth potential with prime oil & gas assets and is trading at 0.86x to its Net Asset Value (NAV) assuming a next year price of 50$ and 65$ flat WTI oil prices for the next five years and a discount rate of 10%. Under these assumptions, we believe that there is 17% potential upside in purchasing shares in Cimarex Energy. Main Contributors  Undervalued by the market due to relatively slower growth rates: Historically, Cimarex has been trading lower/in line with its peers despite having one of the largest Permian acreage positions, stronger balance sheet and pas production growth rates. His was mainly attributed to the fact ha hey had lower than average projected production growth rates. Due to the recent decline in oil prices, we believe ha his situation will change since Cimarex has the financial flexibility o grow production whereas their peers will have difficulty even sustaining current production levels due o a lack of financial capacity.  Economic improvements in the company’s existing asset base: Through increasing proppant loads and frac stages, XEC has consistently reported improved 30-day IP rates across their three major portfolio assets. In 2014, XEC-operated Bone Spring wells have posted an average 30-day IP of 1090 boe/d, an increase of 36% year-over-year while well costs have only increased 15%.  Margin expansion potential: Cimarex has been allocating most of its capital to the Permian basin where the reserves have a higher weighting towards oil and therefore provide higher netbacks, higher margins and IRR’s. By the end of 2019, we expect the company’s annual production mix to be weighted 55% in favor of oil  A strong balance sheet and financial flexibility is coveted in the current market environment: Compared to its peers Cimarex has a great flexibility with regards to its balance sheet. The company has a net debt/market capitalization ratio of ~11% vs. is peer group average of ~45% as well and an LTM net debt/Ebitda of 0.5x vs. is peer group average of 1.2x. Cimarex Energy, NYSE: XEC ($100.25) AlexandreTang Buy – Target Price $117.3 Alvy Mizelle January 27th 2015 Kenneth Woods Portfolio Management Program Business Metrics Price (January 27th 2015) 100.25 52 Low 91.74 52 Week High 150.74 Shares Outstanding (M) 87.2 Market Cap ($M) 8,591 Enterprise Value ($M) 9,528 Proven Reserves (MMcfe) 1944.7 Fiscal Year End Dec 31st 2013A Reserve % Gas 68.2% 2013A Production (BCFE) 252.8 Financial Metrics ($M) 2013A Operating Income 895.6 2014E Operating Income 938.0 2013A Ebitda 1,534.0 2014E Ebitda 1,763.8 Trading multiples LTM EV/ Ebitdax 4.9x 2015E EV/ Ebitdax 9.1x EV/Proved Reserves 22.9 EV/Daily Production 82.6 Company Description Cimarex Energy Co. operates as an independent oil and gas exploration and production company primarily in Texas, Oklahoma, and New Mexico. The company owns interests in 4,160 net productive oil and gas wells. As of December 31, 2013, it had a total proved oil and gas reserves of 2.5 trillion cubic feet equivalent, consisting of 1.3 trillion cubic feet of natural gas; 108,533 thousand barrels (MBbls) of oil; and 92,044 MBbls of natural gas liquids primarily located in the Permian Basin and Mid- Continent regions. The company was founded in 2002 and is headquartered in Denver, Colorado. 0 1,000,000 2,000,000 3,000,000 4,000,000 5,000,000 6,000,000 7,000,000 8,000,000 9,000,000 0 20 40 60 80 100 120 140 160 Avg Vol Close One Year Stock Price Performance
  • 2. 2 January 27th 2015| KWPMP Energy Team Contents Investment Thesis.......................................................................................................................................... 3 Company Overview....................................................................................................................................... 4 Asset Overview.............................................................................................................................................. 5 Permian Basin............................................................................................................................................ 5 Delaware Basin.......................................................................................................................................... 7 Increased efficiency in drilling techniques................................................................................................ 9 Cana Woodford Shale................................................................................................................................ 9 Production Overview................................................................................................................................... 11 Margin Expansion Potential .................................................................................................................... 11 Capital Expenditures Budget & Allocation .................................................................................................. 12 Balance Sheet Flexibility.............................................................................................................................. 12 Valuation ..................................................................................................................................................... 15 Production Schedule ............................................................................................................................... 15 Expense Projections ................................................................................................................................ 16 Income Statement................................................................................................................................... 17 EBITDA Schedule ..................................................................................................................................... 17 Net Asset Value ....................................................................................................................................... 18 Net Asset Value Sensitivity Analysis........................................................................................................ 19 Appendix...................................................................................................................................................... 20 Management........................................................................................................................................... 20 Cash Flow Statement............................................................................................................................... 21 Ownership ............................................................................................................................................... 22 Horizontal Wells ...................................................................................................................................... 22 Comparable Company Analysis............................................................................................................... 23 References............................................................................................................................................... 24
  • 3. 3 January 27th 2015| KWPMP Energy Team Investment Thesis We believe Cimarex Energy (XEC) is currently undervalued by the market as it continues to discount lower growth E&P`s. Historically, the company traded at a discount relative to its peers due to substandard production growth and the lack of exploration success in the Gulf Coast. However, moving forward XEC should benefit from an improving resource base supported by a disciplined spending program and a strong balance sheet. Once considered a weakness, accepting slower growth rates in order to keep a clean balance sheet, is now coveted. North American companies who took on huge levels of debt in order to take full advantage of the energy revolution are now faced with a limited number of options and may even fall into bankruptcy. Additionally, the recent decline in XEC’s stock price provides for an interesting entry point. Main Highlights: Economic improvements in the company’s existing asset base: Horizontal Volume growth is driving earnings and cash flow: Through increasing proppant loads and frac stages, XEC has consistently reported improved 30-day IP rates across their three major portfolio assets. In 2014, XEC-operated Bone Spring wells have posted an average 30-day IP of 1090 boe/d, an increase of 36% year-over-year while well costs have only increased 15%. Emerging long-lateral Wolfcamp potential provides risk/reward upside: While XEC has only drilled a handful of long-lateral Wolfcamp D wells to-date, the initial results have been outstanding: 30-day IPs over 2,500 boe/d (27% oil) from a 10,000’ lateral are sizeable improvements over XEC’s typical 1,500 boe/d IP from a 5,000’ lateral. Margin expansion potential: Initially, Cimarex’s annual production was 70% weighted towards natural gas. Due to successful drilling results in the Permian basin which is more weighted towards liquids, the company’s current production mix is 51% liquids. The company should be able to further increase its annual production. Recently has been allocating most of its capital to the Permian basin and this trend should remain constant going forward. The stacked and multi-zone reserve characteristics of this are make it more attractive for drilling operations since they generate higher EUR’s and IP rates. Also, these reserves have a higher weighting towards oil and therefore provide higher netbacks, higher margins and IRR’s. By the end of 2019, we expect the company’s annual production mix to be weighted 55% in favor of oil. A strong balance sheet and financial flexibility is coveted in the current market environment: Compared to its peers Cimarex has a great flexibility with regards to its balance sheet. The company has one of the lowest net debt/market capitalization ratios as well as the lowest net debt/Ebitda. This will allow the company to raise more debt if needed, enable the company to remain in line with its credit covenants or acquire distressed companies if the opportunity arises. The company also has ~$1.5B of capital flexibility with its undrawn $1.0B revolver and ~$500M of cash on its balance sheet. Also, both of the company’s senior notes expire after 2020 with one expiring in 2022 and the other expiring in 2024.
  • 4. 4 January 27th 2015| KWPMP Energy Team Company Overview Cimarex Energy is a mid-cap E&P based in the U.S focused on developing, producing, and marketing crude oil and natural gas. Historically, Cimarex has drilled in the Mid-Continent and Permian Basin, while also maintaining an exploration program along the Gulf Coast. As of January 2015, the company maintains 2.5 Tcfe of proved reserves, 52% of which is weighted towards natural gas. Additionally, Cimarex has increased daily production to ~870 MMcfe from 627 MMcfe in 2012. Furthermore, one of the most appealing aspects of Cimarex is the company’s strong balance sheet. As of its latest filings (Q4/14) the company harbours no bank debt, and maintains a debt to capitalization ratio of only 18%. Source: Societe Generale – Cross Asset Research
  • 5. 5 January 27th 2015| KWPMP Energy Team Asset Overview Permian Basin The Permian Basin spans 75,000 square miles and is composed of three sub-basins: the Midland Basin, Central Basin Platform, and Delaware Basin. This basin has been pumping oil since the 1920s, with production peaking at about 2 million barrels a day in the early 1970s. For decades, geologists have known that oil could be found in different layers of rock, but now drillers are starting to tap those layers simultaneously from a single site and are committing billions of dollars to do so. Unlike the more continuous nature of the Eagle Ford and Bakken Shales, the Permian has several stacked formations, from the shallow Spraberry (at 5,000-7,000 feet) to the deeper Wolfcamp Shale (at 7,000-10,000 feet) and the Mississippian (at below 11,000 feet). The multiple stacked formations lower the drilling risk for the Permian, given that if one formation is non-commercial, another one might be commerciable. Source: Energy Information Administration Also, by using horizontal drilling techniques, companies are able to drill one well with multiple laterals in multiple stacked formations, generating higher IP’s and higher EUR’s. The EIA estimates technically recoverable resources from tight oil Bone Springs and Spraberry formations at slightly less than 2 billion barrels, while Pioneer Natural Resources (one of the largest Permian operators) estimates the Midland Basin Wolfcamp Shale and Spraberry hold 50 billion barrels of resource potential. In shale formations of the Permian Basin of Texas and New Mexico, the rate of growth for oil production is set to increase for the sixth consecutive month, according to data from the EIA's drilling productivity report. The formation's growth rate is outpacing Texas' Eagle Ford, where growth slowed between February and August, and North Dakota's Bakken fields, where growth has been Permian Basin Map
  • 6. 6 January 27th 2015| KWPMP Energy Team relatively stable in recent months. Rig counts and production has been increasing significantly over the past years, due to increased technology and new oil discoveries. The increases in rig counts and production results are a testament to this area’s growth and reserve potential. The company also has one of the highest net acreage positions in the Permian Basin. Due to its strong financial flexibility and its ability to maintain its capital expenditure, Cimarex is one of the rare Permian producers that could significantly increase its production base and as a result, we believe it could out grow its peers. Source: Cimarex Energy The company has three main drilling areas: Culberson Area, Reeves County and in Ward County. Combined, the company has over 200K net acres in those areas and has drilled 2-3 horizontal well locations. In the coming years, the company plans on spending more than 75% of its capital expenditure program in these three areas with the Culberson having the biggest upside potential. Source: Cimarex Energy 80 130 135 135 150 220 0 50 100 150 200 250 Rose CWEI EGN EOG CXO XEC NetAcreagein000 Permian Drilling Areas Permian Acreage vs. Peers
  • 7. 7 January 27th 2015| KWPMP Energy Team Delaware Basin Cimarex’s two main operating areas are the Delaware basin (west Texas and southern New Mexico) and the Mid-Continent (primarily Oklahoma). Historically speaking, Cimarex began as a gas- focused company until it began focusing on the Delaware Basin. The Delaware basin recently has become a hotbed of industry activity, with multiple operators adding drilling rigs in pursuit of high- return oil-focused drilling. In 2014, XEC began to increase the number of frac stages and proppant amounts in its Bone Springs wells and has received positive results to date, reporting a 2014 average 30-day IP of 1090 boe/d per well vs. an average of 800 boe/d in 2013. In mid-2013, XEC entered into a joint venture with Chevron in order to drill long-lateral wells on its Culberson acreage. Having struggled in the past, the initial results were significant as two Wolfcamp D long-lateral wells produced 2-stream 30-day IPs over 2,500 boe/d (26% oil). Source: Cimarex Energy Wolfcamp: XEC’s Wolfcamp drilling is largely focused in Culberson, Reeves, and Ward counties (TX), where the industry is still delineating the multi-zone potential of the Wolfcamp formation. In mid-2013, XEC entered into a joint venture with Chevron (CVX) on its checkerboard Culberson county acreage in order to optimally drill long-lateral Wolfcamp wells, and the initial results were significant as two Wolfcamp D long-lateral wells produced 2-stream 30-day IPs over 2,500 boe/d (26% oil). XEC’s Culberson Wolfcamp A wells have also posted encouraging results with higher initial oil cuts (54% oil) vs. Wolfcamp D wells (26% oil). In Reeves and Ward counties, XEC has been drilling in the Wolfcamp A with notable short and long-lateral success in Reeves, though XEC is still working to optimize its landing zone in the Ward Wolfcamp A as its initial well result was mildly disappointing and contrary to broader industry results. Cimarex Delaware Basin Map
  • 8. 8 January 27th 2015| KWPMP Energy Team Source: Cimarex Energy Culberson: XEC believes its Culberson JV acreage is 100% prospective for long-lateral development while its Reeves acreage is only 50% prospective, primarily limited by lease configuration. In 2014, XEC began drilling 4 Wolfcamp down spacing pilots, with XEC’s initial 80-acre Culberson down spacing pilot producing a 4-well 30-day average of 1,100 boe/d. In 3Q14, XEC announced that its most recent 4-well 80-acre Reeves Wolfcamp A down spacing pilot produced 1,029 boe/d (49% oil), and additional results from XEC’s stacked Reeves Wolfcamp A pilot are expected later this year. Lastly, over the past few years XEC has built the Triple Crown gas gathering and processing system in Culberson and Eddy counties, enabling XEC to reduce gathering costs and provide a reliable means for gas takeaway. Furthermore, the company has nearly tripled its Permian daily production over the past years. Since, their Permian reserves have a higher weighting towards oil compared to their Mid-Continent reserves, Cimarex has been able to shift its production mix to 50% liquids and generate higher margins and netbacks Source: Cimarex Energy 29 30 34 36 40 41 46 49 43 53 59 55 58 66 68 0 10 20 30 40 50 60 70 Q1 11 Q2 11 Q3 11 Q4 11 Q1 12 Q2 12 Q3 12 Q4 12 Q1 13 Q2 13 Q3 13 Q4 13 Q1 14 Q2 14 Q3 14 Oil NGL Gas Total Q1 2011 - Q3 2014 Permian Production Growth New Mexico and Southern Texas Basins
  • 9. 9 January 27th 2015| KWPMP Energy Team Increased efficiency in drilling techniques Horizontal Volume growth is driving earnings and cash flow: Through increasing proppant loads and frac stages, XEC has consistently reported improved 30-day IP rates across their three major portfolio assets. In 2014, XEC-operated Bone Spring wells have posted an average 30-day IP of 1090 boe/d, an increase of 36% year-over-year while well costs have only increased 15%. Emerging long-lateral Wolfcamp potential provides risk/reward upside: While XEC has only drilled a handful of long-lateral Wolfcamp D wells to-date, the initial results have been outstanding: 30-day IPs over 2,500 boe/d (27% oil) from a 10,000’ lateral are sizeable improvements over XEC’s typical 1,500 boe/d IP from a 5,000’ lateral. Source: Cimarex Energy Cana Woodford Shale In the Mid-Continent, XEC’s focus is in the core of the Cana Woodford shale, a wet gas play in the Anadarko basin of western Oklahoma. XEC began drilling in the Cana in 2007 and is one of two major operators that have transitioned to full-field development in the core, drilling 9 wells per section (8 new wells + 1 parent well). XEC and its partner (DVN) reduced drilling in the Cana after natural gas prices collapsed in 2012, but recent improvements in fracking alongside a recovery in natural gas prices have rejuvenated the economics of Cana drilling, and XEC now believes its opportunities in the Cana can compete with the returns from its Permian drilling program. The majority of the improvement has come in the form of additional frac stages (now 20 stages per well, Wolfcamp long-lateral results
  • 10. 10 January 27th 2015| KWPMP Energy Team up from 10) and higher sand amounts (now 6mm lbs per well, up from 3.5mm), but XEC has also had success drilling wells on the outskirts of the core as well as drilling an extended lateral to the north of the field. These results point to further improvements in the economics and prospectively of the Cana, and XEC has chosen to take advantage by increasing their 2015 rig count and embarking on a 10-section development row in the heart of the Cana field utilizing the upsized frac technique. Source: Cimarex Energy Cimarex derives the majority of its daily production from its Cana Woodford Shale reserves. Even if this portion of their reserves is more of their legacy production, the company has more than doubled its production in this area. These reserves are also more weighted towards natural gas and has also enabled them to withstand the recent oil price decreases. The wells in this area are also less capital intensive to drill and will continue to be a large growth contributor for the coming years 160 156 184 214 230 216 216 225 255 310 404 0 50 100 150 200 250 300 350 400 450 Q1 12 Q2 12 Q3 12 Q4 12 Q1 13 Q2 13 Q3 13 Q4 13 Q1 14 Q2 14 Q3 14 Dailyproducion(MMcfe/d) Gas NGL Oil Cana Woodford Shale Drilling Operations Q1 12 – Q3 14 Cana Woodford Shale Production Growth
  • 11. 11 January 27th 2015| KWPMP Energy Team Production Overview Initially, Cimarex’s annual production was 70% weighted towards natural gas. Due to successful drilling results in the Permian basin which is more weighted towards liquids, the company’s current production mix is 51% liquids. Also, the company has nearly doubled its annual production since 2009, and with strong capital flexibility, the company should be able to further increase its annual production Margin Expansion Potential Cimarex has been allocating most of its capital to the Permian basin and this trend should remain constant going forward. The stacked and multi-zone reserve characteristics of this are make it more attractive for drilling operations since they generate higher EUR’s and IP rates. Also, these reserves have a higher weighting towards oil and therefore provide higher netbacks, higher margins and IRR’s. By the end of 2019, we expect the company’s annual production mix to be weighted 55% in favor of oil. 51.0 84.8 96.1 110.8 127.5 161.4 118.0 132.8 120.1 118.5 125.2 153.2 169.0 217.6 216.3 229.3 252.8 314.6 30% 39% 44% 48% 50% 51% 0% 10% 20% 30% 40% 50% 60% 0.0 100.0 200.0 300.0 400.0 500.0 600.0 2009A 2010A 2011A 2012A 2013A 2014E AnnualProduction(Bcfe) Gas Oil+ NGL Liquids % Annual Production 161.4 176.9 192.0 204.5 216.1 222.7 153.2 163.3 170.2 174.2 176.8 182.2 314.6 340.1 362.2 378.6 393.0 404.8 51% 52% 53% 54% 55% 55% 44% 46% 48% 50% 52% 54% 56% 0.0 100.0 200.0 300.0 400.0 500.0 600.0 700.0 800.0 900.0 2014E 2015E 2016E 2017E 2018E 2019E AnnualProduction(Bcfe) Gas Oil+ NGL Liquids % Annual Production 2009A-2014E Production Profile 2014E-2019E Production Profile
  • 12. 12 January 27th 2015| KWPMP Energy Team Capital Expenditures Budget & Allocation Cimarex is budgeting $1.95B for its exploration and development this year. This includes 80% for drilling, 14% for land, seismic, and overhead, and 6% for facilities and other expenses. The company has not approved a CAPEX budget for 2015, which will be based on several factors. The economics of all plays will be tested at both the current strip and in a bear case of $60/b oil and $3/mcf gas to determine which plays best compete for capital. Currently, its highest economic areas are Culberson County in the Permian and the Cana-Woodford, particularly with the use of new completion techniques. Source: Cimarex Energy Balance Sheet Flexibility Compared to its peers Cimarex has a great flexibility with regards to its balance sheet. The company has one of the lowest net debt/market capitalization ratios as well as the lowest net debt/ebitda. This will allow the company to raise more debt if needed, enable the company to remain in line with its credit covenants or acquire distressed companies if the opportunity arises. Mid Continent 24% Permian 74% Company MKt. Cap EV Net Debt Net Debt/Market Cap Net Debt/EBITDA Energen Corporation 4,650 5,282 631 13.6% 0.6x Concho Resources 12,345 17,410 5,066 41.0% 2.5x Laredo Petroleum 1,382 2,046 664 48.0% 1.1x Pioneer Natural Resources 21,997 23,709 1,712 7.8% 0.8x Newfield Exploration 3,882 6,532 2,650 68.3% 1.8x SM Energy 2,544 4,534 1,990 78.2% 1.3x Low 1,382 2,046 631 7.8% 0.6x Median 4,266 5,907 1,851 44.5% 1.2x High 21,997 23,709 5,066 78.2% 2.5x Cimarex 8,591 9,528 937 10.9% 0.5x 2014 Capital Allocation
  • 13. 13 January 27th 2015| KWPMP Energy Team The company also has ~$1.5B of capital flexibility with its undrawn $1.0B revolver and ~$500M of cash on its balance sheet. Also, both of the company’s senior notes expire after 2020 with one expiring in 2022 and the other expiring in 2024. This will enable the company to increase its annual production and pursue M&A activity if desired. Due to its strong production base and management’s ability to keep capital efficiency high, the company has and will be able to generate a significant amount of cash flow from operations internally. In the past years, the company has been able to fund he majority of its capital expenditures with internally generated cash and this has enabled them to maintain a strong balance sheet. In the next five years, the company will have to dip into its revolver since natural gas and oil prices should remain low in the coming year, but as oil prices rebound, the company should be able to fund the majority of its capital expenditures with internally generated cash flow. 1,000 750 750 0 200 400 600 800 1,000 1,200 2015F 2016F 2017F 2018F 2019F 2020F 2021F 2022F 2023F 2024F $M Undrawn Revolver 5.88% Senior Notes 4.44% Senior Notes 1.69 1.20 1.45 1.54 1.60 1.65 2.13 1.80 1.80 1.80 1.80 1.80 0.00 0.50 1.00 1.50 2.00 2.50 2014E 2015E 2016E 2017E 2018E 2019E $B Cash Flow from Operations Capex Debt Obligations 2014E-2019E Cash Flow from Operations vs. Capital Expenditures
  • 14. 14 January 27th 2015| KWPMP Energy Team Due to the company’s ability to generate cash internally, the company will be able to withstand the recent drop in commodity prices with the cash it has on its balance sheet and its $1.5B revolver facility. 28% 28% 50% 70% 86% 98% 0.0% 20.0% 40.0% 60.0% 80.0% 100.0% 120.0% 2014A 2015F 2016F 2017F 2018F 2019F Revolver Capacity
  • 15. 15 January 27th 2015| KWPMP Energy Team Valuation Production Schedule  In order to forecast production, we analyzed the companies capital efficiency which is calculated by dividing how many barrels replaced and added by the capital expenditures for that year o This number has been increasing in the past years since the company has been drilling more capital intensive wells in the Permian Basin and should remain constant thereafter  We also looked at the yearly decline rates and since the company is shifting most of its production towards oil, their decline rates will increase as well to 17.5% and remain constant thereafter  The company has not released their new capital budgets in light of the recent drop in oil price but according to analyst reports, capital expenditures should not be altered due to the company’s capital availability and cash flow generating ability. o Capital expenditures are expected to remain at $1.8B in the coming years  The company should be able to replace declining production as well as add ~250 MMcfe/d from 2015-2019 Cimarex Energy - Production Profile Projected Fiscal Years Ending December 31st 2009A 2010A 2011A 2012A 2013A 2014E 2015F 2016F 2017F 2018F 2019F Days in Year 365 365 365 366 365 365 365 366 365 365 365 Average Daily Production Gas (MMcf) 323.2 363.9 329.1 323.8 343.1 419.7 447.3 465.1 477.2 484.5 499.1 Natural Gas Liquids (MMBbls) 0.6 11.7 17.1 19.0 21.6 31.4 35.7 39.6 41.5 44.9 46.2 Oil (MMBbls) 22.7 27.0 26.8 31.5 36.7 42.3 45.0 47.8 51.9 53.8 55.5 Total Daily MMcfe 463.0 596.1 592.5 626.5 692.5 861.8 931.9 989.6 1,037.3 1,076.7 1,109.1 Total Annual Production Gas (Bfce) 118.0 132.8 120.1 118.5 125.2 153.2 163.3 170.2 174.2 176.8 182.2 Natural Gas Liquids (MMBbls) 0.2 4.3 6.2 7.0 7.9 11.4 13.0 14.5 15.1 16.4 16.9 Oil (MMBbls) 8.3 9.9 9.8 11.5 13.4 15.4 16.4 17.5 18.9 19.6 20.2 Total Bcfe 169.0 217.6 216.3 229.3 252.8 314.6 340.1 362.2 378.6 393.0 404.8 Decline Rate 14.00% 15.00% 15.50% 17.00% 17.00% 17.50% 17.50% 17.50% 17.50% 17.50% 17.50% Production Decline (MMcfe) 65 69 92 101 107 162 151 163 173 182 188 Production additions - 133 (4) 34 66 169 70 58 48 39 32 Capital efficieny - 10,398 5,685 8,104 7,500 8,150 8,150 8,150 8,150 8,150 8,150 Capital Expenditures Maintenance Capex (US $M) 1,320 1,229 1,329 1,411 1,479 1,536 Growth Capex (US $M) 679.9 570.9 471.0 388.6 320.6 264.5 Total Capex Spending (US $M) 535.0 960.0 1,562.0 1,663.0 1,572.0 2,000.0 1,800.0 1,800.0 1,800.0 1,800.0 1,800.0 Total Wells Drilled Proved Reserves Gas (Bcf) 1,186.6 1,254.2 1,216.4 1,251.9 1,293.5 Natural Gas Liquids (MMBbls) 1.3 41.3 65.8 89.9 92.0 Oil (MBBls) 56.8 63.7 72.3 77.9 108.6 Total Proved Reserves (Bcfe) 1,534.7 1,884.0 2,045.3 2,258.8 2,497.1 Total Proved Reserves (MMBOE) 255.8 314.0 340.9 376.5 416.2 Reserve Life Ratio (Years) 9.1 8.7 9.5 9.9 9.9 Proved Reserves % Oil 22.2% 20.3% 21.2% 20.7% 26.1%
  • 16. 16 January 27th 2015| KWPMP Energy Team Expense Projections  Excluding depreciation, Cimarex’s per MMcfe production expenses have remained constant throughout the years  A five year average of per MMcfe expenses was used in order to project future expenses Cimarex Energy - Expense Projections Projected Fiscal Years Ending December 31st ($ in Millions or Per Mcfe Where Noted) 2009A 2010A 2011A 2012A 2013A 2014E 2015F 2016F 2017F 2018F 2019F Expenses Per MMcfe of Production ($ as Stated) Production 1.1 0.9 1.1 1.1 1.1 1.1 1.1 1.1 1.1 1.1 1.1 DD&A 1.6 1.4 1.8 2.2 2.4 2.5 2.5 2.5 2.5 2.5 2.5 Accr. of Asset Retirement Obli. 0.1 0.0 0.1 0.1 0.0 0.0 0.0 0.0 0.0 0.0 0.0 Transportation and other operating 0.2 0.2 0.3 0.3 0.4 0.4 0.3 0.3 0.3 0.3 0.3 Taxes other than income 0.4 0.6 0.6 0.4 0.4 0.5 0.5 0.5 0.5 0.5 0.5 G&A (Exc. Stock-Based Comp.) 0.2 0.2 0.2 0.2 0.3 0.3 0.2 0.2 0.2 0.2 0.2 Other operating expenses 0.1 0.0 0.0 0.1 (0.5) - - - - - - Total Expenses Per MMcfe 3.7 3.4 4.1 4.4 4.2 4.7 4.6 4.6 4.6 4.6 4.6 Total Expenses Per Mmcfe excluding depreciation 2.2 2.0 2.3 2.2 1.8 2.3 2.1 2.1 2.1 2.1 2.1 Non-Production-Linked Expenses ($ in Millions) Gas gathering and processing 20.6 22.2 18.2 22.0 25.9 35.5 35.5 35.5 35.5 35.5 35.5 Derivative FV Gain / (Loss) (13.1) 62.7 10.3 0.2 (0.2) 0.2 0.2 0.2 0.2 0.2 0.2 Impairements 791.1 - - - - - - - - - - Total Non-Prod.-Linked Expense 798.6 84.9 28.5 22.2 25.7 35.8 35.8 35.8 35.8 35.8 35.8 Total Production-Linked Expenses ($ in Millions) Production 178.2 194.0 247.0 258.6 286.7 337.8 364.0 387.6 405.2 420.5 433.2 DD&A 265.7 304.2 390.5 513.9 615.9 777.8 841.0 895.6 936.2 971.7 1,000.9 Accr. of Asset Retirement Obli. 12.3 7.3 11.5 13.0 8.0 11.8 16.9 18.0 18.8 19.5 20.1 Transportation and other operating 33.8 50.0 61.8 57.4 93.6 182.3 90.9 96.8 101.1 105.0 108.1 Taxes other than income 75.6 121.8 126.5 87.0 112.7 139.4 164.4 175.1 183.1 190.0 195.7 G&A (Exc. Stock-Based Comp.) 41.7 48.6 45.3 54.4 77.5 78.7 83.2 88.6 92.6 96.2 99.1 Other operating expenses 24.3 4.6 10.3 25.0 (132.3) 0.0 - - - - - Total Production-Linked Exp 631.6 730.5 892.8 1,009.3 1,062.0 1,527.7 1,560.3 1,661.7 1,736.9 1,802.8 1,857.1
  • 17. 17 January 27th 2015| KWPMP Energy Team Income Statement  In terms of oil price projections, a price of 50$ was used for 2015 and $65 thereafter  Despite the decline in oil prices, the company should still be able to generate positive net income in the coming years EBITDA Schedule Cimarex Energy - Income Statement Projected Fiscal Year Ending December 31st ($ in Millions Except Per Share Data) 2009A 2010A 2011A 2012A 2013A 2014E 2015F 2016F 2017F 2018F 2019F Revenue Gas 485.4 653.8 530.3 340.7 471.0 693.1 587.7 612.9 627.0 636.6 655.8 Natural Gas Liquids 8.2 149.2 263.8 213.1 231.2 404.5 347.5 386.2 403.6 436.4 449.6 Oil & Condensate 468.8 755.6 909.3 1,027.8 1,250.2 1,363.6 946.9 1,176.5 1,272.2 1,320.4 1,360.2 Gas, gathering, processing and other 47.4 55.1 54.4 42.3 45.5 54.4 54.4 54.4 54.4 54.4 54.4 Total Revenue 1,009.8 1,613.7 1,757.9 1,623.9 1,998.1 2,515.6 1,936.5 2,229.8 2,357.2 2,447.8 2,519.9 Expenses Impairment of property and equipment 791.1 - - - - - - - - - - DD&A 265.7 304.2 390.5 513.9 615.9 777.8 841.0 895.6 936.2 971.7 1,000.9 Accr. of Asset Retirement Obli. 12.3 7.3 11.5 13.0 8.0 11.8 16.9 18.0 18.8 19.5 20.1 Production 178.2 194.0 247.0 258.6 286.7 337.8 364.0 387.6 405.2 420.5 433.2 Transportation and other operating 33.8 50.0 61.8 57.4 93.6 182.3 90.9 96.8 101.1 105.0 108.1 Gas gathering and processing 20.6 22.2 18.2 22.0 25.9 35.5 35.5 35.5 35.5 35.5 35.5 Taxes other than income 75.6 121.8 126.5 87.0 112.7 139.4 164.4 175.1 183.1 190.0 195.7 G&A (Exc. Stock-Based Comp.) 41.7 48.6 45.3 54.4 77.5 78.7 83.2 88.6 92.6 96.2 99.1 Stock based compensation 9.3 12.4 18.9 21.9 14.3 24.3 18.7 21.5 22.7 23.6 24.3 Derivative FV Gain / (Loss) 13.1 (62.7) (10.3) (0.2) 0.2 (0.2) - - - - - Other operating expenses 24.3 4.6 10.3 25.0 (132.3) 0.0 - - - - - Total Expenses 1,465.7 702.3 919.6 1,052.9 1,102.4 1,587.3 1,614.6 1,718.7 1,795.2 1,861.9 1,917.0 Operating Income (455.9) 911.4 838.3 571.0 895.6 938.0 322.0 511.1 562.0 585.8 603.0 Other (Income) / Expense Loss on early extinguishment of long-term debt - (3.8) - 16.2 - - - - - - - Net Interest Expense 39.8 36.6 35.6 49.3 55.0 50.3 54.7 61.3 71.3 81.1 90.7 Capitalized Interest (23.4) (29.2) (29.1) (35.2) (31.5) (37.7) (41.0) (46.0) (53.4) (60.8) (68.0) Other income 16.3 (6.0) (9.8) (19.9) (21.5) (22.2) - - - - - Total Other (Income) / Exp. 32.7 (2.4) (3.2) 10.5 1.9 (9.6) 13.7 15.3 17.8 20.3 22.7 Pre-Tax Income (488.5) 913.7 841.5 560.6 893.7 947.7 308.3 495.8 544.1 565.6 580.3 Income tax expense (benefit) (176.5) 338.95 311.5 206.7 329.0 348.6 113.4 182.4 200.2 208.0 213.5 Net Income (312.0) 574.8 529.9 353.8 564.7 599.1 194.9 313.4 344.0 357.5 366.8 Earnings Per Basic Share (3.81) 6.86 6.32 4.17 6.58 6.99 2.27 3.64 3.99 4.14 4.24 Earnings Per Diluted Share (3.81) 6.86 6.29 4.16 6.61 7.00 2.27 3.65 4.00 4.15 4.25 Cimarex Energy - Non-Cash and One-Time Expenses and EBITDA Projected Fiscal Years Ending December 31st ($ in Millions) 2009A 2010A 2011A 2012A 2013A 2014E 2015F 2016F 2017F 2018F 2019F Operating Income (455.9) 911.4 838.3 571.0 895.6 938.0 165.7 511.1 562.0 585.8 603.0 Plus Non-Cash Deriv. Change 14.5 (10.6) (3.6) (0.2) 0.2 11.9 3.0 4.5 2.3 3.0 2.0 Plus Impairment Charge 791.1 - - - - - - - - - - Plus DD&A 265.7 304.2 390.5 513.9 615.9 777.8 841.0 895.6 936.2 971.7 1,000.9 Plus Asset Retirement Accr. 12.3 7.3 11.5 13.0 8.0 11.8 16.9 18.0 18.8 19.5 20.1 Plus Stock-Based Comp. 9.3 12.4 18.9 21.9 14.3 24.3 17.2 21.5 22.7 23.6 24.3 EBITDA 637.0 1,224.7 1,255.5 1,119.7 1,534.0 1,763.8 1,043.7 1,450.7 1,541.9 1,603.6 1,650.3
  • 18. 18 January 27th 2015| KWPMP Energy Team Net Asset Value Key Assumptions:  LT decline rates: 7.0%  Discount Rate: 10.0%  Future development costs: $700M  Proved Reserves: 2.5 Tcfe  Per acreage value: o Permian: $12K o Mid-continent per acreage value: $4k o Other: $1K Price Assumptions 2015 Oil Price LT Oil Price 2015 Gas Price LT Gas Price 50.0$ 65.00$ 3.0$ 3.75$ Value ($M) $/Share Proved Reserves Cash Flow Undiscounted 12,468 145 PV-10 Proved Reserves Cash Flow 8,771 102 Undevelopped Acreage: Permian 1,680 20 Mid-Continent 420 5 Other 120 1 Total UndevelopedAcreage 2,220 26 Net Asset Value (Enterprise Value) 10,991 128 Net Debt (937) (11) Implied Equity Value 10,054 Diluted Shares Outstanding 85.7 Value/ Share 117.3 % premium / (discount) over market share price 17.0% Cimarex Energy Net Asset Valuation
  • 19. 19 January 27th 2015| KWPMP Energy Team Net Asset Value Sensitivity Analysis Sensitivity Analysis Cimarex Energy - Net Present Value Sensitivity - Oil Prices 117.32$ 7.0% 8.0% 9.0% 10.0% 11.0% 12.0% 13.0% 75.00 137.5 133.4 129.5 125.8 122.3 119.0 115.8 70.00 132.7 128.8 125.1 121.6 118.2 115.1 112.0 65.00 127.9 124.2 120.7 117.3 114.1 111.1 108.2 60.00 123.1 119.6 116.3 113.1 110.0 107.2 104.4 55.00 118.4 115.0 111.8 108.8 105.9 103.2 100.6 50.00 113.6 110.4 107.4 104.6 101.8 99.3 96.8 Cimarex Energy - Valuation Upside 0.17$ 7.0% 8.0% 9.0% 10.0% 11.0% 12.0% 13.0% 75.00 37% 33% 29% 26% 22% 19% 16% 70.00 32% 28% 25% 21% 18% 15% 12% 65.00 28% 24% 20% 17% 14% 11% 8% 60.00 23% 19% 16% 13% 10% 7% 4% 55.00 18% 15% 12% 9% 6% 3% 0% 50.00 13% 10% 7% 4% 2% -1% -3% Cimarex Energy - Net Present Value Sensitivity - Oil & Natural Gas Prices 117.32$ 50.00 55.00 60.00 65.00 70.00 75.00 80.00 5.75 117.7 122.0 126.2 130.5 134.7 139.0 143.2 4.75 111.2 115.4 119.7 123.9 128.2 132.4 136.7 3.75 104.6 108.8 113.1 117.3 121.6 125.9 130.1 2.75 98.0 102.3 106.5 110.8 115.0 119.3 123.5 1.75 91.4 95.7 100.0 104.2 108.5 112.7 117.0 0.75 84.9 89.1 93.4 97.6 101.9 106.2 110.4 NaturalGasPrices ($/Mcfe) OilPrices ($/Bbl) OilPrices Discount Rate Oil Prices ($/Bbl) Discount Rate
  • 20. 20 January 27th 2015| KWPMP Energy Team Appendix Management Thomas E. Jorden – President & CEO Tom Jorden was named President and Chief Executive Officer of Cimarex in September 2011 and Chairman of the Board in August 2012. Mr. Jorden previously served as Executive Vice President of Exploration since the formation of Cimarex in December 2003 and held that same position at Key Production Company, Inc., Cimarex’s predecessor. He joined Key in November 1993 as Chief Geophysicist and later as Vice President of Exploration (October 1999 to September 2002). Prior to joining Key, Mr. Jorden was with Union Pacific Resources and Superior Oil Company. He is a graduate of the Colorado School of Mines where he earned B.S. and M.S. degrees in Geophysics. Joseph R. Albi – Executive VP & COO Joe Albi was named Executive Vice President and Chief Operating Officer of Cimarex and elected to its board of directors in September 2011. He previously served as Executive Vice President of Operations since March 2005 and Senior Vice President of Corporate Engineering since December 2003. He joined Key Production Company, Inc. in 1994 where he held positions of increasing responsibility prior to its merger with Cimarex. Prior to joining Key, Mr. Albi was with Black Dome Energy Corporation, Apache Corporation and Nicor Exploration Company. Mr. Albi is a graduate of the Colorado School of Mines where he earned a B.S. in Petroleum Engineering and a M.S. in Mineral Economics. Stephen P. Bell – Executive VP of Business Development Steve Bell was named Executive Vice President of Business Development in September 2012. Mr. Bell was appointed Senior Vice President of Business Development and Land in September 2002. Prior to its merger with Cimarex, Mr. Bell was with Key Production Company, Inc. He joined Key in 1994 and in September 1999 was appointed Senior Vice President of Business Development and Land. From February 1994 to September 1999 he served as Vice President of Land.
  • 21. 21 January 27th 2015| KWPMP Energy Team Cash Flow Statement Cimarex Energy - Cash Flow Statement Projected Fiscal Years Ending December 31st ($ in Millions) 2009A 2010A 2011A 2012A 2013A 2014E 2015F 2016F 2017F 2018F 2018F Operating Activities Net Income (312.0) 574.8 529.9 353.8 564.7 599.1 194.9 313.4 344.0 357.5 366.8 Adjustments to NI Impairment of property and equipement 806.0 - - - - - - - - - - DD&A 265.7 304.2 390.5 513.9 615.9 777.8 841.0 895.6 936.2 971.7 1,000.9 Accr. of abondment obligations obli. 12.3 7.3 11.5 13.0 8.0 11.8 16.9 18.0 18.8 19.5 20.1 Deferred Income Tax (164.8) 292.6 357.6 208.2 329.7 338.9 156.9 360.8 355.8 359.7 353.7 Stock based compensation 9.3 12.4 18.9 21.9 14.3 14.5 18.7 21.5 22.7 23.6 24.3 Derivative Instruments, net 14.5 (10.6) (3.6) (0.2) 0.2 11.9 3.0 4.5 2.3 3.0 2.0 Settlements on derivative instruments - - - - (4.1) - - - - - - Loss on early extinguishment of debt - - - 16.2 - - - - - - - Changes in non-current assets and liabilities 8.9 12.8 4.4 3.1 (141.2) (1.9) (1.9) (1.9) (1.9) (1.9) (1.9) Other, net 18.5 (5.3) 5.7 4.7 0.8 - - - - - - (Increase) decrease in receivables, net 29.9 (83.4) (48.6) 56.4 (64.8) (44.5) (1.6) (6.0) (4.4) (3.9) (3.2) Decrease in oil and gas well equipment and supplies 49.9 34.3 32.6 4.2 14.2 - - - - - - Other current assets - - - - - - - - - - - Decrease in accounts payable (63.1) (8.6) (6.6) (2.6) (13.3) (14.8) (15.8) (18.0) (19.5) (25.6) (31.6) Cash Flow from Operations 675.1 1,130.4 1,292.3 1,192.8 1,324.3 1,692.8 1,212.1 1,587.9 1,653.9 1,703.6 1,731.2 Investing Activities Oil and gas expenditures (535.3) (959.8) (1,562.2) (1,662.7) (1,572.3) (2,130.9) (1,800.0) (1,800.0) (1,800.0) (1,800.0) (1,800.0) Sales of oil and gas assets 119.7 34.1 117.3 311.6 61.5 451.7 - - - - - Sale of other assets 3.3 - 112.0 1.1 31.7 8.2 - - - - - Other capital expenditures (31.8) (51.9) (96.6) (65.0) (51.9) (76.8) - - - - - Cash Flow from Investing (444.1) (977.6) (1,429.4) (1,415.1) (1,531.0) (1,747.8) (1,800.0) (1,800.0) (1,800.0) (1,800.0) (1,800.0) Financing Activities Net bank debt borrowings (195) (25) 55 (55) 174 (174.0) - - - - - Proceeds from other long-term debt - (19.5) - 750.0 - - - - - - - Other long-term debt payments - - - (363.6) - - - - - - - Financing costs incurred (18.0) (0.1) (7.4) (13.8) (0.1) - - - - - - Dividends paid (20.2) (25.5) (32.6) (39.6) (46.7) (53.8) (53.8) (53.8) (53.8) (53.8) (53.8) Issuance of common stock and other 3.4 28.8 10.4 11.4 14.5 10.5 13.7 13.7 13.7 13.7 13.7 Cash Flow from Financing (229.8) (41.3) 25.5 289.4 141.7 (217.3) (40.1) (40.1) (40.1) (40.1) (40.1) Credit Facility Borrowing 272.8 29.2 252.2 186.2 136.5 108.9 Cash Used for Debt Repayment - - - - - - Cash Increase / (Decrease) 1.3 111.6 (111.7) 67.1 (65.0) 0.5 (598.9) - - - - Beginning Cash 1.2 2.5 114.1 2.4 69.5 603.4 603.9 5.0 5.0 5.0 5.0 Ending Cash 2.5 114.1 2.4 69.5 4.5 603.9 5.0 5.0 5.0 5.0 5.0
  • 22. 22 January 27th 2015| KWPMP Energy Team Ownership Horizontal Wells Owner Shares % Ownership The Vanguard Group, Inc. 5,209,541 6.0% BlackRock Institutional Trust Company, N.A. 5,004,906 5.8% Fidelity Management & Research Company 4,446,002 5.1% State Street Global Advisors (US) 3,030,813 3.5% T. Rowe Price Associates, Inc. 2,557,991 2.9% State Farm Insurance Companies 2,538,405 2.9% Goldman Sachs Asset Management (US) 2,451,396 2.8% Van Eck Associates Corporation 2,416,237 2.8% Principal Global Investors (Equity) 2,209,055 2.5% Diamond Hill Capital Management Inc. 2,205,776 2.5% Systematic Financial Management, L.P. 2,030,703 2.3% Lord, Abbett & Co. LLC 1,821,674 2.1% Citadel Investment Group, L.L.C. 1,727,582 2.0% Citi Investment Research (US) 1,579,682 1.8% Harris Associates L.P. 1,493,219 1.7% Artisan Partners Limited Partnership 1,446,864 1.7% Goldman Sachs & Company, Inc. 1,123,879 1.3% Millennium Management LLC 1,052,356 1.2% International Value Advisers, LLC 965,706 1.1% Fiduciary Management, Inc. 946,746 1.1% Total 46,258,533 53.2%
  • 23. Comparable Company Analysis Capitalization EV/ EBITDAX EV/ EV/ Company Name Mkt. Cap ($M) EV ($M) TTM 31/12/2014 31/12/2015 Proved Reserves Daily Production Energen Corporation 4,650 5,282 5.3 x 5.8 x 8.6 x 69.7 76.5 Concho Resources 12,345 17,410 8.7 x 7.5 x 10.2 x 34.6 188.9 Laredo Petroleum 1,382 2,046 3.3 x 3.8 x 6.6 x 10.0 66.6 Pioneer Natural Resources 21,997 23,709 10.5 x 9.1 x 13.3 x 29.7 61.7 Newfield Exploration 3,882 6,532 4.4 x 4.7 x 7.5 x 10.7 89.0 SM Energy 2,544 4,534 3.0 x 2.8 x 3.8 x 10.6 34.2 Maximum 21,997 23,709 10.5 x 9.1 x 13.3 x 69.7 188.9 75th Percentile 10,421 14,691 7.9 x 7.1 x 9.8 x 33.4 85.9 Median 4,266 5,907 4.9 x 5.3 x 8.0 x 20.2 71.6 25th Percentile 2,878 4,721 3.6 x 4.0 x 6.8 x 10.6 63.0 Minimum 1,382 2,046 3.0 x 2.8 x 3.8 x 10.0 34.2 Cimarex Energy 8,591 9,528 4.9 x 5.4 x 9.1 x 22.9 82.6 Capitalization EBITDAX Proved Reserves Daily Production Proved Developed Oil R / P Ratio Company Name Mkt. Cap ($M) EV ($M) TTM 31/12/2014 31/12/2015 (MMBOE) (Mbbls) / Proved Mix % (Years) Energen Corporation 4,650 5,282 997 903 813 75.7 69.0 459.4% 41.3% 3.0 Concho Resources 12,345 17,410 1,998 2,439 2,838 502.9 92.2 60.2% 62.8% 15.0 Laredo Petroleum 1,382 2,046 618 542 616 203.6 30.7 34.4% 48.9% 18.2 Pioneer Natural Resources 21,997 23,709 2,265 2,596 1,998 797.6 384.0 86.4% 43.9% 0.0 Newfield Exploration 3,882 6,532 1,468 1,386 1,184 612.0 73.4 54.7% 55.2% 2.2 SM Energy 2,544 4,534 1,496 1,609 1,396 428.7 132.4 49.9% 28.8% 8.9 Maximum 21,997 23,709 2,265 2,596 2,838 797.6 384.0 459.4% 62.8% 18.2 75th Percentile 10,421 14,691 1,873 2,232 1,847 584.7 122.3 79.8% 53.6% 13.4 Median 4,266 5,907 1,482 1,498 1,290 465.8 82.8 57.4% 46.4% 5.9 25th Percentile 2,878 4,721 1,115 1,024 905 259.9 70.1 51.1% 41.9% 2.4 Minimum 1,382 2,046 618 542 616 75.7 30.7 34.4% 28.8% 0.0 Cimarex Energy 8,591 9,528 1,958 1,764 1,044 416.2 115.4 84.1% 31.8% 9.9
  • 24. 24 January 27th 2015| KWPMP Energy Team References 1. Capital IQ 2. XEC BAML Q4 Energy Conference 3. XEC FQ3 2014 Earnings Call Transcript 4. XEC FQ2 2014 Earnings Call Transcript 5. Oppenheimer Q1 2015 Equity Research Report 6. Societe Generale Q1 2015 Equity Research Report 7. S&P Oil Play Return Analysis