Download as PDF, PPTX


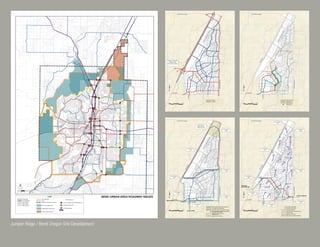


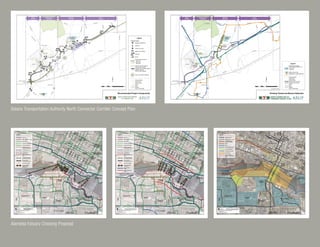


The document provides information about plans to extend BART service from Fremont to Silicon Valley in California. It discusses the vision for transit-oriented development around new BART stations to encourage housing and jobs growth while respecting existing neighborhoods. Each city along the corridor is working to meet regional planning objectives. When averaged across the corridor, future housing is expected to exceed targets, indicating support for the BART expansion investment. Diagrams show existing and planned housing and jobs near each station.


