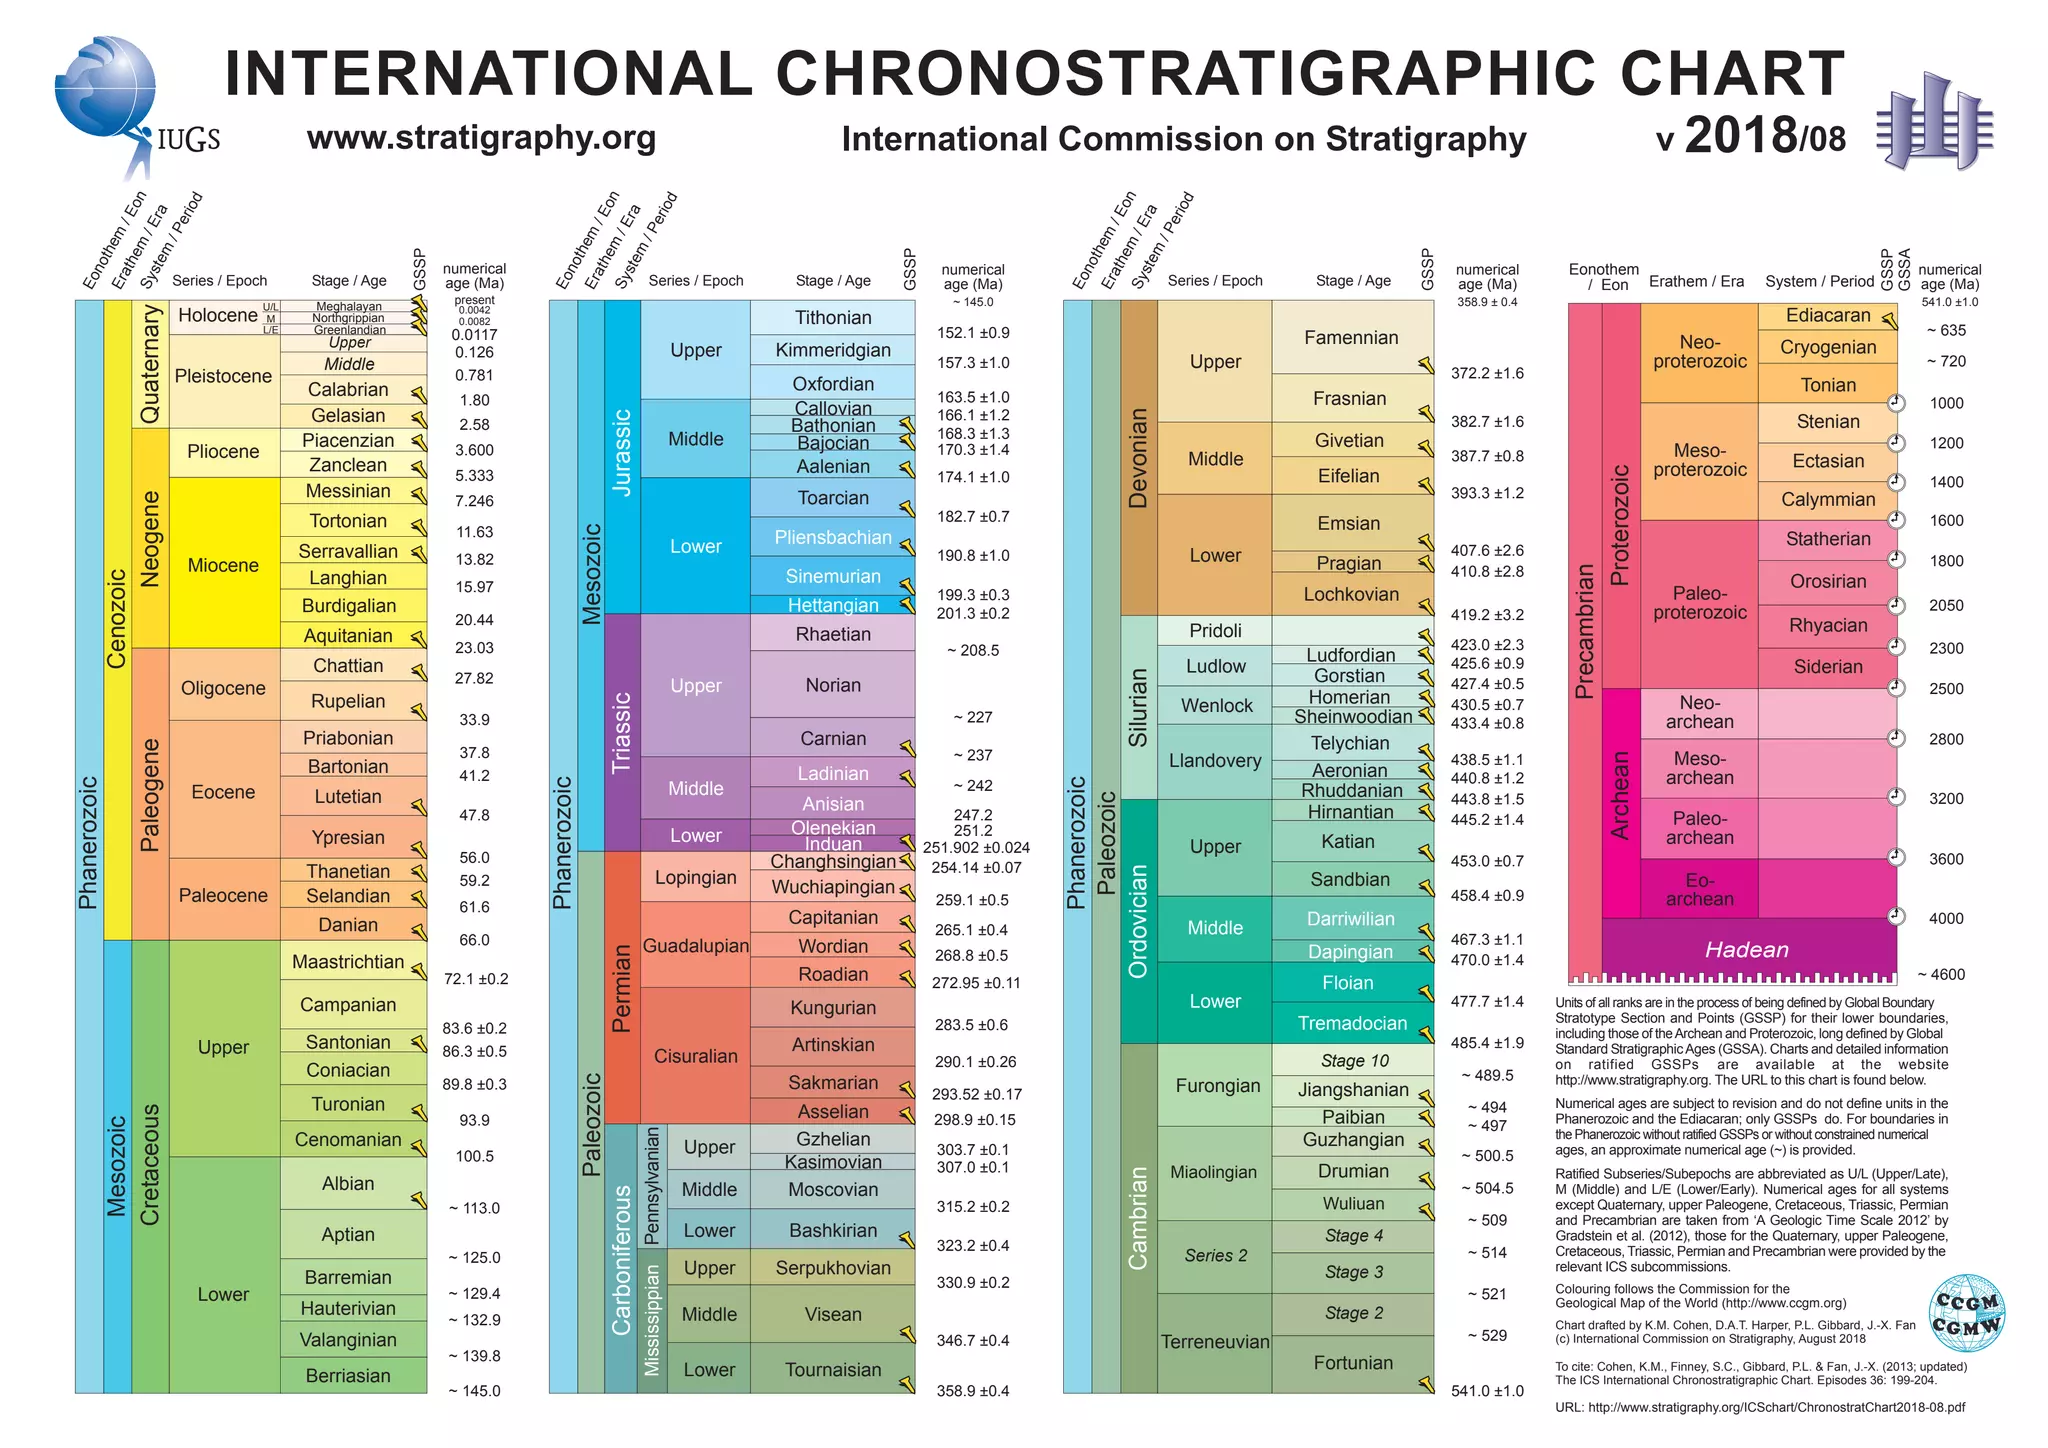
Phanerozoic
Cenozoic
Quaternary
Holocene
Pleistocene
Pliocene
Miocene
Oligocene
Eocene
Paleocene
NeogenePaleogene
Upper
Lower
Cretaceous
Mesozoic
TriassicCarboniferous
Mesozoic
PermianJurassic
Upper
Lower
Middle
Upper
Lower
Middle
Lopingian
Guadalupian
Cisuralian
Upper
Lower
Upper
Middle
Middle
Lower
MississippianPennsylvanian
Paleozoic
Middle
Upper
Calabrian
Gelasian
Piacenzian
Zanclean
Messinian
Tortonian
Serravallian
Langhian
Burdigalian
Aquitanian
Chattian
Rupelian
Priabonian
Bartonian
Lutetian
Ypresian
Thanetian
Selandian
Danian
Maastrichtian
Campanian
Santonian
Coniacian
Turonian
Cenomanian
Albian
Aptian
Barremian
Hauterivian
Valanginian
Berriasian
Tithonian
Kimmeridgian
Oxfordian
Callovian
Bathonian
Bajocian
Aalenian
Toarcian
Pliensbachian
Sinemurian
Hettangian
Rhaetian
Norian
Carnian
Ladinian
Anisian
Olenekian
Induan
Changhsingian
Wuchiapingian
Capitanian
Wordian
Roadian
Kungurian
Artinskian
Sakmarian
Gzhelian
Famennian
Frasnian
Givetian
Eifelian
Emsian
Pragian
Lochkovian
Ludfordian
Gorstian
Homerian
Sheinwoodian
Telychian
Aeronian
Rhuddanian
Hirnantian
Katian
Sandbian
Darriwilian
Dapingian
Floian
Tremadocian
Stage 10
Jiangshanian
Paibian
Guzhangian
Drumian
Wuliuan
Stage 4
Stage 3
Stage 2
Fortunian
Kasimovian
Moscovian
Bashkirian
Serpukhovian
Visean
Tournaisian
Terreneuvian
Series 2
Miaolingian
Furongian
Cambrian
Upper
Lower
Middle
Llandovery
Wenlock
Ludlow
Pridoli
Upper
Middle
Lower
SilurianDevonianOrdovician
Paleozoic
Phanerozoic
Phanerozoic
Asselian
Hadean
Archean
Precambrian
Proterozoic
Neo-
proterozoic
Meso-
proterozoic
Paleo-
proterozoic
Neo-
archean
Meso-
archean
Paleo-
archean
Eo-
archean
Ediacaran
Cryogenian
Tonian
Stenian
Ectasian
Calymmian
Statherian
Orosirian
Rhyacian
Siderian
Greenlandian
Meghalayan
Northgrippian
U/L
L/E
M
0.0117
0.126
0.781
1.80
2.58
3.600
5.333
7.246
11.63
13.82
15.97
20.44
23.03
27.82
33.9
37.8
41.2
47.8
56.0
59.2
61.6
66.0
72.1 Âą0.2
83.6 Âą0.2
86.3 Âą0.5
89.8 Âą0.3
93.9
100.5
~ 113.0
~ 125.0
~ 129.4
~ 132.9
~ 139.8
~ 145.0
~ 145.0
152.1 Âą0.9
157.3 Âą1.0
163.5 Âą1.0
166.1 Âą1.2
168.3 Âą1.3
170.3 Âą1.4
174.1 Âą1.0
182.7 Âą0.7
190.8 Âą1.0
199.3 Âą0.3
201.3 Âą0.2
~ 208.5
~ 227
254.14 Âą0.07
259.1 Âą0.5
265.1 Âą0.4
268.8 Âą0.5
272.95 Âą0.11
283.5 Âą0.6
290.1 Âą0.26
303.7 Âą0.1
307.0 Âą0.1
315.2 Âą0.2
323.2 Âą0.4
330.9 Âą0.2
346.7 Âą0.4
358.9 Âą0.4
298.9 Âą0.15
293.52 Âą0.17
~ 237
~ 242
247.2
251.2
251.902 Âą0.024
358.9 Âą 0.4
372.2 Âą1.6
382.7 Âą1.6
387.7 Âą0.8
393.3 Âą1.2
407.6 Âą2.6
410.8 Âą2.8
419.2 Âą3.2
423.0 Âą2.3
425.6 Âą0.9
427.4 Âą0.5
430.5 Âą0.7
433.4 Âą0.8
438.5 Âą1.1
440.8 Âą1.2
443.8 Âą1.5
445.2 Âą1.4
453.0 Âą0.7
458.4 Âą0.9
467.3 Âą1.1
470.0 Âą1.4
477.7 Âą1.4
485.4 Âą1.9
541.0 Âą1.0
~ 489.5
~ 494
~ 497
~ 500.5
~ 504.5
~ 509
~ 514
~ 521
~ 529
541.0 Âą1.0
~ 635
1000
1200
1400
1600
1800
2050
2300
2500
2800
3200
3600
4000
~ 4600
present
~ 720
0.0042
0.0082
Series / Epoch Stage / Age
numerical
age (Ma)
Eonothem
/Eon
Erathem
/Era
System
/Period
Series / Epoch Stage / Age
numerical
age (Ma)
Eonothem
/Eon
Erathem
/Era
System
/Period
Series / Epoch Stage / Age
numerical
age (Ma) System / PeriodErathem / Era
numerical
age (Ma)
Eonothem
/Eon
Erathem
/Era
System
/Period
Eonothem
/ Eon
GSSP
GSSP
GSSP
GSSP
GSSA
INTERNATIONAL CHRONOSTRATIGRAPHIC CHART
International Commission on Stratigraphywww.stratigraphy.org
Colouring follows the Commission for the
Geological Map of the World (http://www.ccgm.org)
Chart drafted by K.M. Cohen, D.A.T. Harper, P.L. Gibbard, J.-X. Fan
(c) International Commission on Stratigraphy, August 2018
To cite: Cohen, K.M., Finney, S.C., Gibbard, P.L. & Fan, J.-X. (2013; updated)
The ICS International Chronostratigraphic Chart. Episodes 36: 199-204.
URL: http://www.stratigraphy.org/ICSchart/ChronostratChart2018-08.pdf
Units of all ranks are in the process of being defined by Global Boundary
Stratotype Section and Points (GSSP) for their lower boundaries,
including those of theArchean and Proterozoic, long defined by Global
Standard StratigraphicAges (GSSA). Charts and detailed information
on ratified GSSPs are available at the website
http://www.stratigraphy.org. The URL to this chart is found below.
Numerical ages are subject to revision and do not define units in the
Phanerozoic and the Ediacaran; only GSSPs do. For boundaries in
the Phanerozoic without ratified GSSPs or without constrained numerical
ages, an approximate numerical age (~) is provided.
Ratified Subseries/Subepochs are abbreviated as U/L (Upper/Late),
M (Middle) and L/E (Lower/Early). Numerical ages for all systems
except Quaternary, upper Paleogene, Cretaceous, Triassic, Permian
and Precambrian are taken from ‘A Geologic Time Scale 2012’ by
Gradstein et al. (2012), those for the Quaternary, upper Paleogene,
Cretaceous, Triassic, Permian and Precambrian were provided by the
relevant ICS subcommissions.
v 2018/08

Chronostrat chart2018 08