Download to read offline


![You can place your order in the following alternative ways: Order online at www.researchinchina.com Fax order sheet to us at fax number:+86 10 82601570 3. Email your order to: [email_address] 4. Phone us at +86 10 82600828/ 82600893 Choose type of format Hard copy …………………………1900 USD PDF (Single user license) ………......1800 USD PDF (Enterprisewide license)….. ......2700 USD ※ Reports will be dispatched immediately once full payment has been received. Payment may be made by wire transfer or credit card via Paypal. Room 1008, A2, Tower A, Changyuan Tiandi Building, No. 18, Suzhou Street, Haidian District, Beijing, China 100080 Phone: +86 10 82600828 ● Fax: +86 10 82601570 ● www.researchinchina.com ● [email_address] How to Buy Party A: Name: Address: Contact Person: Tel E-mail: Fax Party B: Name: Beijing Waterwood Technologies Co., Ltd (ResearchInChina) Address: Room 1008, A2, Tower A, Changyuan Tiandi Building, No. 18, Suzhou Street, Haidian District, Beijing, China 100080 Contact Person: Liao Yan Phone: 86-10-82600828 E-mail: [email_address] Fax: 86-10-82601570 Bank details: Beneficial Name: Beijing Waterwood Technologies Co., Ltd Bank Name: Bank of Communications, Beijing Branch Bank Address: NO.1 jinxiyuan shijicheng,Landianchang,Haidian District,Beijing Bank Account No #: 110060668012015061217 Routing No # : 332906 Bank SWIFT Code: COMMCNSHBJG Title Format Cost Total](https://image.slidesharecdn.com/chinaheparinindustryreport2010-2011-111011220319-phpapp01/85/China-heparin-industry-report-2010-2011-9-320.jpg)

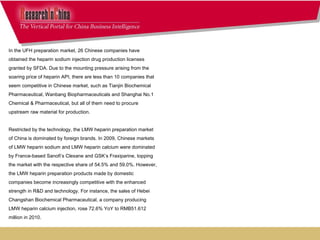
This document analyzes and summarizes the status and development of China's heparin industry from 2010-2011. It focuses on the heparin API and preparation industries, and highlights major manufacturers in China. Europe and America are the largest export markets for China's heparin API. There are 24 licensed heparin API manufacturers in China, with exports reaching 15.9 trillion units in 2010, accounting for 52.1% of the global market share. The production of heparin preparations, including unfractionated heparin and low-molecular-weight heparin, is still developing in China.


