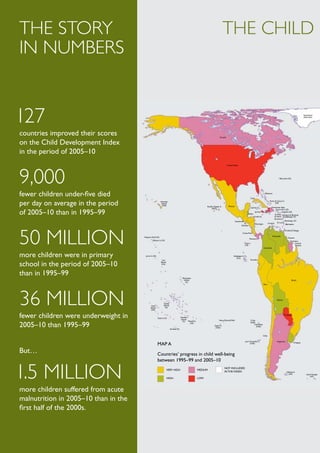
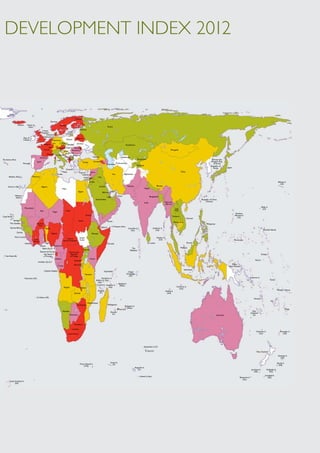
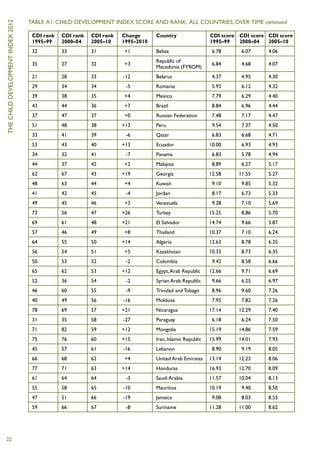
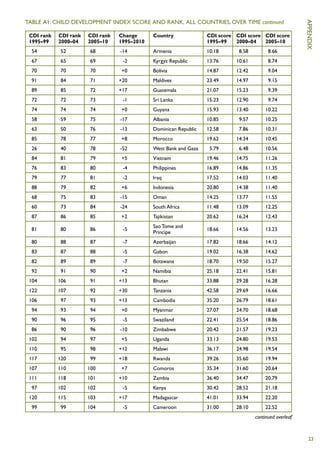
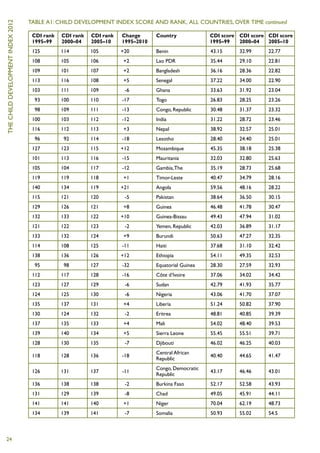
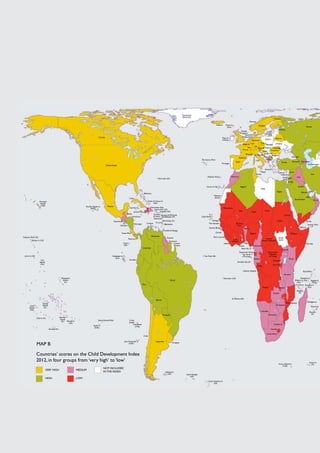
The Child Development
index 2012
Progress, challenges and inequality
The story                                                                                                                                THE CHILD
in numbers


127                                                                                                                                                                                                                                                Greenland
                                                                                                                                                                                                                                                   (Denmark)


countries improved their scores                                                                                                     Canada


on the Child Development Index
in the period of 2005­ 10
                     –
                                                                                                                                             United States


9,000                                                                                                                                                                                                                Bermuda (UK)


fewer children under-five died                                                                                                                                               Cuba
                                                                                                                                                                                                  Bahamas


per day on average in the period                            Hawaiian
                                                             Islands
                                                              (USA)                                                  Revilla Gigedo Is        Mexico
                                                                                                                                                                             Cayman Is
                                                                                                                                                                                                          Turks & Caicos Is
                                                                                                                                                                                                                (UK)

                                                                                                                                                                                                            Dominican Rep.
                                                                                                                           (Mex)

of 2005–10 than in 1995–99
                                                                                                                                                                                                                Puerto Rico (US)
                                                                                                                                                                                    Jamaica      Haiti                 Anguilla (UK)
                                                                                                                                                                         Belize                                St Kitts Antigua & Barbuda
                                                                                                                                                                                  Honduras                     & Nevis Guadeloupe (Fr)
                                                                                                                                                                                                               Dominica
                                                                                                                                                         Guatemala                                                         Martinique (Fr)
                                                                                                                                                                   El              Nicaragua            Curaçao St Lucia Barbados
                                                                                                                                                               Salvador


50 million
                                                                                                                                                                                                                            Trinidad & Tobago
                                                                                                                                                                Costa Rica
                                      Kingman Reef (US)                                                                                                                                                      Venezuela
                                                                                                                                                                             Panama                                             Guyana
                                                Palmyra Is (US)                                                                                                                                                                    Suriname
                                                                                                                                                                     Cocos                                                               French
                                                                                                                                                                     (CR)                                                                Guiana
                                                                                                                                                                                                Colombia


more children were in primary          Jarvis Is (US)
                                                              Line
                                                                                                                                                    Galapagos Is
                                                                                                                                                       (Ecu)
                                                                                                                                                                              Ecuador

school in the period of 2005–10                             Islands
                                                             (Kiri)


than in 1995–99                                                                            Marquesas
                                                                                            Islands                                                                                                                                    Brazil
                                                                                              (Fr)
                                                                                                                                                                                                Peru


36 million                                    Cook
                                             Islands
                                              (NZ)
                                                                Society
                                                                Islands
                                                                  (Fr)
                                                                                                                                                                                                                  Bolivia


fewer children were underweight in                      Tubai Is (Fr)                    Gambier
                                                                                          Islands                                  Sala-y-Gómez(Chile)                       S Felix
                                                                                                                                                                                                                            Paraguay


                                                                                            (Fr) Pitcairn Is

2005–10 than 1995–99                                                                                (UK)                                                                     (Chile)
                                                                                                                                                                                   S Ambrosio
                                                                                                                             Easter Is                                               (Chile)
                                                                                                                              (Chile)
                                                                          De Bass (Fr)


                                                                                                                                                                                                Chile

                                                                                                                                                                      Juan Fernandez Is                           Argentina
                                                        MAP A                                                                                                               (Chile)                                                      Uruguay


But…                                                    Countries’ progress in child well-being
                                                        between 1995–99 and 2005–10


1.5 million                                                           VERY HIGH

                                                                      HIGH
                                                                                                               MEDIUM

                                                                                                               LOW
                                                                                                                                         NOT INCLUDED
                                                                                                                                         IN THE INDEX                                                                         Falkland Is
                                                                                                                                                                                                                                 (UK)                South Georgia
                                                                                                                                                                                                                                                         (UK)


more children suffered from acute
malnutrition in 2005–10 than in the
first half of the 2000s.
DEVELOPMENT INDEX 2012


                                                                                                      Finland
                                                                     Norway
                     Iceland       Faeroe Is                                     Sweden
                                    (Den)                                                                                                             Russia
                                                                                                             Estonia
                                                        United                              Latvia
                                                       Kingdom                           Lithuania
                                                             Denmark
                               Rep of                    Netherlands
                                                                                    Poland       Belarus
                               Ireland                              Germany
                                                         Belgium Lux.         Cze.
                                                                                     Slovakia Ukraine                                                                           Kazakhstan
                                                                      Lie.
                                                               Swi.        AustriaHungary Moldova
                                                        France              Slov.          Romania                                                                                                                                               Mongolia
                                                                                  Cro.
                                                                                       Serbia
                                                            Monaco San Marino Bos.
                                                                                             Bulgaria
                                                     Andorra                       Mon. Kos.
                                                                                         FYR                                    Georgia                                 Uzbekistan
The Azores (Port)                                                                    Alb.Mac.                                                                                                    Kyrgyzstan                                                                                 Democratic
                                                                        Italy
                                                  Spain                                                 Turkey                   Armenia                                                                                                                                                    People’s Rep
                             Portugal                                                                                                              AzerbaijanTurkmenistan                                                                                                                     of Korea
                                                                                                                                                                                                Tajikistan                                                                                 Republic of
                                                                                                                                                                                                                                                                                              Korea             Japan
                                                                                         Greece
                                                                                     Malta                 Cyprus       Syria                                                                                                                                 China
                                                                           Tunisia                            Lebanon                                      Iran            Afghanistan
       Madeira (Port)                     Morocco                                                               Israel                Iraq
                                                                                                                       OPT.
                                                                                                                 OPT.
                                                                                                                         Jordan                                                                                                                                                                                                                                                   Midway Is
                                                                                                                                                                                                                                                                                                                                                                                    (US)
      Canary Is (Sp)                                   Algeria                                                                            Kuwait                                   Pakistan                                  Bhutan
                                                                                  Libya                                                                                                                      Nepal
                                                                                                           Egypt                             Bahrain Qatar
               Western                                                                                                                                             Oman                                              Bangladesh
               Sahara                                                                                                                              UAE
                                                                                                                                    Saudi Arabia                                                                                                                                 Republic of China
                                                                                                                                                                                                                                          Myanmar                                    (Taiwan)
                                                                                                                                                                                                             India
                                                                                                                                                                                                                                          (Burma)
                                                                                                                                                                                                                                                                                                                                                            Wake Is
                                Mauretania                                                                                                                                                                                                              Lao                                                                                                  (US)
                                                     Mali                                Chad                                                                                                                                                           PDR
                                                                      Niger
                                                                                                                                                                                                                                                                                                                        Northern
                                                                                                                     Eritrea                                                                                                                                                                                            Mariana Is
Cape Verde                                                                                                                                                                                                                                         Thailand
                                                                                                                                                                                                                                                                      Vietnam                                             (US)
            Senegal                                                                                        Sudan                                   Yemen                                                                                               Kampuchea
         The Gambia                               Burkina                                                                                                                                                                                                                             Philippines
                                                   Faso
                                                                                                                                           Djibouti             Socotra (Yem)
         Guinea-Bissau                                       Benin                                                                                                                  Laccadive Is                        Andaman Is
                                                                                                                                                                                       (Ind)                               (Ind)                                                                                                                              Marshall Islands
                    Guinea                                           Nigeria                                                   Ethiopia
               Sierra Leone                                                                                 South                                                                                                            Nicobar Is
                                           Côte                                           Central                                                                                                                              (Ind)
                                                                                     African Republic       Sudan                                                                                                                                                                                                       Micronesia
                                          d'Ivoire
                                Liberia                   Togo                                                                                        Somalia                                                   Sri Lanka                                               Brunei
                                                     Ghana          Cameroon
                                                       Bioko (Eq G)                                                                                                                    The                                                                    Malaysia
                                                                                                                   Uganda                                                             Maldives
                                                     Equatorial Guinea                       Democratic
                                                         Sao Tomé                             Republic                                                                                                                                                                                                                                                      Kiribati
    Sao Paulo (Br)                                      e Principé                            of Congo
                                                                         Gabon                                              Kenya
                                                                                                     Rwanda                                                                                                                                                                                                                                       Nauru
                                                   Annabón (Eq G)
                                                                                                     Burundi                                                                                                                                                                                                       Papua
                                                                               Congo                                                                                                                                                                                                                             New Guinea
                                                                                                                                                                                                                                                                   Indonesia
                                                            Cabinda (Angola)                                                                   Seychelles                           Chagos
                                                                                                                    Tanzania                                                      Archipeligo
                                                                                                                                                                                     (UK)
                                 Ascension (UK)                                                                                             Providence Is                                                                                                                                                                                    Solomon Is
                                                                                                                                    Aldabra Is (Sey)                                                                                                                                                                                                                   Tuvalu
                                                                                                                                       (Sey)
                                                                                                                                                                     Agalega Is
                                                                                                                                     Comoros Farquhar Is              (Maur)
                                                                                       Angola                                                        (Sey)                                                                                               Christmas Is
                                                                                                            Malawi                                                                                                                                          (Aus)
                                                                                                                                      Mayotte                                                                                                                                                                                                                                    Western Samoa
                                                                                                                                                                                                                                          Keeling Is
                                                                                                     Zambia                            (Fr)                                                                                                 (Aus)

                                                  St Helena (UK)
                                                                                                                                                                                                                                                                                                                                                 Vanuatu
                                                                                                                                                                                                                                                                                                                                                                        Fiji
                                                                                                                       Mozambique
                                                                                                        Zimbabwe                                      Madagascar
                                                                                                                                                                             Rodriguez Is
                                                                                                                                                                               (Maur)                                                                                                                                                                                                        Tonga
                                                                                                                                                                     Mauritius
                                                                                     Namibia                                                             Reunion                                                                                                                                                                               New
                                                                                                                                                           (Fr)                                                                                                                                                                              Caledonia
                                                                                                Botswana                                                                                                                                                                                            Australia                                   (Fr)


                                                                                                     Swaziland

                                                                                                 Lesotho
                                                                                                                                                                                                                                                                                                                                                   Christmas Is                     Kermadec Is
                                                                                           South Africa                                                                                                                                                                                                                                               (Aus)                            (NZ)


                                                                                                                                                                                                         Amsterdam Is (Fr)

                                                                                                                                                                                                              St Paul (Fr)                                                                                                                          New Zealand
                                                                                                                                                                                                                                                                                                                                                                                  Chatham Is
                                                                                                                                                                                                                                                                                                                                                                                    (NZ)

                                                                                                                                                         Krozet Is                                                                                                                                                                                                               Bounty Is
                                                                                                            Prince Edward Is                               (Fr)
                                                                                                                 (S Afr)                                                                                                                                                                                                                                                           (NZ)
                                                                                                                                                                                              Kerguelen Is
                                                                                                                                                                                                  (Fr)                                                                                                                                        Auckland Is         Antipodes Is
                                                                                                                                                                                                                                                                                                                                                 (NZ)                (NZ)

                                                                                                                                                                                                     Heard Is (Aus)                                                                                                                                              Campbell Is
                                                                                                                                                                                                                                                                                                                              Macquarie Is                         (NZ)
                                                                                                                                                                                                                                                                                                                                 (Aus)
        South Sandwich Is
              (UK)
Save the Children works in more than 120 countries.
We save children’s lives. We fight for their rights.
We help them fulfil their potential.


Acknowledgements
The Child Development Index 2012 was made possible by the extensive
contributions of Terry McKinley and Giovanni Cozzi of the Centre for
Development Policy and Research at the School of Oriental and African Studies,
University of London.
This paper was written by Alex Cobham, Nuria Molina and Maricar Garde at
Save the Children UK, with support from Brendan Cox, Liam Crosby, Shani
Winterstein, Simon Wright, Michel Anglade, John Lundine, Patricia Norimarna,
Elizabeth Hughes, Melinda van Zyl, Karen Allan, Madhuri Dass and Dragana Strinic.
Without implication, we are grateful for comments from Terry McKinley, Isabel
Ortiz and Michael Klosson.
The report, data and maps of The Child Development Index 2012 are available online
at www.savethechildren.org.uk/onlinelibrary


Published by
Save the Children
1 St John’s Lane
London EC1M 4AR
UK
+44 (0)20 7012 6400
savethechildren.org.uk

First published 2012

© The Save the Children Fund 2012

The Save the Children Fund is a charity registered in England and Wales (213890)
and Scotland (SC039570). Registered Company No. 178159

This publication is copyright, but may be reproduced by any method without fee or
prior permission for teaching purposes, but not for resale. For copying in any other
circumstances, prior written permission must be obtained from the publisher, and a
fee may be payable.

Typeset by Grasshopper Design Company
Printed by Page Bros Ltd.
contents


Executive summary	iv
	   Box: Measuring children’s well-being	                                vi


1	 A decade of progress in child well-being	1
	   Developing countries accelerate progress 	                           1
	   Inequalities between developed and developing countries remain	      6
	   Box: The Child Development Index and the Human Development Index 	   8


2	 Undernutrition: holding back progress 	10
	   Under-five mortality	                                                10
	   Primary school enrolment	                                            12
	Undernutrition	                                                         14
	   Box: The uncounted	                                                  15


3	 Food and financial crises threaten increased undernutrition	16

Conclusions	19

Recommendations	20

Appendix	21

Endnotes	25
Executive summary


     During the last decade, the world witnessed              and primary school enrolment was even more
     unprecedented progress in child survival                 impressive, as the rate of improvement more than
     and children’s well-being. Millions of children          doubled during the 2000s (from 11% to 23%; and
     were able to go to school for the first time,            from 14% to 32% respectively).
     and many more were given a chance at life                In addition to the accelerating progress it is clear
     as mortality rates in most countries                     that – since the 2000s – developing countries
     dropped dramatically.                                    experienced higher rates of progress on
                                                              average than developed countries. While the
     In the year 2000, world leaders met in New York at
                                                              world’s poorest countries, mostly in sub-Saharan
     the Millennium Summit and laid the foundations for
                                                              Africa and south Asia, tend to show the lowest child
     the international Millennium Development Goals
                                                              well-being, the gaps at the top of the Index narrowed
     (MDGs). These included universal access to primary
                                                              at the end of the 2000s.
     education and a dramatic reduction of child mortality
     rates, to be achieved by 2015. In turn, developed        In Africa, Tanzania stands out, moving up 30 places in
     countries committed to increase much-needed              their CDI ranking. The country’s success is based on
     development aid to enable poorer countries to            two remarkable achievements: it more than halved
     achieve the MDGs.                                        its child mortality, and almost halved the proportion
                                                              of underweight children. Angola, Benin, Maldives,
     In 2008, in order to monitor progress in child
                                                              Rwanda and Madagascar are the other African
     well-being, Save the Children launched the Child
                                                              countries moving rapidly up in the ranking. Three
     Development Index (CDI), a global tool to assess
                                                              central-American countries, El Salvador, Nicaragua
     the performance of 141 world countries on child
                                                              and Guatemala, are also among the fast movers up
     mortality, nutrition and access to primary education.
                                                              the ranking.
     The 2012 edition of the Child Development
                                                              However, not all the news is good. When we break
     Index tells a story of success. This edition of the
                                                              down the different components of the index –
     Index shows that substantial progress has been made
                                                              health, education and nutrition – data shows that
     in addressing the most basic threats to child survival
                                                              undernutrition has consistently lagged behind
     and well-being. On average, the lives of children
                                                              and remains one of the major factors holding
     around the world in the indicators we measured
                                                              back further progress on children’s well-being.
     improved by more than 30%. This means that the
                                                              Whereas health and education have improved well
     chances of a child going to school were one-third
                                                              above the average of the Index, when progress
     higher, and the chances of an infant dying before
                                                              accelerated in the second half of the 2000s (at a
     their fifth birthday were one-third lower at the
                                                              rate of 23% and 32% respectively), in comparison
     end of the 2000s than a decade before. During this
                                                              child undernutrition performed very poorly,
     period child well-being improved in 90% of the
                                                              improving at the much lower rate of 13%. In the
     countries surveyed.1
                                                              world’s poorest countries, progress was even
     Even more encouragingly, this historic progress          weaker, at just below 10%.
     has been dramatically accelerating in recent years.
                                                              Even more concerning is that the already slow
     From the first half of the 2000s to the second,
                                                              progress in tackling undernutrition has been
     overall rates of progress in child well-being
                                                              jeopardised by the effects of the global food and
     almost doubled compared to the end of the 1990s
                                                              financial crises. This study finds that the proportion
     (an average improvement of 22%, up from 12%).
                                                              of wasted children (suffering from acute weight
     Acceleration of progress in under-five mortality


iv
loss, which is commonly used to indicate the severity     We call on developing country governments to:


                                                                                                                     Ex
of food crises), actually rose in the second half         •	 Build on the target recently approved by the World
of the 2000s. Increases in wasting are worrying in           Health Organization for a 40% reduction in the
their own right, and also because they could be an           number of children who are stunted by 2015, by


                                                                                                                     ecutive
early warning sign of further deteriorations                 setting up national policies and specific targets for
in chronic undernutrition if the situation is not            reducing child stunting.
quickly reversed.                                         •	 Strengthen social transfer programmes (such as
                                                             cash transfers) as a key policy tool to combat
                                                             hunger and undernutrition, both in times of


                                                                                                                     summary
RECOMMENDATIONS                                              stability and as an effective crisis response tool
                                                             that is easily scalable.
The recent G8 agreement on the New Alliance               •	 Ensure that national nutrition policies and social
on Food Security and Nutrition; the World Health             transfers are aimed at reducing inequalities and the
Assembly support for a global target to reduce               disproportionate impact of undernutrition among
child stunting by 40% by 2025; and the commitment            the poorest and most vulnerable groups in society.
of the UK Prime Minister David Cameron to hold a
hunger summit during the 2012 Olympic Games in            We call on bilateral and multilateral donors to:
London are all welcome steps in putting the critical      •	 Maintain the recent focus on these issues.
issues of hunger and undernutrition higher on the            The hunger crisis can be dealt with
international agenda. But this report highlights the         but it will need a concerted effort, not
scale of the challenge.                                      a stand-alone moment.
                                                          •	 Scale up multi-year funding for nutrition,
The updated index shows the full impact of the drag          putting in place outcome targets to reduce
that a failure to tackle undernutrition is having on         child undernutrition and to support
child well being. It also shows the early signs of what      the establishment of social transfer
could be a new burgeoning crisis. In this context,           programmes – above all for those countries
business as usual will not suffice.                          that will find it most difficult to reduce stunting.
Save the Children is calling on the international         •	 Address the underlying drivers of high food
community to seize the forthcoming opportunities             prices which are at the root of ever more
to redouble its efforts to create the biggest-ever           frequent food crises, such as the ones that
push against world hunger. It will need to target            we are currently witnessing in the Sahel and the
its efforts into support for direct interventions            Horn of Africa. In particular, invest in smallholder
(such as breastfeeding and food fortification), to           agricultural development, prioritising support for
battle ongoing crises and to tackle the global               women smallholder producers and sustainable
drivers of undernutrition – such as high food prices         farming approaches.
and inequality.                                           •	 Commit to support the generation and use
                                                             of better data, to improve transparency and
                                                             accountability around these vital issues. This
                                                             report has also highlighted the weaknesses in basic
                                                             child well-being data; the same data is, of course,
                                                             crucial to effective policy responses.


                                                                                                                        v
Box: measuring children’s
     well-being


     The Child Development Index (CDI) is based on                                    more important to look at their score rather than
     an aggregate of three indicators that contribute                                 their place in the ranking. Their movement across the
     to children’s wellbeing and development: health,                                 rankings does not necessarily reflect the same degree
     education and nutrition. Countries are ranked                                    of underlying change in child well-being.
     according to their scores in terms of a child’s
                                                                                      Data are drawn largely from UN and World Bank
     chances of dying before her or his fifth birthday, of
                                                                                      sources, supplemented by some national statistics.
     not enrolling in school and of being underweight.
                                                                                      A lack of high-quality data makes it impossible to
     These three indicators are aggregated by simply
                                                                                      calculate the index on an annual basis, so instead we
     calculating the average score between them for each
                                                                                      work with periods of multiple years to ensure that
     period under review, meaning that they each have
                                                                                      reliable trends for each indicator and each country
     equal weighting in the index scores.
                                                                                      are identified. The Child Development Index 2012
     Countries are then ranked according to their CDI                                 therefore draws on data for the period 2005–10.
     scores. The lower the country’s score the better.
                                                                                      Data limitations also restrict comparisons of country
     A zero score would mean that all children survive
                                                                                      performance over time. We set aside from the main
     beyond their fifth birthday, all under-fives are well-
                                                                                      analysis an early period (1990–94) for which data
     nourished, and all primary school-age children are
                                                                                      are only available for 88 countries. We therefore
     enrolled in primary school. Conversely, a maximum
                                                                                      present data for three periods (1995–99, 2000–04
     score of 100 would represent a situation where all
                                                                                      and 2005–10), which allows us to create the index
     children under five were underweight, all primary
                                                                                      consistently for 141 countries in each. Increasing
     school children were out of school, and under-fives
                                                                                      country coverage over time reflects improvements
     were dying at the highest rate on the scale – that
                                                                                      in data collection. For further discussion of the
     is, 340 per 1,000 live births. For countries starting
                                                                                      problems posed by data availability, see the Box on
     with already high CDI scores in the first period, it is
                                                                                      ‘The uncounted’ on page 15.


          Figure 1. Indicators for child development


                                                                     Child development


                                 Health                                       Education                                      Nutrition
                        Under-five mortality rate*                     Percentage of primary-age                       Percentage of under-fives
                                                                         children not in school                          who are underweight


     *
         The health indicator is expressed on a scale of 0 to 100 that corresponds to 0 to 340 deaths per 1,000 live births


vi
1	 A DECADE OF PROGRESS
	 IN CHILD WELL-BEING

Save the Children’s 2012 Child Development                Developing countries
Index (CDI) presents a success story of                   accelerate progress
progress in children’s well-being across all
world regions, richer and poorer.                         Perhaps one of the greatest successes is that – since
                                                          the 2000s – developing countries experienced faster
Since the end of the 1990s child well-being improved      than average rates of progress, increasing the chances
in 90% of the countries assessed in the CDI.2 On          of poor children in poor countries reaching their
average, the lives of children around the world           fifth birthday or being able to go to school (see
improved by more than 30%. This means that the            Figure 2). The overall picture is encouraging; not
chances of a child going to school were one-third         only has great progress been made, but it has been
higher, and the chances of an infant dying before their   especially powerful in those countries that had
fifth birthday were one-third lower, at the end of the    previously lagged behind.
2000s than ten years before.
                                                          While the world’s poorest countries (low-income
Developed and developing countries substantially          countries) and the regions of sub-Saharan Africa and
improved child well-being. However, whereas the           south Asia had the weakest performance, the gaps
rate of progress was faster in developed countries        in child well-being narrowed in the 2000s as these
at the turn of the century (16%, compared to 12% in       countries enjoyed significantly higher rates of progress.
developing countries), during the decade of the 2000s
developing countries accelerated progress (up to          In Africa, one of the world regions with the weakest
22%) and overtook rich countries (where the rate of       performance in child well-being, progress in individual
improvement was only 9%). This has helped to bridge       countries presents a fragmented picture. While five
part of the gap between developed and developing          of the top 11 countries where improvements have
countries; however, inequalities remain, with children    been greatest are in Africa, six of the bottom ten
born in rich countries eight times better off than        countries are also in Africa (see Table 3 on page 7).
those in developing countries.                            Tanzania stands out; it moved up 30 places from
This is important news as poorer countries, starting      the second half of the 1990s to the second half of
from a much lower base, were able to decrease the         the 2000s. The country’s success is based on two
gap in children’s well-being that separates them from     remarkable achievements: Tanzania more than halved
richer countries – hence, decreasing world disparities.   its child mortality rate (from 159 per 1,000 births
Unfortunately, the gap is still far from being closed.    in 1995, to 76 per 1,000 births in 2010), and almost
World inequalities in child well-being remain a           halved the proportion of moderately or severely
challenge in giving every child a fair chance at life.    underweight children (falling from 30.6% in 1996 to
                                                          15.8% in 2010).
Moreover, as we show in the sections below, these
aggregate figures mask important disparities among
countries and regions, as well as uneven progress in
different dimensions of child well-being measured by
the Index – namely, access to primary education,
child mortality and undernutrition.


                                                                                                                      1
the child development index 2012

                                    Figure 2: CDI Performance over Time

                                    By region
                                                    	1995–99	   2000–04	   2005–10
                                                0


                                                5


                                               10


                                               15


                                               20
                                   CDI score


                                               25


                                               30
                                                                                     East Asia
                                                                                     CEE and CIS
                                               35                                    Latin America and
                                                                                     the Caribbean
                                                                                     Middle East and
                                               40                                    north Africa
                                                                                     South Asia
                                               45                                    Sub-Saharan Africa


                                    By income level
                                                    	1995–99	   2000–04	   2005–10
                                                0


                                                5


                                               10


                                               15
                                   CDI score


                                               20


                                               25


                                               30


                                                                                     Low income
                                               35
                                                                                     Low-middle income
                                                                                     Upper-middle income
                                               40                                    High income


    2
1  A DECADE OF PROGRESS IN CHILD WELL-BEING
Indonesia – a work in progress
Indonesia climbed six places up the CDI ranking           population and one-third of the rural population
between1995–99 and 2005–10, giving it a lead              have access to adequate sanitation,8 and more
over other big middle-income countries such as            than 50,000 Indonesian children per year die from
India and South Africa. Under-five mortality fell         diarrhoea.9 Indonesia also has one of the highest
dramatically from 91 per thousand live births             maternal mortality rates in south-east Asia (228 per
in 1990 to 35 per thousand births in 2010. Net            100,000 live births),10 and nearly half of all under
primary school enrolment went up from 89% to              five deaths occur during the first 28 days of life.11
96%, and the proportion of under-fives who are            Less than half of young learners in Indonesia attend
underweight went down from 38% in 1990 to                 preschool and only about two-thirds of students
20% in 2007.                                              enrol in secondary school.12 Finally, Indonesia has
                                                          the highest number of children in institutions in the
Much of this is down to improved access to health,
                                                          world – an estimated 500,000.13
education and other services. For example, 89%
of children received measles immunisation in 2010         As in many other countries, recent years have
compared to 60% two decades ago.3 Trained health          seen growing income inequality,14 creating big
professionals are bringing services to more people        disparities in children’s well-being. The poorest
and over 80% of the population now has access to          children are more than twice as likely to die before
improved drinking water, up from around 60% in the        their fifth birthday as those born into the richest
1990s.4 Spending on education, a key element in the       households,15 and with more than a third of under-
government’s development plan, doubled between            fives stunted,16 children in the poorest households
2000 and 2006.5 Efforts are now aimed at improving        are also the most vulnerable to this condition.17
the quality of health and education services.
                                                          The government committed to reduce stunting
However, children’s well-being is still a work in         prevalence among under-fives to 32% in 2014 in its
progress. More than one-third of Indonesian               National Mid-term Development Plan. It must also
children are stunted,6 and breastfeeding rates have       ensure that the country’s economic growth brings
steadily declined over the past two decades, with         further improvements in health, protection and
just 32% of mothers exclusively breastfeeding for         education for all children, including the poorest.
the first six months.7 Only about half of the total


Tanzania – the highest climber
Tanzania has made impressive progress in its CDI          •	 Budgetary allocations to the health sector
score over the past decade, from 42.6 in 1995–99             have been growing at an average rate of 21.8%
to 16.7 in 2005–10, moving up 30 places in the               between 2005/06 and 2010/11, increasing from
country rankings. Progress has been particularly             TZS 446 billion (US$279 million) in 2005/06
fast between 2006 and 2010, when the under-five              to TZS 1193 bn (US$745 m) in 2010/11.19
mortality rate dropped by 28%, from 112 per 1,000            The government has also made several strong
live births to 81.18 The number of out-of-school             commitments as part of the UN Secretary
children fell from 3.2 million in 1999 to 33,000 in          General’s Every Woman, Every Child initiative.
2008. The proportion of underweight children, as is          These include a commitment to increase health
true for the index in general, fell less dramatically –      sector spending from 12% to 15% of the national
from 16.4% in 2004–05 to 15.8% in 2010.                      budget by 201520 and double the number of
                                                             trained health workers.21
Different factors have contributed to Tanzania’s
                                                          •	 On the education front, the Complementary
impressive improvements in children’s health
                                                             Basic Education in Tanzania project provides
and education. For instance:
                                                                                              continued overleaf


                                                                                                                                       3
the child development index 2012

                                   Tanzania – the highest climber continued
                                      alternative education to 8–13-year-olds and            Budgeting Guidelines 2012/13 include nutrition
                                      helps them re-enter formal education. Also, the        interventions. The civil society Partnership for
                                      Grade 4 exam, which often acted as a barrier to        Nutrition in Tanzania (PANITA)24 is successfully
                                      educational progress, has been removed.22              influencing policy – for example:
                                                                                             •	 the establishment of a budget line specifically
                                   With 42% of under-fives stunted, Tanzania is one
                                                                                                 for nutrition in 2012/1325
                                   of the ten countries worst affected by chronic
                                                                                             •	 the implementation of the National Nutrition
                                   undernutrition. To tackle this, the government has
                                                                                                 Strategy
                                   recently introduced a number of measures and is
                                                                                             •	 ensuring that nutrition interventions reach
                                   taking an active role in the Scaling up Nutrition
                                                                                                 local communities.
                                   (SUN) movement.23 It has established a Multi-
                                   Institutional/Multi-Sectoral High Level Nutrition         Provided that funding is maintained, many of these
                                   Steering Committee composed of public, private,           policies and processes will continue to improve
                                   civil society and development partners and                children’s wellbeing. But greater transparency and
                                   chaired by the Permanent Secretary in the Prime           sustained consultation and policy dialogue between
                                   Minister’s office. A National Nutrition Strategy          the government, civil society and development
                                   has been launched, and the National Planning and          partners is essential.26


                                   South Africa – a mixed picture
                                   South Africa’s CDI scores indicate that children’s        poverty. Estimates indicate that about two-thirds of
                                   wellbeing fell between 1995–99 and 2000–04, but           children lived in households with per capita incomes
                                   slightly improved between 2000–04 and 2005–10.            below the poverty line (set at R552 per month in
                                   Its ranking fell 24 places between the first and          2009).30 Access to health facilities and education
                                   the last period, which is mainly a consequence of         vary greatly across provinces, with some children
                                   other countries overtaking it in terms of advancing       in remote areas unable to go to school due to
                                   children’s well-being.                                    inadequate or unaffordable transport.31 The HIV and
                                                                                             AIDS epidemic is badly affecting the lives of children
                                   To understand the country’s performance, it is
                                                                                             who are already vulnerable. In 2009, it was estimated
                                   important to look at what has happened to the three
                                                                                             that 330,000 children were living with HIV and
                                   indicators in the index. Under-five mortality saw a
                                                                                             nearly 2 million were orphaned due to AIDS.32
                                   slight decline from 60 per thousand live births in
                                   1990 to 57 per thousand births in 2010, but some          The government is implementing a large-scale social
                                   years in between actually saw increases in the rate       security programme that includes a Child Support
                                   of children dying. South Africa is one of the few         Grant to help improve the conditions of children
                                   countries that hasn’t registered progress in both child   who live in poverty. The grant, which is about R280
                                   and maternal mortality.28 Primary school enrolment        (US$33) per month, reaches 11 million children.33
                                   was at 90% in 1990 and remains the same in 2010,          A study evaluating its impact has shown that
                                   but again this has seen dips in the years in between.29   those who get the grant do better across several
                                   The proportion of underweight children below five         measures of children’s wellbeing. For example,
                                   years has remained at 9% over the decades.                they complete more grades in school and girls
                                                                                             achieve higher maths scores.34 Children receiving
                                   There are multiple causes of children’s deprivation
                                                                                             the grant are also less likely to be ill or stunted.35
                                   but poverty, income inequality – which affects poor
                                                                                             The programme is a step in the right direction.
                                   people’s access to good quality services – and
                                                                                             Economic growth may not automatically lead to
                                   the AIDS epidemic are some of the key reasons
                                                                                             better outcomes, but investing in children and
                                   behind the poor quality of children’s health and
                                                                                             implementing policies that address their needs help
                                   education in South Africa. Economic growth brought
                                                                                             to improve children’s lives. This and other efforts
                                   great benefits to certain sectors of society, but it
                                                                                             are crucial to reversing deprivation and improving
                                   has increased inequality, and many children live in
                                                                                             children’s well-being in South Africa.


   4
At the other end, Equatorial Guinea fell as many places    Bank and Gaza) all feature among the biggest fallers in


                                                                                                                     1  A DECADE OF PROGRESS IN CHILD WELL-BEING
as Tanzania rose, while the West Bank and Gaza fell even   the ranking.
further – nearly 50 places, with children’s net school
                                                           Of those making the most progress in percentage
enrolment rates in particular showing a sharp decline
                                                           terms, the top six countries are the same as those
(from 97% in 1999 to less than 80% since 2005).27
                                                           moving up fastest in the ranking, except that Croatia
The pattern looks broadly similar if we consider           replaces Angola. Angola’s strong improvements over
changes in percentage scores, rather than ranking.         the period saw it move from the 140th in 1995–99
One important difference is Somalia. Although only         – almost at the bottom of the table – where smaller
falling seven places from the second half of the 1990s     percentage improvements can result in a greater
to the second half of the 2000s, Somalia was one of        improvement in ranking. Croatia, by dint of starting
only six countries to actually see a fall in index score   higher up the index in the second half of the 1990s,
over the period. The others (Central African Republic,     saw a higher percentage improvement in score
South Africa, Equatorial Guinea, Paraguay and West         translate into a smaller shift in ranking.


Table 1: Top ten and bottom ten developing countries by CDI progress,
1995–99 to 2005–10

 Top ten
 Rank by progress	      Country	                    Change in index rank	      1995–1999	        2005–2010
 	1	                    Tanzania	                    30	                       42.6	             16.7
 	2	                    Turkey	                      25	                       15.2	              5.7
 	3	                    Angola	                      21	                       59.6	             28.2
 	 4	                   El Salvador	                 20	                       14.7	              5.9
 	5	                    Nicaragua	                   20	                       17.1	              7.4
 	6	                    Maldives	                    20	                       23.5	              9.2
 	7	                    Benin	                       20	                       43.2	             22.8
 	8	                    Georgia	                     18	                       12.6	              5.3
 	9	                    Rwanda	                      18	                       39.3	             19.9
 	10=	                  Guatemala	                   17	                       21.1	              9.4
 	10=	                  Madagascar	                  17	                       41.0	             22.2
 Bottom ten			
 Rank by progress	      Country	                    Change in index rank	      1995–1999	        2005–2010
 109	                   Albania	                    -16	                       10.8	10.2
 110	                   Côte d’Ivoire	              -16	                       37.1	             34.4
 111	                   Jamaica	                    -17	                        9.1	8.5
 112	                   Togo	                       -17	                       26.8	23.3
 113	                   Lesotho	                    -18	                       28.4	25.0
 114	                   Central African Republic	   -18	                       40.4	             41.5
 115	                   South Africa	               -24	                       11.5	             12.2
 116	                   Paraguay	                   -25	                        6.2	7.5
 117	                   Equatorial Guinea	          -32	                       28.3	             32.9
 118	                   West Bank and Gaza	         -49	                        5.8	             10.6


                                                                                                                                          5
Inequalities between                                    Map B at the back of this report (pages 26–27)
the child development index 2012


                                   developed and developing                                shows country index scores according to whether
                                                                                           they achieve low, medium, high or very high child
                                   countries remain                                        well-being. Table 2 (below) gives average scores by
                                   Despite striking progress both globally and in          region of the world and by income level, with lower
                                   developing countries, the world still remains a very    scores indicating stronger child development. The
                                   unequal place. Being born in a developed or in a        average score for high-income countries is less than 2,
                                   developing country still makes a big difference in      compared to nearly 17 for developing countries as
                                   determining children’s chances at life. Whereas         a group.
                                   developed countries are very close to the highest       As in the first edition of the index, Japan is the
                                   score of the ranking, the average child in developing   best performer, with an improved score of 0.35,
                                   countries is almost eight times worse off than he       which represents the highest achieved level of child
                                   or she would be if they had been born in a rich         well-being.
                                   country. The lowest child well-being is found in the
                                   regions of sub-Saharan Africa and south Asia, and –     At the bottom of the scale, Niger was previously well
                                   unsurprisingly – among the lowest income countries.     adrift of all other countries. We see now, however,


                                   Table 2: The Child Development Index, by region and income level

                                    	                                            Sample size	             Child Development Index 2005–10

                                    Developed countries	                          24	                       1.69

                                    Developing countries	                       117	                      16.86

                                    By region:		
                                    East Asia	                                    11	                       6.62
                                    CEE and CIS	                                  15	                       5.84
                                    Latin America and the Caribbean	              25	                       5.62
                                    Middle East and north Africa	                 14	                      10.11
                                    Sub-Saharan Africa	                           45	                      30.38
                                    South Asia	                                    7	                      24.11

                                    By income level:
                                    Low income	                                   50	                      26.31
                                    Lower-middle income	                          49	                       6.14
                                    Upper-middle income	                          18	                       5.01
                                    High income	                                  24	                       1.69

                                    World	                                      141	15.54


    6
that Niger has experienced a substantial improvement         Indeed, it masks a huge variety, since the strongest


                                                                                                                     1  A DECADE OF PROGRESS IN CHILD WELL-BEING
in its index score (from 70 in the second half of the        improvements are also seen in Africa.
1990s and 62 in the first half of the 2000s, to 49 in
                                                             Map A, at the very start of this report, shows the
the second half of the 2000s) and caught up with the
                                                             world map, with countries coloured according to the
trailing pack. However, it is against this background of
                                                             extent of their progress on the CDI from 1995–99
relative progress that the country is once again facing
                                                             to 2005–10. It is noticeable that a range of colours
a desperate food crisis.36 Niger is replaced, predictably,
                                                             appears in each region. Africa in particular includes
by a country that has been sliding backwards on
                                                             countries with low, medium, high and very high rates
multiple indicators: Somalia, with a score of 55
                                                             of progress.
(worsening from 50 in 1995–99 as civil conflict has
taken its toll).                                             Map B, at the very end of this report, has countries
                                                             shaded to reflect their CDI scores, from the lowest-
As shown in table 3 below, all ten of the bottom
                                                             scoring quarter of countries to the highest. The
countries in the Child Development Index for
                                                             pattern of progress by region is clearly seen.
the most recent period assessed (2005–10)37 are
African. However, this does not necessarily provide
a fair picture of progress across the continent.


Table 3: Top ten and bottom ten countries by CDI 2012 rank

  Top ten			                                                 Bottom ten	

  Rank	 Country	                             Index	Rank	 Country	                                       Index

  	1	           Japan	                       0.35	           132	          Eritrea	                     39.39	

  	2	           Spain	                       0.55	           133	          Mali	                        39.53	

  	 3	          Germany	                     0.64	           134	          Sierra Leone	                39.71	

  	4	           Italy	                       0.70	           135	          Djibouti	                    40.03	

  	 5	          France	                      0.74	           136	          Central African Republic	    41.47	

  	 6	          Canada	                      0.74	           137	          Congo, Dem. Rep.	            43.01	

  	 7	          Switzerland	                 0.82	           138	          Burkina Faso	                43.93	

  	8	           Norway	                      0.89	           139	          Chad	                        44.11	

  	 9	          United Kingdom	              0.92	           140	          Niger	                       48.73	

  10	 Netherlands	                           0.93	141	 Somalia	                                         54.50


                                                                                                                                         7
Box: The child development index
    and the human development index


    The Child Development Index follows in the                countries may be storing up trouble for the future.
    footsteps of the UNDP’s Human Development                 It is additionally a concern that a number of the
    Index (HDI), pioneered by the economist Mahbub            countries in this category (from UAE to Equatorial
    ul Haq. This index established the importance of          Guinea) are highly dependent on natural resource
    measuring human well-being beyond simple national         extraction, which offers only finite development
    income measures. The two indices each have three          possibilities.
    components with broadly common aims:
                                                              The countries below the diagonal, in contrast, score
                                                              more highly on the CDI than the HDI and can be
     Element of 	 HDI	     CDI                                thought of as investing relatively strongly in their
     well-being	component	 component
                                                              children. Sub-Saharan Africa is particularly strongly
     Health	         Life expectancy	 Under-five              represented at the bottom of the figure, with low
                     rate	mortality                           HDI countries in the medium CDI quartile – including,
     Education	      An education 	      Net enrolment
                                                              for example, the noted strong performer Tanzania.
                     index (changed 	    rate                 This should be seen as encouraging news.
                     in 2011 from
                     combining                                However, some caution is required in interpreting
                     literacy and                             these results. Since the CDI refers to a longer period,
                     gross enrolment,                         while the HDI data relate to the most recent year,
                     to years of
                     schooling)	
                                                              a country which has gone backwards in the CDI
                                                              ranking – such as Zimbabwe – can still appear to
     Basic needs	    Average per 	       Nutrition            outperform on the CDI. Differences will therefore not
                     capita national 	   (under-weight        always reflect the relative intensity of child-centred
                     income, as a 	      prevalence among
                     proxy for the 	     under-fives), as     development efforts.
                     ability to meet 	   perhaps the most
                     basic needs	        basic need
                                                              Finally, it is worth drawing attention to the BRICS
                                                              nations, often highlighted as emerging global powers.
                                                              Three – Brazil, South Africa and Russia – are on the
    It is interesting to see where there are major
                                                              diagonal (that is, they occupy the same quartiles of
    differences in countries’ performance between the
                                                              the CDI and the HDI). China and India both qualify
    two indices. Following the HDI, we can divide each
                                                              as of medium development on the HDI; but while
    index into four quartiles, indicating low development,
                                                              China is in the highest quartile of the CDI, India is in
    medium, high and very high development. Figure 3
                                                              the lowest.
    shows, as would be expected, that the majority of
    countries that feature in both indices fall into the      In fact, China is the only country which scores not
    same quartile in both: this is the grey shaded diagonal   one, but two quartiles higher in the CDI than the
    running from the top right (very high development on      HDI. The implication is that, in relative terms, China
    both indices) to the bottom left (low development         is heavily prioritising investment in children. Both
    on both indices).                                         score highly on net enrolment rates, but more than
                                                              40% of India’s children are moderately or severely
    The countries off the diagonal are perhaps of greater
                                                              underweight, compared to less than 5% of China’s;
    interest. Those above the diagonal, shaded in yellow,
                                                              and India’s under-five mortality rate exceeds 60 out
    demonstrate better performance on the HDI than
                                                              of 1,000, while China’s is below 20.
    on the CDI. The risk here is that by failing to invest
    in child well-being to a commensurate level, these


8
Box: T he
Figure 3: CDI and HDI compared

  CDI       Low                            Medium                       High                         Very high
HDI
                                                                        Qatar                        Argentina	Iceland
Very high


                                                                        UAE                          Australia	Ireland


                                                                                                                                child
                                                                                                     Austria	Italy
                                                                                                     Bahrain	Japan


                                                                                                                                dev
                                                                                                     Belgium	Luxembourg
                                                                                                     Canada	Netherlands
                                                                                                     Chile	Norway
                                                                                                     Croatia	Spain
                                                                                                     Czech 	    Sweden	
                                                                                                      Republic	 Switzerland


                                                                                                                                elopment
                                                                                                     Denmark	United
                                                                                                     Finland	    Kingdom
                                                                                                     France	    United States
                                                                                                     Germany


                                                                                                                                inde x
                                           Albania                      Armenia       Russian        Belarus
High


                                                                                                                                and
                                           Azerbaijan                   Brazil         Federation    Belize
                                           Oman                         Colombia      Saudi Arabia   Costa Rica
                                                                        Ecuador       Trinidad       Cuba


                                                                                                                                the
                                                                        Georgia        and Tobago    Macedonia
                                                                        Iran          Turkey         Mexico
                                                                        Jamaica       Venezuela      Romania
                                                                        Kazakhstan                   Tunisia


                                                                                                                                human
                                                                        Kuwait                       Uruguay
                                                                        Lebanon


                                                                                                                                dev
                                                                        Malaysia
                                                                        Mauritius
                                                                        Panama
                                                                        Peru


                                                                                                                                elopment
            Congo                          Bhutan        South Africa   Algeria                      China
Medium


            Equatorial Guinea              Botswana      Sri Lanka      Bolivia
            Ghana                          Cambodia      Swaziland      Egypt
            India                          Dominican     Tajikistan     El Salvador


                                                                                                                                inde x
            Lao PDR                          Republic    Vietnam        Honduras
                                           Gabon         West Bank      Jordan
                                           Guatemala      and Gaza      Kyrgyzstan
                                           Guyana                       Moldova
                                           Indonesia                    Mongolia
                                           Iraq                         Nicaragua
                                           Maldives                     Paraguay
                                           Morocco                      Suriname
                                           Namibia                      Syria
                                           Philippines                  Thailand


            Angola          Lesotho        Benin
Low


            Bangladesh      Liberia        Cameroon
            Burkina Faso    Mali           Comoros
            Burundi         Mauritania     Kenya
            Central         Mozambique     Madagascar
             African        Nepal          Malawi
             Republic       Niger          Myanmar
            Chad            Nigeria        Rwanda
            Côte d’Ivoire   Pakistan       Sao Tome and Principe
            Djibouti        Senegal        Tanzania
            DR Congo        Sierra Leone   Uganda
            Eritrea         Sudan          Zambia
            Ethiopia        Timor-Leste    Zimbabwe
            Gambia          Togo
            Guinea          Yemen
            Guinea-Bissau
            Haiti


                                                                                                                                    9
2	 Undernutrition:
     	holding back progress

     To understand better the nature of progress      Under-five mortality
     in the CDI, we break down the analysis to
     look at each of the key components: under-       Between the second half of the 1990s and the
                                                      second half of the 2000s, developing countries
     five mortality rates, net non-enrolment
                                                      reduced under-five mortality rates by more than
     in primary education, and the prevalence
                                                      30% (see Table 3 below).
     of underweight children. A clear picture
     emerges: strong progress on the first two        As with the overall index, we see a significant
     is set against relatively poor performance       acceleration in progress in the 2000s, when the rate
     on the latter, as undernutrition continues to    of improvement went up to 23% from only 11% at
     retard advances in children’s well-being.        the end of the 1990s. During the 2000s, the number
                                                      of children dying each year went down from around
                                                      10 million to 7.6 million.38
                                                      However, the world’s poorest countries, most of
                                                      which are in sub-Saharan Africa and south Asia, lag
                                                      behind, with improvement rates well below the
                                                      world average.


     Table 3: Under-5 Mortality Rate Component: CDI progress, 1995–99 to 2005–10

      	 Value	Value	 Value	Improvement 	       Improvement	Total
      	 1995–99	 2000–04	 2005–10	 1995–99 to	 2000–04 to	 improvement
      				2000–04	                             2005–10	

      Developed
                            2.2	 1.9	 1.7	13.6	                             7.8	             20.3
      countries	

      Developing
                            26.6	23.7	 18.9	10.9	                          23.3	             31.6
      countries	

      By region:
      East Asia	            14.7	   11.9	      7.9	      19.0	             34.0	             46.5
      CEE and CIS	          13.9	   10.9	      6.6	      22.0	             39.5	             52.8
      Latin America and
                            12.8	 9.9	 7.1	22.9	                           28.6	             45.0
       the Caribbean	
      Middle East and
                            17.5	14.4	 10.3	17.6	                          28.3	             40.9
       north Africa	
      Sub-Saharan Africa	   49.0	   47.9	     39.1	       2.3	             18.3	             20.2
      South Asia	           30.9	   26.8	     20.7	      13.3	             22.7	             33.0

      By income level:	
      Low income	           37.9	   34.8	     27.5	       8.2	             20.8	             27.3
      Low-middle
                            14.1	11.3	 7.6	19.9	                           32.4	             45.9
       income	
      Upper-middle
                             9.8	 8.4	 5.8	13.5	                           31.4	             40.6
       income	
      High income	           2.2	    1.9	      1.7	      13.6	              7.8	             20.3

      World	                24.5	21.8	 16.7	10.9	                          23.2	             31.5


10
2  U
  Survival – an equal right
  The number of children dying before their fifth          five mortality. Pneumonia, premature births,
  birthday has gone down from around 12 million in         diarrhoea and malaria are the most common
  1990 to 7.6 million in 2010, despite an increasing       causes of under-five deaths. Increasing coverage of
  birth rate.39 This is remarkable progress. But the       successful interventions – vaccines, treatment of
  global figure masks growing inequality within and        childhood illnesses, insecticide-treated bed nets –
  between countries. Also worrying is the increased        has protected many children. But access to these


                                                                                                                                ndernutrition :
  proportion of deaths that occur in the first month       remains grossly inequitable.
  of life (now 40% of under-five deaths),40 and the fact
                                                           One reason why the deaths of newborn babies
  that undernutrition (which shows least progress
                                                           have not gone down as much as under-five deaths is
  on the Child Development Index) is the underlying


                                                                                                                                holding
                                                           that many mothers have no access to good-quality
  cause of one-third of child deaths.41
                                                           health services. Forced to give birth without a
  Five large countries – India, Nigeria, the Democratic    skilled attendant, many mothers die along with


                                                                                                                                back
  Republic of Congo, Pakistan and China – account          their babies.
  for about half the global under-five mortality
                                                           Efforts must be focused on reducing children’s
  figure.42 While under-five mortality is increasingly
                                                           unequal chances of surviving. In some countries, the
  concentrated in sub-Saharan Africa and south Asia,
                                                           poorest children are two to three times more likely


                                                                                                                                progress
  23 of the 75 Countdown to 2015 countries (those
                                                           to die before their fifth birthday than those born in
  that account for over 95% of child deaths) are
                                                           the richest households.45 Mortality should be tracked
  on track to meet MDG 4 (a two-thirds reduction
                                                           across wealth groups and other socioeconomic
  in child mortality) by 2015.43 On the whole, the
                                                           characteristics. Countries must ensure that in
  poorest countries are doing least well but some
                                                           achieving MDG 4 (a two-thirds reduction in child
  low-income countries – like Bangladesh, Cambodia,
                                                           mortality between 1990 and 2015) they do not leave
  Laos and Nepal – are on track. And the rate of
                                                           the poorest children behind.
  decline of under-five mortality in a number of
  African countries – including Senegal, Rwanda,           Equal attention must be paid to girls’ education
  Kenya and Uganda – has accelerated significantly         and rights, which is a major factor in improving
  in recent years.44                                       child survival rates. Governments and donors need
                                                           to invest more to combat undernutrition among
  Many countries, however, are showing little or
                                                           mothers and children to address a major underlying
  no progress. Renewed efforts are needed to
                                                           cause of child mortality.
  address the direct and structural causes of under-

                                                                                                                 C
                                                                                                                 olin C
                                                                                                                 rowley /Save
                                                                                                                 the C
                                                                                                                 hildren


Rukia with her son Husseinat,
who was delivered two months
premature by caesarean
section and is being cared
for at the district hospital in
Mtwara, Tanzania.


                                                                                                                                    11
Primary school enrolment                               The acceleration that developing countries
the child development index 2012

                                                                                          experienced in overall child well-being at the beginning
                                   The figures for increased numbers of children          of the 2000s is, if anything, more pronounced when it
                                   enrolled in primary school are even more positive,     comes to primary school enrolment. While at the end
                                   with an average increase of 40% in developing          of the 1990s the improvement rate was only 14%, in
                                   countries from the second half of the 1990s to the     the 2000s this rate climbed up to 32%. It is striking that
                                   second half of the 2000s. South Asia leads the way     improvement rates in the world’s poorest countries
                                   among regions, with nearly a 50% increase, while       have been, in this case, higher than the world average
                                   sub-Saharan Africa has achieved similar rates to       – with south Asia standing out with 40% improvement
                                   others regions.                                        rates in the 2000s.


                                   Table 4: Net Non-Enrolment in Primary Education: CDI progress, 1995–99 to 2005–10

                                    	 Value	Value	 Value	Improvement 	       Improvement	Total
                                    	 1995–99	 2000–04	 2005–10	 1995–99 to	 2000–04 to	 improvement
                                    				2000–04	                             2005–10	

                                    Developed
                                                          4.1	 3.3	 3.2	17.9	                                    2.8	              20.2
                                    countries	

                                    Developing
                                                          18.8	16.2	 10.9	13.9	                                 32.8	              42.1
                                    countries	

                                    By region:
                                    East Asia	             4.1	       3.4	         2.2	      15.9	              34.7	              45.1
                                    CEE and CIS	          13.4	      10.5	         7.1	      21.5	              32.6	              47.1
                                    Latin America and
                                                           8.3	 7.1	 5.4	14.6	                                  24.1	              35.2
                                     the Caribbean	
                                    Middle East and
                                                          15.9	12.2	 9.4	23.3	                                  22.8	              40.8
                                     north Africa	
                                    Sub-Saharan Africa	   44.1	      39.1	        27.6	      11.3	              29.5	              37.5
                                    South Asia	           20.4	      17.4	        10.4	      14.8	              40.2	              49.0

                                    By income level:	
                                    Low income	           29.4	      25.6	        17.1	      12.9	              33.5	              42.1
                                    Low-middle
                                                           6.7	 5.5	 3.8	18.5	                                  31.1	              43.8
                                     income	
                                    Upper-middle
                                                           5.9	 4.7	 4.4	20.2	                                   6.4	              25.3
                                     income	
                                    High income	           4.1	       3.3	         3.2	      17.9	               3.1	              20.4

                                    World	                17.5	15.1	 10.2	13.9	                                 32.2	              41.6


12
2  U
  Education – access at the expense of quality
  “We cannot talk about building strong economies,                           Institution,48 “approximately 200 million children
  sustainable democracies, and equitable societies without                   who are in primary school are learning so little
  having educated children. We need boys and especially                      that they are struggling to read basic words.”
  girls who can read, write, calculate and think critically
                                                                             Enrolling children in school is not enough.
  to lead us to a more peaceful and secure world. This
                                                                             Their right to education includes the right to
  call for a renewed global commitment on learning will


                                                                                                                                               ndernutrition :
                                                                             learn. Recent research shows the importance of
  help catalyse important actors from around the world to
                                                                             education to other development goals. For example,
  invest time, energy, and resources in improving learning
                                                                             a child born to a mother who can read is 50% more
  for all.”
                                                                             likely to survive past the age of five.49 Evidence
                      Ellen Johnson Sirleaf, President of Liberia speaking


                                                                                                                                               holding
                          about the 2011 Global Compact on Learning46        also shows that learning levels matter more than
                                                                             the number of years spent in school in terms of
  The reason the education component of the                                  individual earnings, health, and a country’s economic


                                                                                                                                               back
  Child Development Index is based on how many                               growth.50 UNESCO estimates that approximately
  primary-age children are enrolled in school is, in                         171 million people could be lifted out of poverty
  part, because of the availability of relatively strong                     if all students in low-income countries learn basic
  national data. However, data over the past decade                          reading skills in school.51


                                                                                                                                               progress
  suggests that the MDG focus on increasing the
  numbers of children enrolled in school has been                            Governments, donors, civil society and academic
  at the expense of learning.47 Students in many                             institutions are supporting a sharper focus on
  countries are not gaining even basic literacy and                          learning targets to guide progress in the education
  numeracy skills.                                                           sector. The post-2015 framework provides a key
                                                                             platform to ensure this change, but data is needed
  Impressive school enrolment rates don’t reflect                            now. This is a clear opportunity for international
  the number of children who actually complete a                             policy-makers, including President Johnson Sirleaf
  school year, much less master basic skills. With                           as one of the co-chairs of the high-level panel
  overcrowded classrooms and a lack of trained                               on post-2015 (see page 15), to ensure that
  teachers, children are spending years in school                            consistent data are generated for more powerful
  without gaining even basic reading, writing,                               education indicators.
  maths or life skills. According to the Brookings


                                                                                                                                   P
                                                                                                                                   aul Z
                                                                                                                                   hang/Save
                                                                                                                                   the C
                                                                                                                                   hildren


An early childhood centre run by
Save the Children in a Beijing suburb.


                                                                                                                                                   13
Undernutrition                                        The picture of under-performance is highly
the child development index 2012

                                                                                         concentrated in the world’s poorest countries and
                                   By comparison, the nutrition picture is alarming.     in sub-Saharan Africa and south Asia. While middle
                                   While progress in under-five mortality and primary    income countries saw improvement rates between
                                   school enrolment accelerated during the 2000s, and    25 and 30% during the 2000s, sub-Saharan Africa saw
                                   improvement rates almost doubled (going up to         only 14% improvement and south Asia just 8%.
                                   23% and 32% respectively), there was no significant
                                   acceleration in progress in nutrition. Improvement
                                   rates in underweight prevalence were much weaker
                                   at 13%.


                                   Table 5: Prevalence of Underweight Children: CDI progress, 1995–99 to 2005–10

                                    	 Value	Value	 Value	Improvement 	       Improvement	Total
                                    	 1995–99	 2000–04	 2005–10	 1995–99 to	 2000–04 to	 improvement
                                    				2000–04	                             2005–10	

                                    Developed
                                                          0.4	0.4	 0.1	1.4	                                 66.3	                 66.8
                                    countries	

                                    Developing
                                                          28.0	24.7	 21.5	11.6	                             13.0	                 23.1
                                    countries	

                                    By region:
                                    East Asia	            18.5	      13.4	        9.8	     27.5	             27.1	                47.1
                                    CEE and CIS	           6.4	       4.3	        3.9	     32.2	             10.1	                39.0
                                    Latin America and
                                                           8.2	 6.2	 4.4	24.6	                               27.9	                45.6
                                     the Caribbean	
                                    Middle East and
                                                          16.0	13.6	 10.6	14.9	                              22.4	                34.0
                                     north Africa	
                                    Sub-Saharan Africa	   31.7	      28.3	       24.4	     11.0	             13.6	                23.0
                                    South Asia	           46.7	      44.5	       41.2	      4.6	              7.5	                11.8

                                    By income level:	
                                    Low income	           41.1	      38.0	       34.3	       7.6	             9.7	                16.5
                                    Low-middle
                                                          13.4	 9.8	 7.0	26.6	                               28.6	                47.5
                                     income	
                                    Upper-middle
                                                           8.6	 6.5	 4.8	23.9	                               26.0	                43.6
                                     income	
                                    High income	           0.4	       0.4	        0.1	       1.4	            66.3	                66.8

                                    World	                25.6	22.6	 19.7	11.6	                             13.1	                 23.2
                                                                                                                J
                                                                                                                ane H
                                                                                                                ahn /P
                                                                                                                anos


                                                                                                                         Henry, 10, with his
                                                                                                                         nine-month-old nephew
                                                                                                                         Jeremiah, outside his home
                                                                                                                         in Sugar Hill, Liberia.


14
Box: The Uncounted


Compiling the Child Development Index reveals just         such as food price spikes, or to hold governments and
how weak are the data that tell us how countries are       donors to account for commitments made, the data
performing in terms of even the most basic indicators      are all too often simply not available.
of child well-being. How can governments and donors
                                                           During 2012, Indonesia and the UK are together
claim to be targeting progress when they don’t even know
                                                           co-chairs of both the Open Government Partnership
where they’re starting from? Indeed, how can the well-
                                                           and, with Liberia, of the high-level UN panel on the
being of children be improved, if those children are –
                                                           post-2015 successor to the Millennium Development
literally – not counted?
                                                           Goals (MDGs). The Open Government Partnership is
There has been an impressive improvement in the            committed to generating data on human development
coverage of child mortality data. Here the data shift      and on policies and their impact, and making data
from a relatively consistent pattern of coverage every     available to citizens in the interests of transparency
five years, to annual coverage from 2005 onwards.          and accountability.
Net primary enrolment data has never had the same
                                                           The post-2015 panel is intended to move forward
consistency of coverage, but exists for more than
                                                           the discussions about the global framework for
one hundred countries each year for most years
                                                           development. Since one major criticism of the MDGs
since 2000. Underweight nutrition data, on the other
                                                           has been that they lack accountability for various
hand, is entirely reliant on household surveys and
                                                           reasons, including often the absence of consistent,
there may only be a small number of these conducted
                                                           high-quality data, there is a real opportunity for
around the world in a given year. To track progress,
                                                           leadership here.
to understand and respond to problems or threats


                                                                                                              P
                                                                                                              rashanth
                                                                                                              Vishwanathan /Save
                                                                                                              the C


Children outside their
makeshift home by a metro
                                                                                                              hildren


station in New Delhi.


                                                                                                                                   15
3	 Food and financial
     	crises threaten increased
     	undernutrition

     A further – and even more worrying –                        food prices. Wasting is showing negative trends across
     concern is that data on wasting and stunting                various income groupings and regions for the late 2000s.
     (very sparse for the second half of the 1990s               Across different world regions (see Figure 4 below),
     and the first half of the 2000s and, therefore,             the proportion of children who were wasted
     not included in the CDI) suggest that the                   rose by almost 17% in East Asia and by over
     current ‘triple f’ – financial, fuel and food-              4% in the Middle East and North Africa, and
     price crisis – is having a significant impact on            in lower-middle income countries as a group.
     children’s nutrition.                                       This indicates that many hundreds of thousands of
                                                                 additional children suffered acute under-nutrition.
     Stunting, when children are too short for their age,
     is the result of chronic undernutrition and, hence,         This proportion of wasted children even rose in
     reflects structural trends in the nutritional status of     developed countries – though from a very small base.
     children in a certain country. Wasting – acute weight       This may seem surprising, given the expectation that
     loss – is the result of grave deprivation of nutritious     even low-income households in rich countries will
     food and/or disease at a specific point in time. It is a    spend relatively small shares of their income on food.
     rapidly changing indicator and it is commonly used to       But it underlines the extent of income instability
     indicate the severity of famine and food crises.52          associated with the crisis, including through both
                                                                 employment and out of work benefits.
     We examined changes in wasting to see whether
     more children are suffering from acute weight loss          These findings are worrying in their own right,
     as a possible result of the global food crisis. We have     and also because they could be interpreted as
     been able to gather representative data for wasting         an early warning for future increases in chronic
     for the first and second half of the decade of the          undernutrition – which will only become clear as
     2000s only. This allows us to examine the change from       more data become available.
     pre-crisis to crisis period, but prevents a comparison      The significant impacts of food crisis and children
     with an earlier change (eg, from the second half of the     suffering from wasting are not evenly distributed.
     1990s to the first half of the 2000s).                      Save the Children research found that the poorest
     Between the first and second half of the 2000s, there       suffer the most. On the basis of household surveys
     was a reduction of 13% in the proportion of under-          we carried out before and after the 2007–08 food-
     five children who were underweight in developing            price spikes, we found that while the wealthiest
     countries – significantly weaker than the other             households had benefited from the increased price of
     components of the CDI. The performance on stunting          staple foods, the poorest had suffered, as evidenced by
     was weaker still, showing only a 10% fall over the          analysis of the impact of the escalation of food prices
     same period – unsurprising, since it is a longer-term       on household income and children’s nutrition in a
     condition and so, harder to address.                        rural community in northern Bangladesh.53

     When we look at wasting, the picture is even bleaker,       Using data from the Domestic Household Surveys
     as the proportion of wasted children did not decline        for 48 countries over the last 12 years, we found a
     as did the rest of CDI indicators, but actually             consistent pattern in keeping with this. As Figure 5
     rose by 1.2%. The indicator appears, therefore, to be       (on page 18) illustrates, the greater the child nutrition
     registering some of the setbacks that analysts would        inequalities between the wealthiest quintile and the
     expect to see as a result of the triple ‘food-price, fuel   two poorest quintiles, the worse a country appears to
     and financial’ crises, especially the dramatic hikes in     perform overall.

16
% of children affected                                                                                                                                                                                % of children affected


                                                                                                                                                                                                                                                                                                  0
                                                                                                                                                                                                                                                                                                      5
                                                                                                                                                                                                                                                                                                                     10
                                                                                                                                                                                                                                                                                                                          15
                                                                                                                                                                                                                                                                                                                                  20
                                                                                                                                                                                                                                                                                                                                            25
                                                                                                                                                                                                                                                                                                                                                             30
                                                                                                                                                                                                                                                                                                                                                                  35
                                                                                                                                                                                                                                                                                                                                                                       40
                                                                                                                                                                                                                                                                                                                                                                                  45
                                                                                                                                                                                                                                                                                                                                                                                         50


                                                                                                     0
                                                                                                         2
                                                                                                             4
                                                                                                                     6
                                                                                                                            8
                                                                                                                                  10
                                                                                                                                         12
                                                                                                                                                  14
                                                                                                                                                            16
                                                                                                                                                                  18
                                                                                                                                                                       20
                                                                                  Ea                                                                                                                                                                                Ea
                                                                                     s                                                                                                                                                                                             st
                                                                                      tA                                                                                                                                                                                                A
                                                                                        sia                                                                                                                                                                                                 sia
                                                                           C                                                                                                                                                                                  C
                                                                            EE                                                                                                                                                                                    EE
                                                                La                 an                                                                                                                                                               La                    an
                                                                                         d                                                                                                                                                                                  d
                                                                     tin                     C                                                                                                                                                         tin              C


              Wasting 2005–10
                                         Wasting 2000–04
                                                                                                                                                                                                   Stunting 2005–10
                                                                                                                                                                                                                            Stunting 2000–04
                                                                                       IS                                                                                                                                                                                  IS
                                                                 th Am                                                                                                                                                                               th Am
                                                                    e er                                                                                                                                                                                e er
                                                                       C ic                                                                                                                                                                                C ic
                                                                         a       a                                                                                                                                                                           a       a
                                                                   M rib an                                                                                                                                                                            M rib an
                                                                      id      be d                                                                                                                                                                        id      be d
                                                                        d         a                                                                                                                                                                         d         a
                                                                    no le E n                                                                                                                                                                           no le E n
                                                                        rt as                                                                                                                                                                               rt as
                                                                          h ta                                                                                                                                                                                h ta
                                                               Su           A                                                                                                                                                                      Su           A
                                                                  b-           fr nd                                                                                                                                                                  b-           fr nd
                                                                                 ic                                                                                                                                                                                  ic
                                                                     Sa
                                                                        ha          a                                                                                                                                                                    Sa
                                                                                                                                                                                                                                                            ha          a
                                                                           ra                                                                                                                                                                                  ra
                                                                              n                                                                                                                                                                                   n
                                                                                A                                                                                                                                                                                   A
                                                                                   fr                                                                                                                                                                                  fr
                                                                                      ic                                                                                                                                                                                  ic
                                                                                         a                                                                                                                                                                                   a
                                                                          So                                                                                                                                                                                  So
                                                                             ut                                                                                                                                                                                  ut
                                                                                 h                                                                                                                                                                                   h
                                                                                   A                                                                                                                                                                                   A
                                                                                      sia                                                                                                                                                                                 sia


                                                                                                                         % of children affected                                                                                                                                                   0                            % of children affected
                                                                                                                                                                                                                                                                                                      5
                                                                                                                                                                                                                                                                                                                     10
                                                                                                                                                                                                                                                                                                                          15
                                                                                                                                                                                                                                                                                                                                  20
                                                                                                                                                                                                                                                                                                                                            25
                                                                                                                                                                                                                                                                                                                                                             30
                                                                                                                                                                                                                                                                                                                                                                  35
                                                                                                                                                                                                                                                                                                                                                                       40
                                                                                                                                                                                                                                                                                                                                                                                  45
                                                                                                                                                                                                                                                                                                                                                                                         50


                                                                                                     0
                                                                                                         2
                                                                                                                 4
                                                                                                                          6
                                                                                                                                  8
                                                                                                                                           10
                                                                                                                                                       12
                                                                                                                                                                 14
                                                                                                                                                                       16
                                                                           Lo                                                                                                                                                                                 Lo
                                                                             w                                                                                                                                                                                  w
                                                                                     in                                                                                                                                                                                     in
                                                                                          co                                                                                                                                                                                       co
                                                                                             m                                                                                                                                                                                          m
                                                               Lo                                e                                                                                                                                                 Lo                                        e
                                                                 w                                                                                                                                                                                   w
                                                                  -m                                                                                                                                                                                     -m
                                                                           id                                                                                                                                                                                id


     Wasting 2005–10
                                Wasting 2000–04
                                                                                                                                                                                        Stunting 2005–10
                                                                                                                                                                                                                 Stunting 2000–04
                                                                             dl                                                                                                                                                                                dl
                                                                                 e                                                                                                                                                                                  e
                                                                                     in                                                                                                                                                                                     in
                                                                                          co                                                                                                                                                                                       co
                                                           U                                 m                                                                                                                                                 U                                        m
                                                               pp                                e                                                                                                                                              pp                                           e
                                                                    er                                                                                                                                                                              er
                                                                      -m                                                                                                                                                                              -m
                                                                           id                                                                                                                                                                                id
                                                                                                                                                                                                                                                                                                                                                                                              Figure 4: Changes in Stunting and Wasting, 2000–2004 to 2005–2010


                                                                             dl                                                                                                                                                                                dl
                                                                                 e                                                                                                                                                                                  e
                                                                                     in                                                                                                                                                                                     in
                                                                                         co                                                                                                                                                                                        co
                                                                                             m                                                                                                                                                                                          m
                                                                                              e                                                                                                                                                                                              e

                                                                           H                                                                                                                                                                                  H
                                                                            ig                                                                                                                                                                                 ig
                                                                               h                                                                                                                                                                                   h
                                                                                     in                                                                                                                                                                                     in
                                                                                          co                                                                                                                                                                                       co
                                                                                             m                                                                                                                                                                                          m
                                                                                                 e                                                                                                                                                                                           e


                                                                                                                                                                       undernutrition                                                                                  increased                          threaten                 crises        financial                  and        ood             3  F


17
the child development index 2012

                                         Figure 5: Prevalence of underweight children and inequality in wealth
                                         by country
                                                                                                      50                                                     y = 1.353x + 2.451
                                     Inequalities in proportion of underweight children between the


                                                                                                                                                             R2 = 0.6088
                                                                                                      45
                                            wealthiest quintile and the bottom two quintiles


                                                                                                      40


                                                                                                      35


                                                                                                      30


                                                                                                      25


                                                                                                      20


                                                                                                      15


                                                                                                      10


                                                                                                       5


                                                                                                       0
                                                                                                       	 0	 5	 10	15	 20	25	30	35
                                                                                                                National underweight prevalence

                                   Source of basic data: DHS (various years), Underweight data follow WHO Growth Standard


                                   In the Save the Children study of social protection,                                     for example, low wages and extreme inequalities
                                   A Chance to Grow,54 we showed that using social                                          in the distribution of productive assets. Such
                                   transfers to increase the share of income of the                                         measures, including social transfers to address
                                   poorest two quintiles by just 10% – at a total cost                                      remaining inequalities, can not only support better
                                   of just 1.5% of GDP – would reverse the increase                                         long-term outcomes on child undernutrition, of the
                                   in people suffering undernutrition and lead to a                                         type captured by the nutrition component of the
                                   substantial reduction simply by reducing the number                                      Child Development Index, but can also play a vital
                                   of households unable to afford sufficient nutrition.                                     role in limiting the effects of crisis by ensuring a
                                                                                                                            social safety net operates.
                                   Of course, serious policy attention must be paid to
                                   the deeper structural causes of inequality – around,


18
Conclusions


The Child Development Index combines                     also shown the greatest acceleration in the most
measures of primary school enrolment,                    recent period.
child mortality and nutrition to provide a               Less encouraging has been the progress on
simple measure of child well-being that                  reducing underweight prevalence among children
can be tracked across time and compared                  under five. When we break down the different
across countries.                                        components of the Index – health, education and
                                                         nutrition – data shows that progress has been
The 2012 edition of the Child Development
                                                         mainly driven by improvements in health and
Index tells a story of success. This edition of the
                                                         education. Undernutrition has consistently
Index shows that, since the mid-1990s, substantial
                                                         lagged behind and remains one of the major
progress has been made in addressing the most basic
                                                         reasons depressing further progress on
threats to child survival and well-being. On average,
                                                         child well-being. Whereas health and education
the lives of children around the world improved by
                                                         have improved well above the average of the Index,
more than 30%. This means that the chances of a
                                                         when progress accelerated in the second half of the
child going to school were one-third higher, and the
                                                         2000s (at a rate of 23% and 32% respectively), in
chances of an infant dying before their fifth birthday
                                                         comparison, child undernutrition performed very
were one-third lower, at the end of the 2000s than
                                                         poorly, improving at the much lower rate of 13%.
a decade before. During this period child well-being
                                                         In the world’s poorest countries, progress was even
improved in 90% of the countries surveyed.
                                                         weaker, at just below 10%.
Moreover, progress has been dramatically accelerating.
                                                         Even more concerning is that the already slow
From the first to the second half of the 2000s, the
                                                         progress in tackling undernutrition has been further
overall improvement rates in child well-being
                                                         jeopardised by the effects of the global food and
almost doubled compared with the end of the
                                                         financial crises. The proportion of children
1990s (improvement rates were 22%, up from 12%).
                                                         wasting (suffering from acute weight loss), which
Acceleration of progress in under-five mortality and
                                                         is commonly used to indicate the severity of food
primary school enrolment was even more impressive:
                                                         crises, actually rose in the second half of the
the rate of improvement more than doubled during
                                                         2000s. Increases in wasting are worrying in their
the 2000s (from 11% to 23%; and from 14% to
                                                         own right, and also because they could be an
32% respectively).
                                                         early warning sign of further deteriorations
In addition to the accelerating progress it is clear     in chronic undernutrition if the situation is not
that – since the 2000s – developing countries            quickly reversed.
experienced faster than average rates of
                                                         Moreover, inequalities between countries are still
progress than developed countries. While the
                                                         big. Whereas developed countries are very close to
world’s poorest countries, mostly in sub-Saharan
                                                         the highest score of the ranking, the average child in
Africa and south Asia, had the weakest performance,
                                                         developing countries is almost eight times worse off
each group also includes countries that have shown
                                                         than if she or he had been born in a rich country.
very strong improvements. These groups have


                                                                                                                  19
RECOMMENDATIONS


     The recent G8 agreement on the New                        •	 Ensure that national nutrition policies and social
     Alliance on Food Security and Nutrition; the                 transfers are aimed at reducing inequalities and the
     World Health Assembly support for a global                   disproportionate impact of undernutrition among
     target to reduce child stunting by 40% by                    the poorest and most vulnerable groups in society.
     2025; and the commitment of the UK Prime                     Action on other drivers of undernutrition is also
                                                                  necessary: female education, family planning and
     Minister David Cameron to hold a hunger
                                                                  key maternal and child health interventions.
     summit during the 2012 Olympic Games in
     London are all welcome steps in putting the               We call on bilateral and multilateral donors to:
     critical issues of hunger and undernutrition              •	 Maintain the recent focus on these issues.
     higher on the international agenda. But this                 The hunger crisis can be dealt with but it
     report highlights the scale of the challenge.                will need a concerted effort, not a stand-
                                                                  alone moment.
     Save the Children is calling on the international         •	 Scale up multi-year funding for nutrition,
     community to seize these opportunities to redouble           putting in place outcome targets to
     its efforts to tackle hunger and undernutrition. It          reduce malnutrition and to support
     needs to do this through direct interventions during         the establishment of social transfer
     crises and by addressing the global drivers of under-        programmes – above all, for those countries
     nutrition – including the causes of this unprecedented       that will find it most difficult to reduce stunting.
     period of rising and high food prices, coupled with       •	 Address the underlying drivers of high food
     inequality, which has seen the numbers of people living      prices, which are at the root of ever more
     in hunger rise for the first time in a generation.           frequent food crises, such as the ones that
     We call on the developing country governments to:            we are currently witnessing in the Sahel and the
     •	 Build on the target recently approved by the              Horn of Africa. In particular, invest in smallholder
        World Health Organization of a 40% reduction in           agricultural development, prioritising support for
        the number of children who are stunted by 2015,           women smallholder producers and sustainable
        by setting up national policies and specific targets      farming approaches.
        for reducing child stunting.                           •	 Commit to support the generation and use
     •	 Strengthen social transfer programmes (such as            of better data to improve transparency and
        cash transfers) as a key policy tool to combat            accountability around these vital issues. This
        hunger and undernutrition, in times of stability          report has also highlighted the weaknesses in basic
        and as an effective crisis response tool that is          child well-being data; the same data is, of course,
        easily scalable.                                          crucial to effective policy responses.


20
Appendix


Table A1: Child Development Index score and rank, all countries, over time

 CDI rank 	 CDI rank	 CDI rank	 Change	 Country	         CDI score	 CDI score	 CDI score
 1995–99	2000–04	2005–10	 1995–2010		                    1995–99	2000–04	2005–10
 	
 2	1	1	+1	Japan	                                         0.53	0.44	0.35
 	
 5	4	2	+3	Spain	                                         0.75	0.59	0.55
 22	
 	         9	       3	 +19	             Germany	         4.69	0.81	0.64
 12	 14	
 	                  4	        +8	       Italy	           1.14	0.96	0.70
 	
 6	 10	             5	        +1	       France	          0.87	0.85	0.74
 10	
 	         8	       6	        +4	       Canada	          1.09	0.78	0.74
 16	 18	
 	                  7	        +9	       Switzerland	     2.49	2.52	0.82
 	
 3	5	8	 -5	Norway	                                       0.55	0.62	0.89
 	
 4	7	9	 -5	United Kingdom	0.70	0.69	0.92
 	
 7	 11	 10	                   -3	       Netherlands	     0.88	0.86	0.93
 	
 8	        6	 11	             -3	       Iceland	         0.93	0.65	1.01
 11	 13	 12	
 	                            -1	       Belgium	         1.10	0.96	1.05
 	
 15	 16	 13	                  +2	       Luxemburg	       1.71	1.63	1.30
 	
 9	        2	 14	             -5	       Finland	         0.97	0.53	1.37
 13	 15	 15	
 	                            -2	       Austria	         1.49	1.60	1.49
 17	 17	 16	
 	                            +1	       Australia	       2.65	2.09	1.54
 30	 29	 17	 +13	
 	                                      Croatia	         6.03	5.39	1.62
 18	 19	 18	
 	                            +0	       Ireland	         2.79	2.56	1.68
 	
 1	        3	 19	             -18	      Sweden	          0.50	0.55	1.85
 14	 12	 20	
 	                            -6	       Denmark	         1.53	0.86	1.87
 23	 20	 21	
 	                            +2	       Cuba	            4.86	2.83	2.27
 24	 25	 22	
 	                            +2	       Chile	           5.10	4.30	2.83
 					         United States of
 19	21	23	 -4                                            2.98	3.04	2.86
 	            	America	
 20	 23	 24	
 	                            -4	       Argentina	       4.33	3.60	2.95
 36	 22	 25	 +11	
 	                                      Costa Rica	      6.95	3.47	3.15
 38	 31	 26	 +12	
 	                                      Tunisia	         7.70	5.76	3.40
 27	 30	 27	
 	                            +0	       Uruguay	         5.80	5.53	3.62
 28	 24	 28	
 	                            +0	       Czech Republic	 5.81	3.67	3.63
 42	 39	 29	 +13	
 	                                      China	           8.23	6.39	3.69
 25	 26	 30	
 	                            -5	       Bahrain	         5.76	4.66	3.98
                                                                           continued overleaf


                                                                                                21
Table A1: Child Development Index score and rank, all countries, over time continued
the child development index 2012


                                    CDI rank 	 CDI rank	 CDI rank	 Change	 Country	                   CDI score	 CDI score	 CDI score
                                    1995–99	2000–04	2005–10	 1995–2010		                              1995–99	2000–04	2005–10
                                    32	      33	       31	        +1	       Belize	                    6.78	 6.07	4.06
                                    				                                    Republic of
                                    35	27	32	 +3                                                       6.84	 4.68	4.07
                                                 	                          Macedonia (FYROM)	
                                    21	      28	       33	       -12	       Belarus	                   4.37	 4.95	4.30
                                    29	      34	       34	        -5	       Romania	                   5.93	 6.12	4.32
                                    39	      38	       35	        +4	       Mexico	                    7.79	 6.29	4.40
                                    43	      44	       36	        +7	       Brazil	                    8.84	 6.96	4.44
                                    37	      47	       37	        +0	       Russian Federation	        7.48	     7.17	     4.47
                                    51	      48	       38	       +13	       Peru	                      9.54	 7.37	4.50
                                    33	      41	       39	        -6	Qatar	                            6.83	 6.68	4.71
                                    53	      43	       40	       +13	       Ecuador	                  10.00	 6.93	4.93
                                    34	      32	       41	        -7	       Panama	                    6.83	 5.78	4.94
                                    44	      37	       42	        +2	       Malaysia	                  8.89	 6.27	5.17
                                    62	      67	       43	       +19	       Georgia	                  12.58	11.55	5.27
                                    48	      63	       44	        +4	       Kuwait	                    9.10	 9.85	5.32
                                    41	      42	       45	        -4	       Jordan	                    8.17	 6.73	5.33
                                    49	      45	       46	        +3	Venezuela	                        9.28	 7.10	5.69
                                    73	      56	       47	       +26	       Turkey	                   15.25	 8.86	5.70
                                    69	      61	       48	       +21	       El Salvador	              14.74	     9.66	     5.87
                                    57	      46	       49	        +8	       Thailand	                 10.37	 7.10	6.24
                                    64	      55	       50	       +14	       Algeria	                  12.63	 8.78	6.35
                                    56	      54	       51	        +5	       Kazakhstan	               10.33	 8.73	6.35
                                    50	      53	       52	        -2	       Colombia	                  9.42	 8.58	6.66
                                    65	      62	       53	       +12	       Egypt, Arab Republic	     12.66	     9.71	     6.69
                                    52	      36	       54	        -2	       Syrian Arab Republic	      9.66	     6.25	     6.97
                                    46	      60	       55	        -9	       Trinidad and Tobago	       8.96	     9.60	     7.26
                                    40	      49	       56	       -16	       Moldova	                   7.95	 7.82	7.26
                                    78	      69	       57	       +21	       Nicaragua	                17.14	12.29	7.40
                                    31	      35	       58	       -27	       Paraguay	                  6.18	 6.24	7.50
                                    71	      82	       59	       +12	       Mongolia	                 15.19	14.86	7.59
                                    75	      76	       60	       +15	       Iran, Islamic Republic	   15.99	    14.01	     7.93
                                    45	      57	       61	       -16	       Lebanon	                   8.90	 9.19	8.05
                                    66	      68	       62	        +4	       United Arab Emirates	 13.14	        12.23	     8.06
                                    77	      71	       63	       +14	       Honduras	                 16.93	12.70	8.09
                                    61	      64	       64	        -3	       Saudi Arabia	             11.57	    10.04	     8.13
                                    55	      58	       65	       -10	       Mauritius	                10.19	 9.40	8.50
                                    47	      51	       66	       -19	       Jamaica	                   9.08	 8.03	8.53
                                    59	      66	       67	        -8	       Suriname	                 11.28	11.00	8.62


22
Table A1: Child Development Index score and rank, all countries, over time continued

 CDI rank 	 CDI rank	 CDI rank	 Change	 Country	               CDI score	 CDI score	 CDI score
 1995–99	2000–04	2005–10	 1995–2010		                          1995–99	2000–04	2005–10


                                                                                                        appendix
 	54	      52	       68	      -14	       Armenia	              10.18	      8.58	         8.66
 	 67	     65	       69	       -2	       Kyrgyz Republic	      13.76	     10.61	         8.74
 	70	      70	       70	       +0	       Bolivia	              14.87	     12.42	         9.04
 	91	      84	       71	      +20	       Maldives	             23.49	     14.97	         9.15
 	89	      85	       72	      +17	       Guatemala	            21.07	     15.23	         9.39
 	 72	     72	       73	       -1	       Sri Lanka	            15.23	     12.90	         9.74
 	74	      74	       74	       +0	       Guyana	               15.93	     13.40	       10.22
 	58	      59	       75	      -17	       Albania	              10.85	      9.57	       10.25
 	 63	     50	       76	      -13	       Dominican Republic	   12.58	      7.86	       10.31
 	85	      78	       77	       +8	       Morocco	              19.62	     14.34	       10.45
 	 26	     40	       78	      -52	       West Bank and Gaza	    5.79	      6.48	       10.56
 	84	      81	       79	       +5	Vietnam	                     19.46	     14.75	       11.26
 	76	      83	       80	       -4	       Philippines	          16.89	     14.86	       11.35
 	79	      77	       81	       -2	       Iraq	                 17.52	     14.03	       11.40
 	88	      79	       82	       +6	       Indonesia	            20.80	     14.38	       11.40
 	68	      75	       83	      -15	       Oman	                 14.25	     13.77	       11.55
 	 60	     73	       84	      -24	       South Africa	         11.48	     13.09	       12.25
 	87	      86	       85	       +2	       Tajikistan	           20.62	     16.24	       12.43
 					           Sao Tome and
   81	80	86	 -5                                                18.66	 14.56	13.23
 	              	Principe	
 	80	      88	       87	       -7	       Azerbaijan	           17.82	     18.66	       14.12
 	83	      87	       88	       -5	       Gabon	                19.02	     16.38	       14.62
 	82	      89	       89	       -7	       Botswana	             18.70	     19.50	       15.27
 	92	      91	       90	       +2	       Namibia	              25.18	     22.41	       15.81
 	104	    106	       91	      +13	       Bhutan	               33.88	     29.28	       16.28
 	122	    107	       92	      +30	       Tanzania	             42.58	     29.69	       16.66
 	106	     97	       93	      +13	       Cambodia	             35.20	     26.79	       18.61
 	94	      93	       94	       +0	       Myanmar	              27.07	     24.70	       18.68
 	90	      96	       95	       -5	       Swaziland	            22.41	     25.54	       18.86
 	86	      90	       96	      -10	       Zimbabwe	             20.42	     21.57	       19.23
 	102	     94	       97	       +5	       Uganda	               33.13	     24.80	       19.53
 	110	     95	       98	      +12	       Malawi	               36.17	     24.98	       19.54
 	117	    120	       99	      +18	       Rwanda	               39.26	     35.60	       19.94
 	107	    110	      100	       +7	       Comoros	              35.34	     31.60	       20.64
 	111	    118	      101	      +10	       Zambia	               36.40	     34.47	       20.79
 	97	     102	      102	       -5	       Kenya	                30.42	     28.52	       21.18
 	120	    115	      103	      +17	       Madagascar	           41.01	     33.94	       22.20
 	99	      99	      104	       -5	       Cameroon	             31.00	     28.10	       22.52
                                                                                   continued overleaf


                                                                                                          23
Table A1: Child Development Index score and rank, all countries, over time continued
the child development index 2012


                                    CDI rank 	 CDI rank	 CDI rank	 Change	 Country	           CDI score	 CDI score	 CDI score
                                    1995–99	2000–04	2005–10	 1995–2010		                      1995–99	2000–04	2005–10
                                    125	 114	 105	 +20	
                                    	                                       Benin	            43.15	32.99	22.77
                                    108	 105	 106	
                                    	                            +2	        Lao PDR	          35.44	29.10	22.81
                                    109	 101	 107	
                                    	                            +2	        Bangladesh	       36.16	28.36	22.82
                                    113	 116	 108	
                                    	                            +5	        Senegal	          37.22	34.00	22.90
                                    103	 111	 109	
                                    	                             -6	       Ghana	            33.63	31.92	23.04
                                    	
                                    93	 100	 110	                -17	       Togo	             26.83	28.25	23.26
                                    	
                                    98	 109	 111	                -13	       Congo, Republic	 30.48	31.37	23.32
                                    100	 103	 112	
                                    	                            -12	       India	            31.22	28.72	23.46
                                    116	 112	 113	
                                    	                            +3	        Nepal	            38.92	32.57	25.01
                                    	
                                    96	       92	 114	           -18	       Lesotho	          28.40	24.40	25.01
                                    127	 123	 115	 +12	
                                    	                                       Mozambique	       45.35	38.18	25.38
                                    101	 113	 116	
                                    	                            -15	       Mauritania	       32.03	32.80	25.63
                                    105	 104	 117	
                                    	                            -12	       Gambia, The	      35.19	28.73	25.68
                                    119	 119	 118	
                                    	                            +1	        Timor-Leste	      40.47	34.79	28.16
                                    140	 134	 119	 +21	
                                    	                                       Angola	           59.56	48.16	28.22
                                    115	 121	 120	
                                    	                             -5	       Pakistan	         38.64	36.50	30.15
                                    129	 126	 121	
                                    	                            +8	        Guinea	           46.48	41.78	30.47
                                    132	 133	 122	 +10	
                                    	                                       Guinea-Bissau	    49.43	47.94	31.02
                                    121	 122	 123	
                                    	                             -2	       Yemen, Republic	 42.03	36.89	31.17
                                    133	 132	 124	
                                    	                            +9	        Burundi	          50.63	47.27	32.35
                                    114	 108	 125	
                                    	                            -11	       Haiti	            37.68	31.10	32.42
                                    138	 136	 126	 +12	
                                    	                                       Ethiopia	         54.11	49.35	32.53
                                    	
                                    95	       98	 127	           -32	       Equatorial Guinea	28.30	27.59	32.93
                                    112	 117	 128	
                                    	                            -16	       Côte d’Ivoire	    37.06	34.02	34.42
                                    123	 127	 129	
                                    	                             -6	       Sudan	            42.79	41.93	35.77
                                    124	 125	 130	
                                    	                             -6	       Nigeria	          43.06	41.70	37.07
                                    135	 137	 131	
                                    	                            +4	        Liberia	          51.24	50.82	37.90
                                    130	 124	 132	
                                    	                             -2	       Eritrea	          48.81	40.85	39.39
                                    137	 135	 133	
                                    	                            +4	        Mali	             54.02	48.40	39.53
                                    139	 140	 134	
                                    	                            +5	        Sierra Leone	     55.45	55.51	39.71
                                    128	 130	 135	
                                    	                             -7	       Djibouti	         46.02	46.25	40.03
                                    					              Central African
                                    118	128	 136	 -18                                         40.40	44.65	41.47
                                    	                 	Republic	
                                    					              Congo, Democratic
                                    126	131	 137	 -11                                         43.17	46.46	43.01
                                    	                 	Republic	
                                    136	 138	 138	
                                    	                             -2	       Burkina Faso	     52.17	52.58	43.93
                                    131	 129	 139	
                                    	                             -8	       Chad	             49.05	45.91	44.11
                                    141	 141	 140	
                                    	                            +1	        Niger	            70.04	62.19	48.73
                                    134	 139	 141	
                                    	                             -7	       Somalia	          50.93	55.02	54.5


24
endnotes

1
  This percentage refers only to the CDI sample, which includes 141                28
                                                                                      World Health Organization and UNICEF (2012) Countdown to 2015:
countries. See Box 1 for further methodological details.                           Building a Future for Women and Children: the 2012 Report. Other countries
2
  The CDI assesses a sample of 141 countries. See Box 1 for further                include Cameroon, Chad, Democratic Republic of Congo, Lesotho, Somalia
methodological details.                                                            and Zimbabwe.
3
  World Health Organization and UNICEF (2012) Countdown to 2015:
                                                                                   29
                                                                                      Education data from United Nations and World Bank data sets
Building a Future for Women and Children: the 2012 Report                          30
                                                                                      L Jamieson et al (eds) (2011) South African Child Gauge 2010/2011, Cape
4
  Ibid                                                                             Town: Children’s Institute, University of Cape Town
5
  World Bank and Education in Indonesia http://web.worldbank.org/
                                                                                   31
                                                                                      Ibid
WBSITE/EXTERNAL/COUNTRIES/EASTASIAPACIFICEXT/0,,contentMD                          32
                                                                                      UNICEF (2009) State of the World’s Children 2009, New York
K:23187196~pagePK:146736~piPK:146830~theSitePK:226301,00.html                      33
                                                                                      South African Social Security Agency (SASSA) Fact Sheet No. 4 of 2012,
6
  UNICEF http://www.unicef.org/infobycountry/indonesia_statistics.html             30 April 2012
7
  Ibid                                                                             34
                                                                                      Department of Social Development, SASSA and UNICEF (2012) The
8
  Ministry of National Development Planning/National Development                   South African Child Support Grant Impact Assessment: Evidence from a survey of
Planning Agency (BAPPENAS) Republic of Indonesia – Report on the                   children, adolescents and their households. Pretoria: UNICEF South Africa
Achievement of the Millennium Development Goals Indonesia 2010                     35
                                                                                      Ibid
9
  I Rafiqah and I Blackett (2010) Public-Private Partnership for Handwashing       36
                                                                                      Save the Children website: http://www.savethechildren.org.uk/what-we-
with Soap in Indonesia http://www.wateraidcommunity.org.au/document.               do/emergencies/west-africa-appeal
doc?id=28                                                                          37
                                                                                      The full Index, for each of the three periods 1995–99, 2000–04 and
10
   United Nations Population Fund (2011) State of the World’s Midwifery            2005–10, can be found in Table A1 of the Appendix.
2011: Delivering health, saving lives                                              38
                                                                                      See UNICEF’s State of the World’s Children reports for 2007 and 2012
11
   UNICEF http://www.unicef.org/infobycountry/indonesia_statistics.html            39
                                                                                      See www.childinfo.org for the latest data on under-five mortality.
12
   Ibid                                                                            40
                                                                                      World Health Organization and UNICEF (2012) Countdown to 2015:
13
   Save the Children, Indonesia’s Ministry of Social Affairs, UNICEF (2077)        Building a Future for Women and Children: the 2012 Report
Someone That Matters: The quality of care in childcare institutions in Indonesia   41
                                                                                      Ibid
14
   A Sumner, A Suryahadi and N Thang (2012) Poverty And Inequalities In            42
                                                                                      Ibid
Middle-Income Southeast Asia Institute of Development Studies                      43
                                                                                      Countdown to 2015 countries are 75 countries which together account
15
   Demographic and Health Survey for Indonesia 2007, data on under-five            for over 95% of under-five mortality globally.
mortality disaggregated by wealth quintiles                                        44
                                                                                      Africa’s Child Health Miracle: The Biggest, Best Story in Development, http://
16
   See www.childinfo.org for the most up-to-date data on child                     blogs.cgdev.org/globaldevelopment/2012/05/africas-child-health-miracle-
undernutrition. The 65th World Health Assembly adopted the Maternal,               the-biggest-best-story-in-development.php?utm_
Infant and Young Child Nutrition Implementation plan which includes                45
                                                                                      Analyses of under-five mortality rates disaggregated by wealth quintile
a global stunting reduction target of 40% by 2025. The Indonesian
                                                                                   from the Demographic and Health Surveys show this.
government also committed to reduce stunting prevalence among
under-five children from 37 per cent in 2007 to 32 per cent in 2014 in its
                                                                                   46
                                                                                      The 2011 Global Compact on Learning provides a policy agenda and
National Mid-term Development Plan 2010–2014.                                      concrete steps to advance learning for girls and boys in some of the
                                                                                   world’s poorest countries http://www.globalcompactonlearning.org/
17
   World Health Organization and UNICEF (2012) Countdown to 2015:
Building a Future for Women and Children: the 2012 Report
                                                                                   47
                                                                                      UNESCO EFA Global Monitoring Report http://www.unesco.org/new/
                                                                                   en/education/themes/leading-the-international-agenda/efareport/ , World
18
   Tanzanian Demographic and Health Survey (2009/10)
                                                                                   Bank 2011 “Learning for All: Investing in People’s Knowledge and Skills to
19
   Save the Children (2011) Analysis of Health Budget and Financing for            Promote development”. http://siteresources.worldbank.org/EDUCATION/
Maternal, Newborn and Child Health in Tanzania                                     Resources/ESSU/Education_Strategy_4_12_2011.pdf
20
   World Health Organization, Accountability for Women’s and Children’s            48
                                                                                      Centre for Universal Education at Brookings (2011) A Global Compact
health: The United Republic of Tanzania. Available at: http://www.who.int/         on Learning: Taking Action on Education in Developing Countries http://www.
woman_child_accountability/countries/tza/en/index.html Accessed 15 June            brookings.edu/~/media/events/2011/6/15%20education%20compact/0609_
2012                                                                               global_compact.pdf
21
   Ibid                                                                            49
                                                                                      UNESCO (2010) Education and the Millennium Development Goals, Paris:
22
   Save the Children UK, UNICEF, Overseas Development Institute (2012)             UNESCO http://www.unesco.org/fileadmin/MULTIMEDIA/HQ/ED/GMR/
Progress in Child Well-being: Building on What Works                               pdf/gmr2010/MDG2010_Facts_and_Figures_EN.pdf
23
   Progress of the Scaling Up Nutrition Movement in Tanzania http://www.           50
                                                                                      Centre for Universal Education at Brookings (2011) A Global Compact
scalingupnutrition.org/wp-content/uploads/2011/09/Tanzania-SUN-NYC-                on Learning: Taking Action on Education in Developing Countries http://www.
EE-2011.pdf                                                                        brookings.edu/~/media/events/2011/6/15%20education%20compact/0609_
24
   Progress Report on Creation of the Partnership for Nutrition in                 global_compact.pdf
Tanzania (PANITA) for the Period of September 2010-August 2011, http://            51
                                                                                      UNESCO, Education and the Millennium Development Goals (2010) Paris:
nutritiontanzania.org/cms/index.php?option=com_content&view=article&i              UNESCO, 2010)http://www.unesco.org/fileadmin/MULTIMEDIA/HQ/ED/
d=16&Itemid=24                                                                     GMR/pdf/gmr2010/MDG2010_Facts_and_Figures_EN.pdf
25
   United Republic of Tanzania (2011) Guidelines for Councils for the              52
                                                                                      See, for example, the survey in Helen Young and Susanne Jaspars (2006)
preparation of Plan and Budget for nutrition 2012-13                               ‘The meaning and measurement of acute malnutrition in emergencies: A
26
   EU Health Overseas Development Assistance and Aid Effectiveness,                primer for decision-makers’, ODI/Humanitarian Practice Network: http://
Country Briefing 2, October 2010, Health Spending in Tanzania: The Impact          www.odihpn.org/documents/networkpaper056.pdf
of Current Aid Structures and Aid Effectiveness                                    53
                                                                                      Save the Children (2009) How the Global Food Crisis is hurting Children: The
27
   Save the Children website, Occupied Palestinian territory http://www.           impact of the food price hike on a rural community in northern Bangladesh.
savethechildren.org.uk/where-we-work/middle-east/occupied-palestinian-             54
                                                                                      Save the Children (2012) A Chance to Grow: How social protection can
territory                                                                          tackle malnutrition and promote economic opportunities


                                                                                                                                                                       25
Greenland
                                                                                                                                                                                                            (Denmark)
                                                                                                                                                                                                                                                                                                                                     Finland
                                                                                                                                                                                                                                                                                                     Norway
                                                                                                                                                                                                                                                    Iceland       Faeroe Is                                     Sweden
                                                                                                                                                                                                                                                                   (Den)                                                                                                              Russia
                                                                                                                                                                                                                                                                                                                                             Estonia
                                                                                                                                                                                                                                                                                       United                              Latvia
                                                                                                                                                                                                                                                                                      Kingdom                           Lithuania
                                                                                                                                                                                                                                                                                           Denmark
                                                                                              Canada                                                                                                                                                          Rep of                     Netherlands
                                                                                                                                                                                                                                                                                                                   Poland       Belarus
                                                                                                                                                                                                                                                              Ireland                              Germany
                                                                                                                                                                                                                                                                                        Belgium Lux.         Cze.
                                                                                                                                                                                                                                                                                                                    Slovakia Ukraine
                                                                                                                                                                                                                                                                                                     Lie.
                                                                                                                                                                                                                                                                                              Swi.        AustriaHungary Moldova
                                                                                                                                                                                                                                                                                       France              Slov.          Romania
                                                                                                                                                                                                                                                                                                                 Cro.
                                                                                                                                                                                                                                                                                           Monaco San Marino Bos.     Serbia
                                                                                                                                                                                                                                                                                                                            Bulgaria
                                                                                                                                                                                                                                                                                    Andorra                       Mon. Kos.
                                                                                                                                                                                                                                                                                                                        FYR                                     Georgia
                                                                                                                                                                                                                                The Azores (Port)                                                                   Alb.Mac.
                                                                                                                                                                                                                                                                                                       Italy
                                                                                                                                                                                                                                                                                 Spain                                                 Turkey                    Armenia Azerbaijan
                                                                                                                                                                                                                                                             Portugal                                                                                                           Turkmenistan
                                                                                                       United States
                                                                                                                                                                                                                                                                                                                      Greece
                                                                                                                                                                                                                                                                                                                  Malta                    Cyprus       Syria
                                                                                                                                                                                                                                                                                                           Tunisia                            Lebanon                                      Iran
                                                                                                                                                                                                                                       Madeira (Port)                    Morocco                                                                Israel                Iraq
                                                                                                                                                                             Bermuda (UK)                                                                                                                                                              OPT.
                                                                                                                                                                                                                                                                                                                                                 OPT.
                                                                                                                                                                                                                                                                                                                                                         Jordan

                                                                                                                                                                                                                                      Canary Is (Sp)                                  Algeria                                                                             Kuwait
                                                                                                                                                                                                                                                                                                                  Libya
                                                                                                                                                                                                                                                                                                                                           Egypt                             Bahrain Qatar
                                                                                                                                                         Bahamas
                                                                                                                                                                                                                                               Western
                                                                                                                                                                                                                                               Sahara                                                                                                                              UAE
                                                                                                                                     Cuba
                                                                                                                                                                                                                                                                                                                                                                    Saudi Arabia                Oman
                      Hawaiian                                                                                                                                   Turks & Caicos Is
                       Islands                                                                                                                                         (UK)
                        (USA)                                                  Revilla Gigedo Is        Mexico
                                                                                                                                     Cayman Is            Dominican Rep.                                                                                       Mauretania
                                                                                     (Mex)                                                                    Puerto Rico (US)
                                                                                                                                                                     Anguilla (UK)                                                                                                   Mali             Niger              Chad
                                                                                                                                        Jamaica   Haiti
                                                                                                                                Belize                       St Kitts Antigua & Barbuda                                                                                                                                                              Eritrea
                                                                                                                                       Honduras              & Nevis Guadeloupe (Fr)                                            Cape Verde
                                                                                                                                                             Dominica
                                                                                                                   Guatemala                                            Martinique (Fr)                                                    Senegal                                                                                         Sudan                                   Yemen
                                                                                                                             El         Nicaragua     Curaçao St Lucia Barbados                                                         The Gambia                               Burkina
                                                                                                                         Salvador                                                                                                                                                 Faso                                                                                                 Socotra (Yem)
                                                                                                                                                                                                                                         Guinea-Bissau                                                                                                                     Djibouti
                                                                                                                                                                                                                                                                                             Benin
                                                                                                                                                                                     Trinidad & Tobago
                                                                                                                           Costa Rica                                                                                                               Guinea                                           Nigeria                                                   Ethiopia
Kingman Reef (US)                                                                                                                                                   Venezuela                                                                 Sierra Leone
                                                                                                                                     Panama                                              Guyana                                                                                                                         Central             South
          Palmyra Is (US)                                                                                                                                                                                                                                                  Côte                                                             Sudan
                                                                                                                                                                                            Suriname                                                                      d'Ivoire                                 African Republic
                                                                                                                             Cocos                                                                French                                                       Liberia                    Togo                                                                                        Somalia
                                                                                                                             (CR)                                                                 Guiana                                                                             Ghana          Cameroon
                                                                                                                                                        Colombia                                                                                                                       Bioko (Eq G)
                                                                                                                                                                                                                                                                                                                                                   Uganda
                                                                                                                                                                                                                                                                                     Equatorial Guinea                      Democratic
                                                                                                                                                                                                                                                                                        Sao Tomé                             Republic
 Jarvis Is (US)                                                                                               Galapagos Is                                                                                                         Sao Paulo (Br)                                       e Principé                           of Congo
                                                                                                                 (Ecu)                                                                                                                                                                                Gabon                                                 Kenya
                        Line                                                                                                          Ecuador                                                                                                                                                                                       Rwanda
                      Islands                                                                                                                                                                                                                                                     Annabón (Eq G)
                       (Kiri)                                                                                                                                                                                                                                                                                                       Burundi
                                                                                                                                                                                                                                                                                                               Congo

                                                                                                                                                                                                                                                                                            Cabinda (Angola)                                                                   Seychelles
                                                                                                                                                                                                                                                                                                                                                    Tanzania
                                                     Marquesas                                                                                                                                                                                                  Ascension (UK)                                                                                              Providence Is
                                                      Islands                                                                                                                                   Brazil                                                                                                                                                              Aldabra Is (Sey)      Agalega Is
                                                        (Fr)                                                                                                                                                                                                                                                                                                           (Sey)               (Maur)
                                                                                                                                                        Peru                                                                                                                                                                                                         Comoros Farquhar Is
                                                                                                                                                                                                                                                                                                                       Angola               Malawi                                   (Sey)
                                                                                                                                                                                                                                                                                                                                                                      Mayotte
                                                                                                                                                                                                                                                                                                                                    Zambia                             (Fr)

                                                                                                                                                                                                                                                                          St Helena (UK)
                                                                                                                                                                          Bolivia
                                                                                                                                                                                                                                                                                                                                                                                      Madagascar
                          Society                                                                                                                                                                                                                                                                                                                      Mozambique
        Cook              Islands                                                                                                                                                                                                                                                                                                      Zimbabwe
                                                                                                                                                                                                                                                                                                                                                                                           Mauritius
       Islands              (Fr)
        (NZ)
                                                                                                                                                                                                                                                                                                                   Namibia                                                               Reunion
                                                                                                                                                                                     Paraguay                                                                                                                                   Botswana                                                   (Fr)
                  Tubai Is (Fr)                    Gambier
                                                    Islands                                  Sala-y-Gómez(Chile)
                                                      (Fr) Pitcairn Is                                                               S Felix
                                                              (UK)                                                                   (Chile)
                                                                                                                                           S Ambrosio                                                                                                                                                                               Swaziland
                                                                                       Easter Is                                             (Chile)
                                                                                        (Chile)
                                    De Bass (Fr)                                                                                                                                                                                                                                                                                 Lesotho

                                                                                                                                                                                                                                                                                                                           South Africa
                                                                                                                                                         Chile

                                                                                                                              Juan Fernandez Is                          Argentina
                  MAP B                                                                                                             (Chile)                                                       Uruguay


                  Countries’ scores on the Child Development Index
                  2012, in four groups from ‘very high’ to ‘low’                                                                                                                                                                                                                                                                                                                         Krozet Is
                                                                                                                                                                                                                                                                                                                                            Prince Edward Is                               (Fr)
                                                                                                                                                                                                                                                                                                                                                 (S Afr)
                                                                                                   NOT INCLUDED
                                VERY HIGH                                MEDIUM
                                                                                                   IN THE INDEX                                                                        Falkland Is
                                                                                                                                                                                          (UK)                  South Georgia
                                                                                                                                                                                                                    (UK)
                                HIGH                                     LOW
                                                                                                                                                                                                                                        South Sandwich Is
                                                                                                                                                                                                                                              (UK)
Finland
                                                                       Norway
                     Iceland           Faeroe Is                                      Sweden
                                        (Den)                                                                                                            Russia
                                                                                                                Estonia
                                                          United                               Latvia
                                                         Kingdom                            Lithuania
                                                               Denmark
                               Rep of                      Netherlands
                                                                                     Poland       Belarus
                               Ireland                                Germany

  Kazakhstan                                               Belgium Lux.         Cze.
                                                                                      Slovakia Ukraine                                                                             Kazakhstan
                                                                        Lie.
                                                                 Swi.        AustriaHungary Moldova
                                                          France Mongolia Slov.             Romania                                                                                                                                                Mongolia
                                                                                   Cro.
                                                                                        Serbia
                                                              Monaco San Marino Bos.
                                                                                              Bulgaria
                                                       Andorra                      Mon. Kos.
                                                                                          FYR                                      Georgia                                Uzbekistan
The Azores (Port)Kyrgyzstan                                               Italy
                                                                                      Alb.Mac.                                  Democratic                                                        Kyrgyzstan                                                                                Democratic
 Uzbekistan                                         Spain                                                                       People’s Rep
                                                                                                                                   Armenia                                                                                                                                                  People’s Rep
                                                                                                         Turkey
                           Portugal                                                                                               of Korea            AzerbaijanTurkmenistan                                                                                                                  of Korea
                Tajikistan                                                                                                     Republic of                                                       Tajikistan                                                                                Republic of
                                                                                                                                  Korea               Japan                                                                                                                                   Korea             Japan
                                                                                            Greece
                                                                                   ChinaMalta                 Cyprus       Syria                                                                                                                               China
Afghanistan                                                                     Tunisia                          Lebanon                                      Iran             Afghanistan
       Madeira (Port)                        Morocco                                                               Israel                 Iraq
                                                                                                                          OPT.
                                                                                                                    OPT.
                                                                                                                            Jordan                                                                                              Midway Is                                                                                                                                         Midway Is
                                                                                                                                                                                                                                  (US)                                                                                                                                              (US)
    Pakistan Is (Sp)
      Canary                                       BhutanAlgeria                                                                             Kuwait                                  Pakistan                                   Bhutan
                               Nepal                                                   Libya                                                                                                                  Nepal
                                                                                                              Egypt                              Bahrain Qatar
                 Western                Bangladesh                                                                                                                    Oman                                            Bangladesh
                 Sahara                                                                                                                               UAE
                                                                                                                 Republic of China Saudi Arabia                                                                                                                                  Republic of China
                                                               Myanmar                                               (Taiwan)                                                                                                                Myanmar                                 (Taiwan)
                               India                                                                                                                                                                          India
                                                               (Burma)                                                                                                                                                                       (Burma)
                                                                                                                                                                                                      Wake Is                                                                                                                                               Wake Is
                                Mauretania                                   Lao                                                                                                                       (US)                                             Lao                                                                                                  (US)
                                                        Mali                 PDR            Chad                                                                                                                                                        PDR
                                                                            Niger
                                                                                                                                                                  Northern                                                                                                                                              Northern
                                                                                                                        Eritrea                                   Mariana Is                                                                                                                                            Mariana Is
Cape Verde                                                              Thailand                                                                                                                                                                    Thailand
                                                                                            Vietnam                                                                 (US)                                                                                               Vietnam                                            (US)
            Senegal                                                                                           Sudan                                   Yemen
                                                                            Kampuchea                                                                                                                                                                  Kampuchea
         The Gambia                                Burkina                                                             Philippines                                                                                                                                                    Philippines
                                                     Faso
                                                                                                                                              Djibouti             Socotra (Yem)
         Guinea-Bissau
     Laccadive Is                           Andaman Is     Benin                                                                                                                      Laccadive Is                    Andaman Is
        (Ind)                                  (Ind)                                                                                                                                     (Ind)          Marshall Islands (Ind)                                                                                                                                Marshall Islands
                  Guinea                                                Nigeria                                                   Ethiopia
                 Sierra Leone                 Nicobar Is                                                       South                                                                                                            Nicobar Is
                                             Côte(Ind)                            Central                                                                                                                                         (Ind)
                                                                             African Republic                  Sudan                                          Micronesia                                                                                                                                                Micronesia
                                           d'Ivoire
                                   Sri Lanka
                                 Liberia                  Togo                  Brunei                                                                   Somalia                                                 Sri Lanka                                              Brunei
                                                    Ghana           Cameroon
        The                                            Bioko (Eq G)      Malaysia                                                                                                        The                                                                   Malaysia
       Maldives                                                                                                       Uganda                                                            Maldives
                                                        Equatorial Guinea                       Democratic
                                                            Sao Tomé                             Republic                                                                                             Kiribati                                                                                                                                              Kiribati
    Sao Paulo (Br)                                         e Principé                            of Congo
                                                                              Gabon                                            Kenya
                                                                                                        Rwanda                                                                               Nauru                                                                                                                                                Nauru
                                                     Annabón (Eq G)
                                                                                                        Burundi                                            Papua                                                                                                                                                   Papua
                                                                                    Congo                                                                New Guinea                                                                                                                                              New Guinea
                                                                                        Indonesia                                                                                                                                                                  Indonesia
     Chagos                                                    Cabinda (Angola)                                                                    Seychelles                          Chagos
   Archipeligo                                                                                                         Tanzania                                                      Archipeligo
      (UK)                                                                                                                                                                              (UK)
                                 Ascension (UK)                                                                                                 Providence Is                           Solomon Is                                                                                                                                           Solomon Is
                                                                                                                                        Aldabra Is (Sey)                                                              Tuvalu                                                                                                                                           Tuvalu
                                                                                                                                           (Sey)
                                                                                                                                                                        Agalega Is
                                                                                                                                         Comoros Farquhar Is             (Maur)
                                                                              Christmas Angola
                                                                                        Is                                                               (Sey)                                                                                           Christmas Is
                                                                                 (Aus)                         Malawi                                                                                                                                       (Aus)
                                                                                                                                          Mayotte                                                                              Western Samoa                                                                                                                                     Western Samoa
                                                               Keeling Is                                                                                                                                                                Keeling Is
                                                                 (Aus)                                  Zambia                             (Fr)                                                                                            (Aus)

                                                    St Helena (UK)
                                                                                                                                                                                            Vanuatu                                                                                                                                              Vanuatu
                                                                                                                                                                                                                       Fiji                                                                                                                                             Fiji
                                                                                                                          Mozambique
                                                                                                           Zimbabwe                                      Madagascar
 Rodriguez Is                                                                                                                                                               Rodriguez Is
   (Maur)                                                                                                                                                                     (Maur)                                                       Tonga                                                                                                                                             Tonga
                                                                                                                                                                    Mauritius
                                                                                        Namibia                                                             Reunion                 New                                                                                                                                                        New
                                                                                                                                                              (Fr)                Caledonia                                                                                                                                                  Caledonia
                                                                                                  Botswana                             Australia                                     (Fr)                                                                                                           Australia                                   (Fr)


                                                                                                        Swaziland

                                                                                                    Lesotho
                                                                                                                                                                                                Christmas Is                       Kermadec Is                                                                                                     Christmas Is                     Kermadec Is
                                                                                               South Africa                                                                                        (Aus)                              (NZ)                                                                                                            (Aus)                            (NZ)


                           Amsterdam Is (Fr)                                                                                                                                                              Amsterdam Is (Fr)

                                St Paul (Fr)                                                                                                                                                    New Zealand Paul (Fr)
                                                                                                                                                                                                          St                                                                                                                                        New Zealand
                                                                                                                                                                                                                                Chatham Is                                                                                                                                        Chatham Is
                                                                                                                                                                                                                                  (NZ)                                                                                                                                              (NZ)

                                                                                                                                                            Krozet Is                                                          Bounty Is                                                                                                                                         Bounty Is
                                                                                                               Prince Edward Is                               (Fr)
                                                                                                                    (S Afr)                                                                                                      (NZ)                                                                                                                                              (NZ)
                Kerguelen Is                                                                                                                                                                  Kerguelen Is
                    (Fr)                                                                                                                                                                          (Fr)
                                                                                                                                                                                         Auckland Is       Antipodes Is                                                                                                                       Auckland Is         Antipodes Is
                                                                                                                                                                                            (NZ)              (NZ)                                                                                                                               (NZ)                (NZ)

                       Heard Is (Aus)                                                                                                                                   Macquarie Is                  Heard Is (Aus) Is
                                                                                                                                                                                                         Campbell
                                                                                                                                                                                                                                                                                                                              Macquarie Is
                                                                                                                                                                                                                                                                                                                                                                 Campbell Is
                                                                                                                                                                                                             (NZ)                                                                                                                                                  (NZ)
                                                                                                                                                                           (Aus)                                                                                                                                                 (Aus)
        South Sandwich Is
              (UK)


                                                                                                                                                                                                                                                                                           Cover photo: Three-year-old Asha in Sanjay
                                                                                                                                                                                                                                                                                           Colony, a slum area in Delhi where Save the
                                                                                                                                                                                                                                                                                           Children supports a mobile health clinic,
                                                                                                                                                                                                                                                                                           staffed by a doctor, nurses and a pharmacist.
                                                                                                                                                                                                                                                                                           (Photo: Rachel Palmer/Save the Children)
The Child Development


                                                                   Cover ph
index 2012


                                                                   oto : per-ander s pe tter sso n/ sa ve  t he  c hildren
Progress, challenges and inequality


The Child Development Index (CDI) offers a fascinating insight
into how children are faring around the world.
Key findings of this new edition of the CDI are:
•	 Overall improvement rates in child well-being almost doubled
   in the first decade of the 21st century.
•	 Developing countries experienced faster rates of progress
   than developed countries in the same period.
•	 Undernutrution remains one of the main factors holding back
   progress on children’s well-being as shown by the Index.
•	 The proportion of children suffering from wasting – or acute
   weight loss – actually rose in the second half of the 2000s.
The CDI monitors child well-being in 141 countries, aggregating
data on child mortality, primary-school enrolment and
underweight. Case studies on Tanzania – the highest climber
on the CDI – Indonesia and South Africa are also included.
This new edition highlights the impressive progress the world
has made. At the same time it warns of the impact of the failure
to tackle child undernutrition on children’s overall well-being.
Drawing on data on stunting and wasting, it looks at the
disastrous effects of the food and financial crises on children.
Finally, it makes a series of recommendations to developing-
country governments and to donors on tackling hunger
and undernutrition.                                                                                  cover photo: hildren


everyone.org

Child development index 2012

  • 1.
    The Child Development index2012 Progress, challenges and inequality
  • 2.
    The story THE CHILD in numbers 127 Greenland (Denmark) countries improved their scores Canada on the Child Development Index in the period of 2005­ 10 – United States 9,000 Bermuda (UK) fewer children under-five died Cuba Bahamas per day on average in the period Hawaiian Islands (USA) Revilla Gigedo Is Mexico Cayman Is Turks & Caicos Is (UK) Dominican Rep. (Mex) of 2005–10 than in 1995–99 Puerto Rico (US) Jamaica Haiti Anguilla (UK) Belize St Kitts Antigua & Barbuda Honduras & Nevis Guadeloupe (Fr) Dominica Guatemala Martinique (Fr) El Nicaragua Curaçao St Lucia Barbados Salvador 50 million Trinidad & Tobago Costa Rica Kingman Reef (US) Venezuela Panama Guyana Palmyra Is (US) Suriname Cocos French (CR) Guiana Colombia more children were in primary Jarvis Is (US) Line Galapagos Is (Ecu) Ecuador school in the period of 2005–10 Islands (Kiri) than in 1995–99 Marquesas Islands Brazil (Fr) Peru 36 million Cook Islands (NZ) Society Islands (Fr) Bolivia fewer children were underweight in Tubai Is (Fr) Gambier Islands Sala-y-Gómez(Chile) S Felix Paraguay (Fr) Pitcairn Is 2005–10 than 1995–99 (UK) (Chile) S Ambrosio Easter Is (Chile) (Chile) De Bass (Fr) Chile Juan Fernandez Is Argentina MAP A (Chile) Uruguay But… Countries’ progress in child well-being between 1995–99 and 2005–10 1.5 million VERY HIGH HIGH MEDIUM LOW NOT INCLUDED IN THE INDEX Falkland Is (UK) South Georgia (UK) more children suffered from acute malnutrition in 2005–10 than in the first half of the 2000s.
  • 3.
    DEVELOPMENT INDEX 2012 Finland Norway Iceland Faeroe Is Sweden (Den) Russia Estonia United Latvia Kingdom Lithuania Denmark Rep of Netherlands Poland Belarus Ireland Germany Belgium Lux. Cze. Slovakia Ukraine Kazakhstan Lie. Swi. AustriaHungary Moldova France Slov. Romania Mongolia Cro. Serbia Monaco San Marino Bos. Bulgaria Andorra Mon. Kos. FYR Georgia Uzbekistan The Azores (Port) Alb.Mac. Kyrgyzstan Democratic Italy Spain Turkey Armenia People’s Rep Portugal AzerbaijanTurkmenistan of Korea Tajikistan Republic of Korea Japan Greece Malta Cyprus Syria China Tunisia Lebanon Iran Afghanistan Madeira (Port) Morocco Israel Iraq OPT. OPT. Jordan Midway Is (US) Canary Is (Sp) Algeria Kuwait Pakistan Bhutan Libya Nepal Egypt Bahrain Qatar Western Oman Bangladesh Sahara UAE Saudi Arabia Republic of China Myanmar (Taiwan) India (Burma) Wake Is Mauretania Lao (US) Mali Chad PDR Niger Northern Eritrea Mariana Is Cape Verde Thailand Vietnam (US) Senegal Sudan Yemen Kampuchea The Gambia Burkina Philippines Faso Djibouti Socotra (Yem) Guinea-Bissau Benin Laccadive Is Andaman Is (Ind) (Ind) Marshall Islands Guinea Nigeria Ethiopia Sierra Leone South Nicobar Is Côte Central (Ind) African Republic Sudan Micronesia d'Ivoire Liberia Togo Somalia Sri Lanka Brunei Ghana Cameroon Bioko (Eq G) The Malaysia Uganda Maldives Equatorial Guinea Democratic Sao Tomé Republic Kiribati Sao Paulo (Br) e Principé of Congo Gabon Kenya Rwanda Nauru Annabón (Eq G) Burundi Papua Congo New Guinea Indonesia Cabinda (Angola) Seychelles Chagos Tanzania Archipeligo (UK) Ascension (UK) Providence Is Solomon Is Aldabra Is (Sey) Tuvalu (Sey) Agalega Is Comoros Farquhar Is (Maur) Angola (Sey) Christmas Is Malawi (Aus) Mayotte Western Samoa Keeling Is Zambia (Fr) (Aus) St Helena (UK) Vanuatu Fiji Mozambique Zimbabwe Madagascar Rodriguez Is (Maur) Tonga Mauritius Namibia Reunion New (Fr) Caledonia Botswana Australia (Fr) Swaziland Lesotho Christmas Is Kermadec Is South Africa (Aus) (NZ) Amsterdam Is (Fr) St Paul (Fr) New Zealand Chatham Is (NZ) Krozet Is Bounty Is Prince Edward Is (Fr) (S Afr) (NZ) Kerguelen Is (Fr) Auckland Is Antipodes Is (NZ) (NZ) Heard Is (Aus) Campbell Is Macquarie Is (NZ) (Aus) South Sandwich Is (UK)
  • 4.
    Save the Childrenworks in more than 120 countries. We save children’s lives. We fight for their rights. We help them fulfil their potential. Acknowledgements The Child Development Index 2012 was made possible by the extensive contributions of Terry McKinley and Giovanni Cozzi of the Centre for Development Policy and Research at the School of Oriental and African Studies, University of London. This paper was written by Alex Cobham, Nuria Molina and Maricar Garde at Save the Children UK, with support from Brendan Cox, Liam Crosby, Shani Winterstein, Simon Wright, Michel Anglade, John Lundine, Patricia Norimarna, Elizabeth Hughes, Melinda van Zyl, Karen Allan, Madhuri Dass and Dragana Strinic. Without implication, we are grateful for comments from Terry McKinley, Isabel Ortiz and Michael Klosson. The report, data and maps of The Child Development Index 2012 are available online at www.savethechildren.org.uk/onlinelibrary Published by Save the Children 1 St John’s Lane London EC1M 4AR UK +44 (0)20 7012 6400 savethechildren.org.uk First published 2012 © The Save the Children Fund 2012 The Save the Children Fund is a charity registered in England and Wales (213890) and Scotland (SC039570). Registered Company No. 178159 This publication is copyright, but may be reproduced by any method without fee or prior permission for teaching purposes, but not for resale. For copying in any other circumstances, prior written permission must be obtained from the publisher, and a fee may be payable. Typeset by Grasshopper Design Company Printed by Page Bros Ltd.
  • 5.
    contents Executive summary iv Box: Measuring children’s well-being vi 1 A decade of progress in child well-being 1 Developing countries accelerate progress 1 Inequalities between developed and developing countries remain 6 Box: The Child Development Index and the Human Development Index 8 2 Undernutrition: holding back progress 10 Under-five mortality 10 Primary school enrolment 12 Undernutrition 14 Box: The uncounted 15 3 Food and financial crises threaten increased undernutrition 16 Conclusions 19 Recommendations 20 Appendix 21 Endnotes 25
  • 6.
    Executive summary During the last decade, the world witnessed and primary school enrolment was even more unprecedented progress in child survival impressive, as the rate of improvement more than and children’s well-being. Millions of children doubled during the 2000s (from 11% to 23%; and were able to go to school for the first time, from 14% to 32% respectively). and many more were given a chance at life In addition to the accelerating progress it is clear as mortality rates in most countries that – since the 2000s – developing countries dropped dramatically. experienced higher rates of progress on average than developed countries. While the In the year 2000, world leaders met in New York at world’s poorest countries, mostly in sub-Saharan the Millennium Summit and laid the foundations for Africa and south Asia, tend to show the lowest child the international Millennium Development Goals well-being, the gaps at the top of the Index narrowed (MDGs). These included universal access to primary at the end of the 2000s. education and a dramatic reduction of child mortality rates, to be achieved by 2015. In turn, developed In Africa, Tanzania stands out, moving up 30 places in countries committed to increase much-needed their CDI ranking. The country’s success is based on development aid to enable poorer countries to two remarkable achievements: it more than halved achieve the MDGs. its child mortality, and almost halved the proportion of underweight children. Angola, Benin, Maldives, In 2008, in order to monitor progress in child Rwanda and Madagascar are the other African well-being, Save the Children launched the Child countries moving rapidly up in the ranking. Three Development Index (CDI), a global tool to assess central-American countries, El Salvador, Nicaragua the performance of 141 world countries on child and Guatemala, are also among the fast movers up mortality, nutrition and access to primary education. the ranking. The 2012 edition of the Child Development However, not all the news is good. When we break Index tells a story of success. This edition of the down the different components of the index – Index shows that substantial progress has been made health, education and nutrition – data shows that in addressing the most basic threats to child survival undernutrition has consistently lagged behind and well-being. On average, the lives of children and remains one of the major factors holding around the world in the indicators we measured back further progress on children’s well-being. improved by more than 30%. This means that the Whereas health and education have improved well chances of a child going to school were one-third above the average of the Index, when progress higher, and the chances of an infant dying before accelerated in the second half of the 2000s (at a their fifth birthday were one-third lower at the rate of 23% and 32% respectively), in comparison end of the 2000s than a decade before. During this child undernutrition performed very poorly, period child well-being improved in 90% of the improving at the much lower rate of 13%. In the countries surveyed.1 world’s poorest countries, progress was even Even more encouragingly, this historic progress weaker, at just below 10%. has been dramatically accelerating in recent years. Even more concerning is that the already slow From the first half of the 2000s to the second, progress in tackling undernutrition has been overall rates of progress in child well-being jeopardised by the effects of the global food and almost doubled compared to the end of the 1990s financial crises. This study finds that the proportion (an average improvement of 22%, up from 12%). of wasted children (suffering from acute weight Acceleration of progress in under-five mortality iv
  • 7.
    loss, which iscommonly used to indicate the severity We call on developing country governments to: Ex of food crises), actually rose in the second half • Build on the target recently approved by the World of the 2000s. Increases in wasting are worrying in Health Organization for a 40% reduction in the their own right, and also because they could be an number of children who are stunted by 2015, by ecutive early warning sign of further deteriorations setting up national policies and specific targets for in chronic undernutrition if the situation is not reducing child stunting. quickly reversed. • Strengthen social transfer programmes (such as cash transfers) as a key policy tool to combat hunger and undernutrition, both in times of summary RECOMMENDATIONS stability and as an effective crisis response tool that is easily scalable. The recent G8 agreement on the New Alliance • Ensure that national nutrition policies and social on Food Security and Nutrition; the World Health transfers are aimed at reducing inequalities and the Assembly support for a global target to reduce disproportionate impact of undernutrition among child stunting by 40% by 2025; and the commitment the poorest and most vulnerable groups in society. of the UK Prime Minister David Cameron to hold a hunger summit during the 2012 Olympic Games in We call on bilateral and multilateral donors to: London are all welcome steps in putting the critical • Maintain the recent focus on these issues. issues of hunger and undernutrition higher on the The hunger crisis can be dealt with international agenda. But this report highlights the but it will need a concerted effort, not scale of the challenge. a stand-alone moment. • Scale up multi-year funding for nutrition, The updated index shows the full impact of the drag putting in place outcome targets to reduce that a failure to tackle undernutrition is having on child undernutrition and to support child well being. It also shows the early signs of what the establishment of social transfer could be a new burgeoning crisis. In this context, programmes – above all for those countries business as usual will not suffice. that will find it most difficult to reduce stunting. Save the Children is calling on the international • Address the underlying drivers of high food community to seize the forthcoming opportunities prices which are at the root of ever more to redouble its efforts to create the biggest-ever frequent food crises, such as the ones that push against world hunger. It will need to target we are currently witnessing in the Sahel and the its efforts into support for direct interventions Horn of Africa. In particular, invest in smallholder (such as breastfeeding and food fortification), to agricultural development, prioritising support for battle ongoing crises and to tackle the global women smallholder producers and sustainable drivers of undernutrition – such as high food prices farming approaches. and inequality. • Commit to support the generation and use of better data, to improve transparency and accountability around these vital issues. This report has also highlighted the weaknesses in basic child well-being data; the same data is, of course, crucial to effective policy responses. v
  • 8.
    Box: measuring children’s well-being The Child Development Index (CDI) is based on more important to look at their score rather than an aggregate of three indicators that contribute their place in the ranking. Their movement across the to children’s wellbeing and development: health, rankings does not necessarily reflect the same degree education and nutrition. Countries are ranked of underlying change in child well-being. according to their scores in terms of a child’s Data are drawn largely from UN and World Bank chances of dying before her or his fifth birthday, of sources, supplemented by some national statistics. not enrolling in school and of being underweight. A lack of high-quality data makes it impossible to These three indicators are aggregated by simply calculate the index on an annual basis, so instead we calculating the average score between them for each work with periods of multiple years to ensure that period under review, meaning that they each have reliable trends for each indicator and each country equal weighting in the index scores. are identified. The Child Development Index 2012 Countries are then ranked according to their CDI therefore draws on data for the period 2005–10. scores. The lower the country’s score the better. Data limitations also restrict comparisons of country A zero score would mean that all children survive performance over time. We set aside from the main beyond their fifth birthday, all under-fives are well- analysis an early period (1990–94) for which data nourished, and all primary school-age children are are only available for 88 countries. We therefore enrolled in primary school. Conversely, a maximum present data for three periods (1995–99, 2000–04 score of 100 would represent a situation where all and 2005–10), which allows us to create the index children under five were underweight, all primary consistently for 141 countries in each. Increasing school children were out of school, and under-fives country coverage over time reflects improvements were dying at the highest rate on the scale – that in data collection. For further discussion of the is, 340 per 1,000 live births. For countries starting problems posed by data availability, see the Box on with already high CDI scores in the first period, it is ‘The uncounted’ on page 15. Figure 1. Indicators for child development Child development Health Education Nutrition Under-five mortality rate* Percentage of primary-age Percentage of under-fives children not in school who are underweight * The health indicator is expressed on a scale of 0 to 100 that corresponds to 0 to 340 deaths per 1,000 live births vi
  • 9.
    1 A DECADEOF PROGRESS IN CHILD WELL-BEING Save the Children’s 2012 Child Development Developing countries Index (CDI) presents a success story of accelerate progress progress in children’s well-being across all world regions, richer and poorer. Perhaps one of the greatest successes is that – since the 2000s – developing countries experienced faster Since the end of the 1990s child well-being improved than average rates of progress, increasing the chances in 90% of the countries assessed in the CDI.2 On of poor children in poor countries reaching their average, the lives of children around the world fifth birthday or being able to go to school (see improved by more than 30%. This means that the Figure 2). The overall picture is encouraging; not chances of a child going to school were one-third only has great progress been made, but it has been higher, and the chances of an infant dying before their especially powerful in those countries that had fifth birthday were one-third lower, at the end of the previously lagged behind. 2000s than ten years before. While the world’s poorest countries (low-income Developed and developing countries substantially countries) and the regions of sub-Saharan Africa and improved child well-being. However, whereas the south Asia had the weakest performance, the gaps rate of progress was faster in developed countries in child well-being narrowed in the 2000s as these at the turn of the century (16%, compared to 12% in countries enjoyed significantly higher rates of progress. developing countries), during the decade of the 2000s developing countries accelerated progress (up to In Africa, one of the world regions with the weakest 22%) and overtook rich countries (where the rate of performance in child well-being, progress in individual improvement was only 9%). This has helped to bridge countries presents a fragmented picture. While five part of the gap between developed and developing of the top 11 countries where improvements have countries; however, inequalities remain, with children been greatest are in Africa, six of the bottom ten born in rich countries eight times better off than countries are also in Africa (see Table 3 on page 7). those in developing countries. Tanzania stands out; it moved up 30 places from This is important news as poorer countries, starting the second half of the 1990s to the second half of from a much lower base, were able to decrease the the 2000s. The country’s success is based on two gap in children’s well-being that separates them from remarkable achievements: Tanzania more than halved richer countries – hence, decreasing world disparities. its child mortality rate (from 159 per 1,000 births Unfortunately, the gap is still far from being closed. in 1995, to 76 per 1,000 births in 2010), and almost World inequalities in child well-being remain a halved the proportion of moderately or severely challenge in giving every child a fair chance at life. underweight children (falling from 30.6% in 1996 to 15.8% in 2010). Moreover, as we show in the sections below, these aggregate figures mask important disparities among countries and regions, as well as uneven progress in different dimensions of child well-being measured by the Index – namely, access to primary education, child mortality and undernutrition. 1
  • 10.
    the child developmentindex 2012 Figure 2: CDI Performance over Time By region 1995–99 2000–04 2005–10 0 5 10 15 20 CDI score 25 30 East Asia CEE and CIS 35 Latin America and the Caribbean Middle East and 40 north Africa South Asia 45 Sub-Saharan Africa By income level 1995–99 2000–04 2005–10 0 5 10 15 CDI score 20 25 30 Low income 35 Low-middle income Upper-middle income 40 High income 2
  • 11.
    1  A DECADEOF PROGRESS IN CHILD WELL-BEING Indonesia – a work in progress Indonesia climbed six places up the CDI ranking population and one-third of the rural population between1995–99 and 2005–10, giving it a lead have access to adequate sanitation,8 and more over other big middle-income countries such as than 50,000 Indonesian children per year die from India and South Africa. Under-five mortality fell diarrhoea.9 Indonesia also has one of the highest dramatically from 91 per thousand live births maternal mortality rates in south-east Asia (228 per in 1990 to 35 per thousand births in 2010. Net 100,000 live births),10 and nearly half of all under primary school enrolment went up from 89% to five deaths occur during the first 28 days of life.11 96%, and the proportion of under-fives who are Less than half of young learners in Indonesia attend underweight went down from 38% in 1990 to preschool and only about two-thirds of students 20% in 2007. enrol in secondary school.12 Finally, Indonesia has the highest number of children in institutions in the Much of this is down to improved access to health, world – an estimated 500,000.13 education and other services. For example, 89% of children received measles immunisation in 2010 As in many other countries, recent years have compared to 60% two decades ago.3 Trained health seen growing income inequality,14 creating big professionals are bringing services to more people disparities in children’s well-being. The poorest and over 80% of the population now has access to children are more than twice as likely to die before improved drinking water, up from around 60% in the their fifth birthday as those born into the richest 1990s.4 Spending on education, a key element in the households,15 and with more than a third of under- government’s development plan, doubled between fives stunted,16 children in the poorest households 2000 and 2006.5 Efforts are now aimed at improving are also the most vulnerable to this condition.17 the quality of health and education services. The government committed to reduce stunting However, children’s well-being is still a work in prevalence among under-fives to 32% in 2014 in its progress. More than one-third of Indonesian National Mid-term Development Plan. It must also children are stunted,6 and breastfeeding rates have ensure that the country’s economic growth brings steadily declined over the past two decades, with further improvements in health, protection and just 32% of mothers exclusively breastfeeding for education for all children, including the poorest. the first six months.7 Only about half of the total Tanzania – the highest climber Tanzania has made impressive progress in its CDI • Budgetary allocations to the health sector score over the past decade, from 42.6 in 1995–99 have been growing at an average rate of 21.8% to 16.7 in 2005–10, moving up 30 places in the between 2005/06 and 2010/11, increasing from country rankings. Progress has been particularly TZS 446 billion (US$279 million) in 2005/06 fast between 2006 and 2010, when the under-five to TZS 1193 bn (US$745 m) in 2010/11.19 mortality rate dropped by 28%, from 112 per 1,000 The government has also made several strong live births to 81.18 The number of out-of-school commitments as part of the UN Secretary children fell from 3.2 million in 1999 to 33,000 in General’s Every Woman, Every Child initiative. 2008. The proportion of underweight children, as is These include a commitment to increase health true for the index in general, fell less dramatically – sector spending from 12% to 15% of the national from 16.4% in 2004–05 to 15.8% in 2010. budget by 201520 and double the number of trained health workers.21 Different factors have contributed to Tanzania’s • On the education front, the Complementary impressive improvements in children’s health Basic Education in Tanzania project provides and education. For instance: continued overleaf 3
  • 12.
    the child developmentindex 2012 Tanzania – the highest climber continued alternative education to 8–13-year-olds and Budgeting Guidelines 2012/13 include nutrition helps them re-enter formal education. Also, the interventions. The civil society Partnership for Grade 4 exam, which often acted as a barrier to Nutrition in Tanzania (PANITA)24 is successfully educational progress, has been removed.22 influencing policy – for example: • the establishment of a budget line specifically With 42% of under-fives stunted, Tanzania is one for nutrition in 2012/1325 of the ten countries worst affected by chronic • the implementation of the National Nutrition undernutrition. To tackle this, the government has Strategy recently introduced a number of measures and is • ensuring that nutrition interventions reach taking an active role in the Scaling up Nutrition local communities. (SUN) movement.23 It has established a Multi- Institutional/Multi-Sectoral High Level Nutrition Provided that funding is maintained, many of these Steering Committee composed of public, private, policies and processes will continue to improve civil society and development partners and children’s wellbeing. But greater transparency and chaired by the Permanent Secretary in the Prime sustained consultation and policy dialogue between Minister’s office. A National Nutrition Strategy the government, civil society and development has been launched, and the National Planning and partners is essential.26 South Africa – a mixed picture South Africa’s CDI scores indicate that children’s poverty. Estimates indicate that about two-thirds of wellbeing fell between 1995–99 and 2000–04, but children lived in households with per capita incomes slightly improved between 2000–04 and 2005–10. below the poverty line (set at R552 per month in Its ranking fell 24 places between the first and 2009).30 Access to health facilities and education the last period, which is mainly a consequence of vary greatly across provinces, with some children other countries overtaking it in terms of advancing in remote areas unable to go to school due to children’s well-being. inadequate or unaffordable transport.31 The HIV and AIDS epidemic is badly affecting the lives of children To understand the country’s performance, it is who are already vulnerable. In 2009, it was estimated important to look at what has happened to the three that 330,000 children were living with HIV and indicators in the index. Under-five mortality saw a nearly 2 million were orphaned due to AIDS.32 slight decline from 60 per thousand live births in 1990 to 57 per thousand births in 2010, but some The government is implementing a large-scale social years in between actually saw increases in the rate security programme that includes a Child Support of children dying. South Africa is one of the few Grant to help improve the conditions of children countries that hasn’t registered progress in both child who live in poverty. The grant, which is about R280 and maternal mortality.28 Primary school enrolment (US$33) per month, reaches 11 million children.33 was at 90% in 1990 and remains the same in 2010, A study evaluating its impact has shown that but again this has seen dips in the years in between.29 those who get the grant do better across several The proportion of underweight children below five measures of children’s wellbeing. For example, years has remained at 9% over the decades. they complete more grades in school and girls achieve higher maths scores.34 Children receiving There are multiple causes of children’s deprivation the grant are also less likely to be ill or stunted.35 but poverty, income inequality – which affects poor The programme is a step in the right direction. people’s access to good quality services – and Economic growth may not automatically lead to the AIDS epidemic are some of the key reasons better outcomes, but investing in children and behind the poor quality of children’s health and implementing policies that address their needs help education in South Africa. Economic growth brought to improve children’s lives. This and other efforts great benefits to certain sectors of society, but it are crucial to reversing deprivation and improving has increased inequality, and many children live in children’s well-being in South Africa. 4
  • 13.
    At the otherend, Equatorial Guinea fell as many places Bank and Gaza) all feature among the biggest fallers in 1  A DECADE OF PROGRESS IN CHILD WELL-BEING as Tanzania rose, while the West Bank and Gaza fell even the ranking. further – nearly 50 places, with children’s net school Of those making the most progress in percentage enrolment rates in particular showing a sharp decline terms, the top six countries are the same as those (from 97% in 1999 to less than 80% since 2005).27 moving up fastest in the ranking, except that Croatia The pattern looks broadly similar if we consider replaces Angola. Angola’s strong improvements over changes in percentage scores, rather than ranking. the period saw it move from the 140th in 1995–99 One important difference is Somalia. Although only – almost at the bottom of the table – where smaller falling seven places from the second half of the 1990s percentage improvements can result in a greater to the second half of the 2000s, Somalia was one of improvement in ranking. Croatia, by dint of starting only six countries to actually see a fall in index score higher up the index in the second half of the 1990s, over the period. The others (Central African Republic, saw a higher percentage improvement in score South Africa, Equatorial Guinea, Paraguay and West translate into a smaller shift in ranking. Table 1: Top ten and bottom ten developing countries by CDI progress, 1995–99 to 2005–10 Top ten Rank by progress Country Change in index rank 1995–1999 2005–2010 1 Tanzania 30 42.6 16.7 2 Turkey 25 15.2 5.7 3 Angola 21 59.6 28.2 4 El Salvador 20 14.7 5.9 5 Nicaragua 20 17.1 7.4 6 Maldives 20 23.5 9.2 7 Benin 20 43.2 22.8 8 Georgia 18 12.6 5.3 9 Rwanda 18 39.3 19.9 10= Guatemala 17 21.1 9.4 10= Madagascar 17 41.0 22.2 Bottom ten Rank by progress Country Change in index rank 1995–1999 2005–2010 109 Albania -16 10.8 10.2 110 Côte d’Ivoire -16 37.1 34.4 111 Jamaica -17 9.1 8.5 112 Togo -17 26.8 23.3 113 Lesotho -18 28.4 25.0 114 Central African Republic -18 40.4 41.5 115 South Africa -24 11.5 12.2 116 Paraguay -25 6.2 7.5 117 Equatorial Guinea -32 28.3 32.9 118 West Bank and Gaza -49 5.8 10.6 5
  • 14.
    Inequalities between Map B at the back of this report (pages 26–27) the child development index 2012 developed and developing shows country index scores according to whether they achieve low, medium, high or very high child countries remain well-being. Table 2 (below) gives average scores by Despite striking progress both globally and in region of the world and by income level, with lower developing countries, the world still remains a very scores indicating stronger child development. The unequal place. Being born in a developed or in a average score for high-income countries is less than 2, developing country still makes a big difference in compared to nearly 17 for developing countries as determining children’s chances at life. Whereas a group. developed countries are very close to the highest As in the first edition of the index, Japan is the score of the ranking, the average child in developing best performer, with an improved score of 0.35, countries is almost eight times worse off than he which represents the highest achieved level of child or she would be if they had been born in a rich well-being. country. The lowest child well-being is found in the regions of sub-Saharan Africa and south Asia, and – At the bottom of the scale, Niger was previously well unsurprisingly – among the lowest income countries. adrift of all other countries. We see now, however, Table 2: The Child Development Index, by region and income level Sample size Child Development Index 2005–10 Developed countries 24 1.69 Developing countries 117 16.86 By region: East Asia 11 6.62 CEE and CIS 15 5.84 Latin America and the Caribbean 25 5.62 Middle East and north Africa 14 10.11 Sub-Saharan Africa 45 30.38 South Asia 7 24.11 By income level: Low income 50 26.31 Lower-middle income 49 6.14 Upper-middle income 18 5.01 High income 24 1.69 World 141 15.54 6
  • 15.
    that Niger hasexperienced a substantial improvement Indeed, it masks a huge variety, since the strongest 1  A DECADE OF PROGRESS IN CHILD WELL-BEING in its index score (from 70 in the second half of the improvements are also seen in Africa. 1990s and 62 in the first half of the 2000s, to 49 in Map A, at the very start of this report, shows the the second half of the 2000s) and caught up with the world map, with countries coloured according to the trailing pack. However, it is against this background of extent of their progress on the CDI from 1995–99 relative progress that the country is once again facing to 2005–10. It is noticeable that a range of colours a desperate food crisis.36 Niger is replaced, predictably, appears in each region. Africa in particular includes by a country that has been sliding backwards on countries with low, medium, high and very high rates multiple indicators: Somalia, with a score of 55 of progress. (worsening from 50 in 1995–99 as civil conflict has taken its toll). Map B, at the very end of this report, has countries shaded to reflect their CDI scores, from the lowest- As shown in table 3 below, all ten of the bottom scoring quarter of countries to the highest. The countries in the Child Development Index for pattern of progress by region is clearly seen. the most recent period assessed (2005–10)37 are African. However, this does not necessarily provide a fair picture of progress across the continent. Table 3: Top ten and bottom ten countries by CDI 2012 rank Top ten Bottom ten Rank Country Index Rank Country Index 1 Japan 0.35 132 Eritrea 39.39 2 Spain 0.55 133 Mali 39.53 3 Germany 0.64 134 Sierra Leone 39.71 4 Italy 0.70 135 Djibouti 40.03 5 France 0.74 136 Central African Republic 41.47 6 Canada 0.74 137 Congo, Dem. Rep. 43.01 7 Switzerland 0.82 138 Burkina Faso 43.93 8 Norway 0.89 139 Chad 44.11 9 United Kingdom 0.92 140 Niger 48.73 10 Netherlands 0.93 141 Somalia 54.50 7
  • 16.
    Box: The childdevelopment index and the human development index The Child Development Index follows in the countries may be storing up trouble for the future. footsteps of the UNDP’s Human Development It is additionally a concern that a number of the Index (HDI), pioneered by the economist Mahbub countries in this category (from UAE to Equatorial ul Haq. This index established the importance of Guinea) are highly dependent on natural resource measuring human well-being beyond simple national extraction, which offers only finite development income measures. The two indices each have three possibilities. components with broadly common aims: The countries below the diagonal, in contrast, score more highly on the CDI than the HDI and can be Element of HDI CDI thought of as investing relatively strongly in their well-being component component children. Sub-Saharan Africa is particularly strongly Health Life expectancy Under-five represented at the bottom of the figure, with low rate mortality HDI countries in the medium CDI quartile – including, Education An education Net enrolment for example, the noted strong performer Tanzania. index (changed rate This should be seen as encouraging news. in 2011 from combining However, some caution is required in interpreting literacy and these results. Since the CDI refers to a longer period, gross enrolment, while the HDI data relate to the most recent year, to years of schooling) a country which has gone backwards in the CDI ranking – such as Zimbabwe – can still appear to Basic needs Average per Nutrition outperform on the CDI. Differences will therefore not capita national (under-weight always reflect the relative intensity of child-centred income, as a prevalence among proxy for the under-fives), as development efforts. ability to meet perhaps the most basic needs basic need Finally, it is worth drawing attention to the BRICS nations, often highlighted as emerging global powers. Three – Brazil, South Africa and Russia – are on the It is interesting to see where there are major diagonal (that is, they occupy the same quartiles of differences in countries’ performance between the the CDI and the HDI). China and India both qualify two indices. Following the HDI, we can divide each as of medium development on the HDI; but while index into four quartiles, indicating low development, China is in the highest quartile of the CDI, India is in medium, high and very high development. Figure 3 the lowest. shows, as would be expected, that the majority of countries that feature in both indices fall into the In fact, China is the only country which scores not same quartile in both: this is the grey shaded diagonal one, but two quartiles higher in the CDI than the running from the top right (very high development on HDI. The implication is that, in relative terms, China both indices) to the bottom left (low development is heavily prioritising investment in children. Both on both indices). score highly on net enrolment rates, but more than 40% of India’s children are moderately or severely The countries off the diagonal are perhaps of greater underweight, compared to less than 5% of China’s; interest. Those above the diagonal, shaded in yellow, and India’s under-five mortality rate exceeds 60 out demonstrate better performance on the HDI than of 1,000, while China’s is below 20. on the CDI. The risk here is that by failing to invest in child well-being to a commensurate level, these 8
  • 17.
    Box: T he Figure3: CDI and HDI compared CDI Low Medium High Very high HDI Qatar Argentina Iceland Very high UAE Australia Ireland child Austria Italy Bahrain Japan dev Belgium Luxembourg Canada Netherlands Chile Norway Croatia Spain Czech Sweden Republic Switzerland elopment Denmark United Finland Kingdom France United States Germany inde x Albania Armenia Russian Belarus High and Azerbaijan Brazil Federation Belize Oman Colombia Saudi Arabia Costa Rica Ecuador Trinidad Cuba the Georgia and Tobago Macedonia Iran Turkey Mexico Jamaica Venezuela Romania Kazakhstan Tunisia human Kuwait Uruguay Lebanon dev Malaysia Mauritius Panama Peru elopment Congo Bhutan South Africa Algeria China Medium Equatorial Guinea Botswana Sri Lanka Bolivia Ghana Cambodia Swaziland Egypt India Dominican Tajikistan El Salvador inde x Lao PDR Republic Vietnam Honduras Gabon West Bank Jordan Guatemala and Gaza Kyrgyzstan Guyana Moldova Indonesia Mongolia Iraq Nicaragua Maldives Paraguay Morocco Suriname Namibia Syria Philippines Thailand Angola Lesotho Benin Low Bangladesh Liberia Cameroon Burkina Faso Mali Comoros Burundi Mauritania Kenya Central Mozambique Madagascar African Nepal Malawi Republic Niger Myanmar Chad Nigeria Rwanda Côte d’Ivoire Pakistan Sao Tome and Principe Djibouti Senegal Tanzania DR Congo Sierra Leone Uganda Eritrea Sudan Zambia Ethiopia Timor-Leste Zimbabwe Gambia Togo Guinea Yemen Guinea-Bissau Haiti 9
  • 18.
    2 Undernutrition: holding back progress To understand better the nature of progress Under-five mortality in the CDI, we break down the analysis to look at each of the key components: under- Between the second half of the 1990s and the second half of the 2000s, developing countries five mortality rates, net non-enrolment reduced under-five mortality rates by more than in primary education, and the prevalence 30% (see Table 3 below). of underweight children. A clear picture emerges: strong progress on the first two As with the overall index, we see a significant is set against relatively poor performance acceleration in progress in the 2000s, when the rate on the latter, as undernutrition continues to of improvement went up to 23% from only 11% at retard advances in children’s well-being. the end of the 1990s. During the 2000s, the number of children dying each year went down from around 10 million to 7.6 million.38 However, the world’s poorest countries, most of which are in sub-Saharan Africa and south Asia, lag behind, with improvement rates well below the world average. Table 3: Under-5 Mortality Rate Component: CDI progress, 1995–99 to 2005–10 Value Value Value Improvement Improvement Total 1995–99 2000–04 2005–10 1995–99 to 2000–04 to improvement 2000–04 2005–10 Developed 2.2 1.9 1.7 13.6 7.8 20.3 countries Developing 26.6 23.7 18.9 10.9 23.3 31.6 countries By region: East Asia 14.7 11.9 7.9 19.0 34.0 46.5 CEE and CIS 13.9 10.9 6.6 22.0 39.5 52.8 Latin America and 12.8 9.9 7.1 22.9 28.6 45.0 the Caribbean Middle East and 17.5 14.4 10.3 17.6 28.3 40.9 north Africa Sub-Saharan Africa 49.0 47.9 39.1 2.3 18.3 20.2 South Asia 30.9 26.8 20.7 13.3 22.7 33.0 By income level: Low income 37.9 34.8 27.5 8.2 20.8 27.3 Low-middle 14.1 11.3 7.6 19.9 32.4 45.9 income Upper-middle 9.8 8.4 5.8 13.5 31.4 40.6 income High income 2.2 1.9 1.7 13.6 7.8 20.3 World 24.5 21.8 16.7 10.9 23.2 31.5 10
  • 19.
    2  U Survival – an equal right The number of children dying before their fifth five mortality. Pneumonia, premature births, birthday has gone down from around 12 million in diarrhoea and malaria are the most common 1990 to 7.6 million in 2010, despite an increasing causes of under-five deaths. Increasing coverage of birth rate.39 This is remarkable progress. But the successful interventions – vaccines, treatment of global figure masks growing inequality within and childhood illnesses, insecticide-treated bed nets – between countries. Also worrying is the increased has protected many children. But access to these ndernutrition : proportion of deaths that occur in the first month remains grossly inequitable. of life (now 40% of under-five deaths),40 and the fact One reason why the deaths of newborn babies that undernutrition (which shows least progress have not gone down as much as under-five deaths is on the Child Development Index) is the underlying holding that many mothers have no access to good-quality cause of one-third of child deaths.41 health services. Forced to give birth without a Five large countries – India, Nigeria, the Democratic skilled attendant, many mothers die along with back Republic of Congo, Pakistan and China – account their babies. for about half the global under-five mortality Efforts must be focused on reducing children’s figure.42 While under-five mortality is increasingly unequal chances of surviving. In some countries, the concentrated in sub-Saharan Africa and south Asia, poorest children are two to three times more likely progress 23 of the 75 Countdown to 2015 countries (those to die before their fifth birthday than those born in that account for over 95% of child deaths) are the richest households.45 Mortality should be tracked on track to meet MDG 4 (a two-thirds reduction across wealth groups and other socioeconomic in child mortality) by 2015.43 On the whole, the characteristics. Countries must ensure that in poorest countries are doing least well but some achieving MDG 4 (a two-thirds reduction in child low-income countries – like Bangladesh, Cambodia, mortality between 1990 and 2015) they do not leave Laos and Nepal – are on track. And the rate of the poorest children behind. decline of under-five mortality in a number of African countries – including Senegal, Rwanda, Equal attention must be paid to girls’ education Kenya and Uganda – has accelerated significantly and rights, which is a major factor in improving in recent years.44 child survival rates. Governments and donors need to invest more to combat undernutrition among Many countries, however, are showing little or mothers and children to address a major underlying no progress. Renewed efforts are needed to cause of child mortality. address the direct and structural causes of under- C olin C rowley /Save the C hildren Rukia with her son Husseinat, who was delivered two months premature by caesarean section and is being cared for at the district hospital in Mtwara, Tanzania. 11
  • 20.
    Primary school enrolment The acceleration that developing countries the child development index 2012 experienced in overall child well-being at the beginning The figures for increased numbers of children of the 2000s is, if anything, more pronounced when it enrolled in primary school are even more positive, comes to primary school enrolment. While at the end with an average increase of 40% in developing of the 1990s the improvement rate was only 14%, in countries from the second half of the 1990s to the the 2000s this rate climbed up to 32%. It is striking that second half of the 2000s. South Asia leads the way improvement rates in the world’s poorest countries among regions, with nearly a 50% increase, while have been, in this case, higher than the world average sub-Saharan Africa has achieved similar rates to – with south Asia standing out with 40% improvement others regions. rates in the 2000s. Table 4: Net Non-Enrolment in Primary Education: CDI progress, 1995–99 to 2005–10 Value Value Value Improvement Improvement Total 1995–99 2000–04 2005–10 1995–99 to 2000–04 to improvement 2000–04 2005–10 Developed 4.1 3.3 3.2 17.9 2.8 20.2 countries Developing 18.8 16.2 10.9 13.9 32.8 42.1 countries By region: East Asia 4.1 3.4 2.2 15.9 34.7 45.1 CEE and CIS 13.4 10.5 7.1 21.5 32.6 47.1 Latin America and 8.3 7.1 5.4 14.6 24.1 35.2 the Caribbean Middle East and 15.9 12.2 9.4 23.3 22.8 40.8 north Africa Sub-Saharan Africa 44.1 39.1 27.6 11.3 29.5 37.5 South Asia 20.4 17.4 10.4 14.8 40.2 49.0 By income level: Low income 29.4 25.6 17.1 12.9 33.5 42.1 Low-middle 6.7 5.5 3.8 18.5 31.1 43.8 income Upper-middle 5.9 4.7 4.4 20.2 6.4 25.3 income High income 4.1 3.3 3.2 17.9 3.1 20.4 World 17.5 15.1 10.2 13.9 32.2 41.6 12
  • 21.
    2  U Education – access at the expense of quality “We cannot talk about building strong economies, Institution,48 “approximately 200 million children sustainable democracies, and equitable societies without who are in primary school are learning so little having educated children. We need boys and especially that they are struggling to read basic words.” girls who can read, write, calculate and think critically Enrolling children in school is not enough. to lead us to a more peaceful and secure world. This Their right to education includes the right to call for a renewed global commitment on learning will ndernutrition : learn. Recent research shows the importance of help catalyse important actors from around the world to education to other development goals. For example, invest time, energy, and resources in improving learning a child born to a mother who can read is 50% more for all.” likely to survive past the age of five.49 Evidence Ellen Johnson Sirleaf, President of Liberia speaking holding about the 2011 Global Compact on Learning46 also shows that learning levels matter more than the number of years spent in school in terms of The reason the education component of the individual earnings, health, and a country’s economic back Child Development Index is based on how many growth.50 UNESCO estimates that approximately primary-age children are enrolled in school is, in 171 million people could be lifted out of poverty part, because of the availability of relatively strong if all students in low-income countries learn basic national data. However, data over the past decade reading skills in school.51 progress suggests that the MDG focus on increasing the numbers of children enrolled in school has been Governments, donors, civil society and academic at the expense of learning.47 Students in many institutions are supporting a sharper focus on countries are not gaining even basic literacy and learning targets to guide progress in the education numeracy skills. sector. The post-2015 framework provides a key platform to ensure this change, but data is needed Impressive school enrolment rates don’t reflect now. This is a clear opportunity for international the number of children who actually complete a policy-makers, including President Johnson Sirleaf school year, much less master basic skills. With as one of the co-chairs of the high-level panel overcrowded classrooms and a lack of trained on post-2015 (see page 15), to ensure that teachers, children are spending years in school consistent data are generated for more powerful without gaining even basic reading, writing, education indicators. maths or life skills. According to the Brookings P aul Z hang/Save the C hildren An early childhood centre run by Save the Children in a Beijing suburb. 13
  • 22.
    Undernutrition The picture of under-performance is highly the child development index 2012 concentrated in the world’s poorest countries and By comparison, the nutrition picture is alarming. in sub-Saharan Africa and south Asia. While middle While progress in under-five mortality and primary income countries saw improvement rates between school enrolment accelerated during the 2000s, and 25 and 30% during the 2000s, sub-Saharan Africa saw improvement rates almost doubled (going up to only 14% improvement and south Asia just 8%. 23% and 32% respectively), there was no significant acceleration in progress in nutrition. Improvement rates in underweight prevalence were much weaker at 13%. Table 5: Prevalence of Underweight Children: CDI progress, 1995–99 to 2005–10 Value Value Value Improvement Improvement Total 1995–99 2000–04 2005–10 1995–99 to 2000–04 to improvement 2000–04 2005–10 Developed 0.4 0.4 0.1 1.4 66.3 66.8 countries Developing 28.0 24.7 21.5 11.6 13.0 23.1 countries By region: East Asia 18.5 13.4 9.8 27.5 27.1 47.1 CEE and CIS 6.4 4.3 3.9 32.2 10.1 39.0 Latin America and 8.2 6.2 4.4 24.6 27.9 45.6 the Caribbean Middle East and 16.0 13.6 10.6 14.9 22.4 34.0 north Africa Sub-Saharan Africa 31.7 28.3 24.4 11.0 13.6 23.0 South Asia 46.7 44.5 41.2 4.6 7.5 11.8 By income level: Low income 41.1 38.0 34.3 7.6 9.7 16.5 Low-middle 13.4 9.8 7.0 26.6 28.6 47.5 income Upper-middle 8.6 6.5 4.8 23.9 26.0 43.6 income High income 0.4 0.4 0.1 1.4 66.3 66.8 World 25.6 22.6 19.7 11.6 13.1 23.2 J ane H ahn /P anos Henry, 10, with his nine-month-old nephew Jeremiah, outside his home in Sugar Hill, Liberia. 14
  • 23.
    Box: The Uncounted Compilingthe Child Development Index reveals just such as food price spikes, or to hold governments and how weak are the data that tell us how countries are donors to account for commitments made, the data performing in terms of even the most basic indicators are all too often simply not available. of child well-being. How can governments and donors During 2012, Indonesia and the UK are together claim to be targeting progress when they don’t even know co-chairs of both the Open Government Partnership where they’re starting from? Indeed, how can the well- and, with Liberia, of the high-level UN panel on the being of children be improved, if those children are – post-2015 successor to the Millennium Development literally – not counted? Goals (MDGs). The Open Government Partnership is There has been an impressive improvement in the committed to generating data on human development coverage of child mortality data. Here the data shift and on policies and their impact, and making data from a relatively consistent pattern of coverage every available to citizens in the interests of transparency five years, to annual coverage from 2005 onwards. and accountability. Net primary enrolment data has never had the same The post-2015 panel is intended to move forward consistency of coverage, but exists for more than the discussions about the global framework for one hundred countries each year for most years development. Since one major criticism of the MDGs since 2000. Underweight nutrition data, on the other has been that they lack accountability for various hand, is entirely reliant on household surveys and reasons, including often the absence of consistent, there may only be a small number of these conducted high-quality data, there is a real opportunity for around the world in a given year. To track progress, leadership here. to understand and respond to problems or threats P rashanth Vishwanathan /Save the C Children outside their makeshift home by a metro hildren station in New Delhi. 15
  • 24.
    3 Food andfinancial crises threaten increased undernutrition A further – and even more worrying – food prices. Wasting is showing negative trends across concern is that data on wasting and stunting various income groupings and regions for the late 2000s. (very sparse for the second half of the 1990s Across different world regions (see Figure 4 below), and the first half of the 2000s and, therefore, the proportion of children who were wasted not included in the CDI) suggest that the rose by almost 17% in East Asia and by over current ‘triple f’ – financial, fuel and food- 4% in the Middle East and North Africa, and price crisis – is having a significant impact on in lower-middle income countries as a group. children’s nutrition. This indicates that many hundreds of thousands of additional children suffered acute under-nutrition. Stunting, when children are too short for their age, is the result of chronic undernutrition and, hence, This proportion of wasted children even rose in reflects structural trends in the nutritional status of developed countries – though from a very small base. children in a certain country. Wasting – acute weight This may seem surprising, given the expectation that loss – is the result of grave deprivation of nutritious even low-income households in rich countries will food and/or disease at a specific point in time. It is a spend relatively small shares of their income on food. rapidly changing indicator and it is commonly used to But it underlines the extent of income instability indicate the severity of famine and food crises.52 associated with the crisis, including through both employment and out of work benefits. We examined changes in wasting to see whether more children are suffering from acute weight loss These findings are worrying in their own right, as a possible result of the global food crisis. We have and also because they could be interpreted as been able to gather representative data for wasting an early warning for future increases in chronic for the first and second half of the decade of the undernutrition – which will only become clear as 2000s only. This allows us to examine the change from more data become available. pre-crisis to crisis period, but prevents a comparison The significant impacts of food crisis and children with an earlier change (eg, from the second half of the suffering from wasting are not evenly distributed. 1990s to the first half of the 2000s). Save the Children research found that the poorest Between the first and second half of the 2000s, there suffer the most. On the basis of household surveys was a reduction of 13% in the proportion of under- we carried out before and after the 2007–08 food- five children who were underweight in developing price spikes, we found that while the wealthiest countries – significantly weaker than the other households had benefited from the increased price of components of the CDI. The performance on stunting staple foods, the poorest had suffered, as evidenced by was weaker still, showing only a 10% fall over the analysis of the impact of the escalation of food prices same period – unsurprising, since it is a longer-term on household income and children’s nutrition in a condition and so, harder to address. rural community in northern Bangladesh.53 When we look at wasting, the picture is even bleaker, Using data from the Domestic Household Surveys as the proportion of wasted children did not decline for 48 countries over the last 12 years, we found a as did the rest of CDI indicators, but actually consistent pattern in keeping with this. As Figure 5 rose by 1.2%. The indicator appears, therefore, to be (on page 18) illustrates, the greater the child nutrition registering some of the setbacks that analysts would inequalities between the wealthiest quintile and the expect to see as a result of the triple ‘food-price, fuel two poorest quintiles, the worse a country appears to and financial’ crises, especially the dramatic hikes in perform overall. 16
  • 25.
    % of childrenaffected % of children affected 0 5 10 15 20 25 30 35 40 45 50 0 2 4 6 8 10 12 14 16 18 20 Ea Ea s st tA A sia sia C C EE EE La an La an d d tin C tin C Wasting 2005–10 Wasting 2000–04 Stunting 2005–10 Stunting 2000–04 IS IS th Am th Am e er e er C ic C ic a a a a M rib an M rib an id be d id be d d a d a no le E n no le E n rt as rt as h ta h ta Su A Su A b- fr nd b- fr nd ic ic Sa ha a Sa ha a ra ra n n A A fr fr ic ic a a So So ut ut h h A A sia sia % of children affected 0 % of children affected 5 10 15 20 25 30 35 40 45 50 0 2 4 6 8 10 12 14 16 Lo Lo w w in in co co m m Lo e Lo e w w -m -m id id Wasting 2005–10 Wasting 2000–04 Stunting 2005–10 Stunting 2000–04 dl dl e e in in co co U m U m pp e pp e er er -m -m id id Figure 4: Changes in Stunting and Wasting, 2000–2004 to 2005–2010 dl dl e e in in co co m m e e H H ig ig h h in in co co m m e e undernutrition increased threaten crises financial and ood 3  F 17
  • 26.
    the child developmentindex 2012 Figure 5: Prevalence of underweight children and inequality in wealth by country 50 y = 1.353x + 2.451 Inequalities in proportion of underweight children between the R2 = 0.6088 45 wealthiest quintile and the bottom two quintiles 40 35 30 25 20 15 10 5 0 0 5 10 15 20 25 30 35 National underweight prevalence Source of basic data: DHS (various years), Underweight data follow WHO Growth Standard In the Save the Children study of social protection, for example, low wages and extreme inequalities A Chance to Grow,54 we showed that using social in the distribution of productive assets. Such transfers to increase the share of income of the measures, including social transfers to address poorest two quintiles by just 10% – at a total cost remaining inequalities, can not only support better of just 1.5% of GDP – would reverse the increase long-term outcomes on child undernutrition, of the in people suffering undernutrition and lead to a type captured by the nutrition component of the substantial reduction simply by reducing the number Child Development Index, but can also play a vital of households unable to afford sufficient nutrition. role in limiting the effects of crisis by ensuring a social safety net operates. Of course, serious policy attention must be paid to the deeper structural causes of inequality – around, 18
  • 27.
    Conclusions The Child DevelopmentIndex combines also shown the greatest acceleration in the most measures of primary school enrolment, recent period. child mortality and nutrition to provide a Less encouraging has been the progress on simple measure of child well-being that reducing underweight prevalence among children can be tracked across time and compared under five. When we break down the different across countries. components of the Index – health, education and nutrition – data shows that progress has been The 2012 edition of the Child Development mainly driven by improvements in health and Index tells a story of success. This edition of the education. Undernutrition has consistently Index shows that, since the mid-1990s, substantial lagged behind and remains one of the major progress has been made in addressing the most basic reasons depressing further progress on threats to child survival and well-being. On average, child well-being. Whereas health and education the lives of children around the world improved by have improved well above the average of the Index, more than 30%. This means that the chances of a when progress accelerated in the second half of the child going to school were one-third higher, and the 2000s (at a rate of 23% and 32% respectively), in chances of an infant dying before their fifth birthday comparison, child undernutrition performed very were one-third lower, at the end of the 2000s than poorly, improving at the much lower rate of 13%. a decade before. During this period child well-being In the world’s poorest countries, progress was even improved in 90% of the countries surveyed. weaker, at just below 10%. Moreover, progress has been dramatically accelerating. Even more concerning is that the already slow From the first to the second half of the 2000s, the progress in tackling undernutrition has been further overall improvement rates in child well-being jeopardised by the effects of the global food and almost doubled compared with the end of the financial crises. The proportion of children 1990s (improvement rates were 22%, up from 12%). wasting (suffering from acute weight loss), which Acceleration of progress in under-five mortality and is commonly used to indicate the severity of food primary school enrolment was even more impressive: crises, actually rose in the second half of the the rate of improvement more than doubled during 2000s. Increases in wasting are worrying in their the 2000s (from 11% to 23%; and from 14% to own right, and also because they could be an 32% respectively). early warning sign of further deteriorations In addition to the accelerating progress it is clear in chronic undernutrition if the situation is not that – since the 2000s – developing countries quickly reversed. experienced faster than average rates of Moreover, inequalities between countries are still progress than developed countries. While the big. Whereas developed countries are very close to world’s poorest countries, mostly in sub-Saharan the highest score of the ranking, the average child in Africa and south Asia, had the weakest performance, developing countries is almost eight times worse off each group also includes countries that have shown than if she or he had been born in a rich country. very strong improvements. These groups have 19
  • 28.
    RECOMMENDATIONS The recent G8 agreement on the New • Ensure that national nutrition policies and social Alliance on Food Security and Nutrition; the transfers are aimed at reducing inequalities and the World Health Assembly support for a global disproportionate impact of undernutrition among target to reduce child stunting by 40% by the poorest and most vulnerable groups in society. 2025; and the commitment of the UK Prime Action on other drivers of undernutrition is also necessary: female education, family planning and Minister David Cameron to hold a hunger key maternal and child health interventions. summit during the 2012 Olympic Games in London are all welcome steps in putting the We call on bilateral and multilateral donors to: critical issues of hunger and undernutrition • Maintain the recent focus on these issues. higher on the international agenda. But this The hunger crisis can be dealt with but it report highlights the scale of the challenge. will need a concerted effort, not a stand- alone moment. Save the Children is calling on the international • Scale up multi-year funding for nutrition, community to seize these opportunities to redouble putting in place outcome targets to its efforts to tackle hunger and undernutrition. It reduce malnutrition and to support needs to do this through direct interventions during the establishment of social transfer crises and by addressing the global drivers of under- programmes – above all, for those countries nutrition – including the causes of this unprecedented that will find it most difficult to reduce stunting. period of rising and high food prices, coupled with • Address the underlying drivers of high food inequality, which has seen the numbers of people living prices, which are at the root of ever more in hunger rise for the first time in a generation. frequent food crises, such as the ones that We call on the developing country governments to: we are currently witnessing in the Sahel and the • Build on the target recently approved by the Horn of Africa. In particular, invest in smallholder World Health Organization of a 40% reduction in agricultural development, prioritising support for the number of children who are stunted by 2015, women smallholder producers and sustainable by setting up national policies and specific targets farming approaches. for reducing child stunting. • Commit to support the generation and use • Strengthen social transfer programmes (such as of better data to improve transparency and cash transfers) as a key policy tool to combat accountability around these vital issues. This hunger and undernutrition, in times of stability report has also highlighted the weaknesses in basic and as an effective crisis response tool that is child well-being data; the same data is, of course, easily scalable. crucial to effective policy responses. 20
  • 29.
    Appendix Table A1: ChildDevelopment Index score and rank, all countries, over time CDI rank CDI rank CDI rank Change Country CDI score CDI score CDI score 1995–99 2000–04 2005–10 1995–2010 1995–99 2000–04 2005–10 2 1 1 +1 Japan 0.53 0.44 0.35 5 4 2 +3 Spain 0.75 0.59 0.55 22 9 3 +19 Germany 4.69 0.81 0.64 12 14 4 +8 Italy 1.14 0.96 0.70 6 10 5 +1 France 0.87 0.85 0.74 10 8 6 +4 Canada 1.09 0.78 0.74 16 18 7 +9 Switzerland 2.49 2.52 0.82 3 5 8 -5 Norway 0.55 0.62 0.89 4 7 9 -5 United Kingdom 0.70 0.69 0.92 7 11 10 -3 Netherlands 0.88 0.86 0.93 8 6 11 -3 Iceland 0.93 0.65 1.01 11 13 12 -1 Belgium 1.10 0.96 1.05 15 16 13 +2 Luxemburg 1.71 1.63 1.30 9 2 14 -5 Finland 0.97 0.53 1.37 13 15 15 -2 Austria 1.49 1.60 1.49 17 17 16 +1 Australia 2.65 2.09 1.54 30 29 17 +13 Croatia 6.03 5.39 1.62 18 19 18 +0 Ireland 2.79 2.56 1.68 1 3 19 -18 Sweden 0.50 0.55 1.85 14 12 20 -6 Denmark 1.53 0.86 1.87 23 20 21 +2 Cuba 4.86 2.83 2.27 24 25 22 +2 Chile 5.10 4.30 2.83 United States of 19 21 23 -4 2.98 3.04 2.86 America 20 23 24 -4 Argentina 4.33 3.60 2.95 36 22 25 +11 Costa Rica 6.95 3.47 3.15 38 31 26 +12 Tunisia 7.70 5.76 3.40 27 30 27 +0 Uruguay 5.80 5.53 3.62 28 24 28 +0 Czech Republic 5.81 3.67 3.63 42 39 29 +13 China 8.23 6.39 3.69 25 26 30 -5 Bahrain 5.76 4.66 3.98 continued overleaf 21
  • 30.
    Table A1: ChildDevelopment Index score and rank, all countries, over time continued the child development index 2012 CDI rank CDI rank CDI rank Change Country CDI score CDI score CDI score 1995–99 2000–04 2005–10 1995–2010 1995–99 2000–04 2005–10 32 33 31 +1 Belize 6.78 6.07 4.06 Republic of 35 27 32 +3 6.84 4.68 4.07 Macedonia (FYROM) 21 28 33 -12 Belarus 4.37 4.95 4.30 29 34 34 -5 Romania 5.93 6.12 4.32 39 38 35 +4 Mexico 7.79 6.29 4.40 43 44 36 +7 Brazil 8.84 6.96 4.44 37 47 37 +0 Russian Federation 7.48 7.17 4.47 51 48 38 +13 Peru 9.54 7.37 4.50 33 41 39 -6 Qatar 6.83 6.68 4.71 53 43 40 +13 Ecuador 10.00 6.93 4.93 34 32 41 -7 Panama 6.83 5.78 4.94 44 37 42 +2 Malaysia 8.89 6.27 5.17 62 67 43 +19 Georgia 12.58 11.55 5.27 48 63 44 +4 Kuwait 9.10 9.85 5.32 41 42 45 -4 Jordan 8.17 6.73 5.33 49 45 46 +3 Venezuela 9.28 7.10 5.69 73 56 47 +26 Turkey 15.25 8.86 5.70 69 61 48 +21 El Salvador 14.74 9.66 5.87 57 46 49 +8 Thailand 10.37 7.10 6.24 64 55 50 +14 Algeria 12.63 8.78 6.35 56 54 51 +5 Kazakhstan 10.33 8.73 6.35 50 53 52 -2 Colombia 9.42 8.58 6.66 65 62 53 +12 Egypt, Arab Republic 12.66 9.71 6.69 52 36 54 -2 Syrian Arab Republic 9.66 6.25 6.97 46 60 55 -9 Trinidad and Tobago 8.96 9.60 7.26 40 49 56 -16 Moldova 7.95 7.82 7.26 78 69 57 +21 Nicaragua 17.14 12.29 7.40 31 35 58 -27 Paraguay 6.18 6.24 7.50 71 82 59 +12 Mongolia 15.19 14.86 7.59 75 76 60 +15 Iran, Islamic Republic 15.99 14.01 7.93 45 57 61 -16 Lebanon 8.90 9.19 8.05 66 68 62 +4 United Arab Emirates 13.14 12.23 8.06 77 71 63 +14 Honduras 16.93 12.70 8.09 61 64 64 -3 Saudi Arabia 11.57 10.04 8.13 55 58 65 -10 Mauritius 10.19 9.40 8.50 47 51 66 -19 Jamaica 9.08 8.03 8.53 59 66 67 -8 Suriname 11.28 11.00 8.62 22
  • 31.
    Table A1: ChildDevelopment Index score and rank, all countries, over time continued CDI rank CDI rank CDI rank Change Country CDI score CDI score CDI score 1995–99 2000–04 2005–10 1995–2010 1995–99 2000–04 2005–10 appendix 54 52 68 -14 Armenia 10.18 8.58 8.66 67 65 69 -2 Kyrgyz Republic 13.76 10.61 8.74 70 70 70 +0 Bolivia 14.87 12.42 9.04 91 84 71 +20 Maldives 23.49 14.97 9.15 89 85 72 +17 Guatemala 21.07 15.23 9.39 72 72 73 -1 Sri Lanka 15.23 12.90 9.74 74 74 74 +0 Guyana 15.93 13.40 10.22 58 59 75 -17 Albania 10.85 9.57 10.25 63 50 76 -13 Dominican Republic 12.58 7.86 10.31 85 78 77 +8 Morocco 19.62 14.34 10.45 26 40 78 -52 West Bank and Gaza 5.79 6.48 10.56 84 81 79 +5 Vietnam 19.46 14.75 11.26 76 83 80 -4 Philippines 16.89 14.86 11.35 79 77 81 -2 Iraq 17.52 14.03 11.40 88 79 82 +6 Indonesia 20.80 14.38 11.40 68 75 83 -15 Oman 14.25 13.77 11.55 60 73 84 -24 South Africa 11.48 13.09 12.25 87 86 85 +2 Tajikistan 20.62 16.24 12.43 Sao Tome and 81 80 86 -5 18.66 14.56 13.23 Principe 80 88 87 -7 Azerbaijan 17.82 18.66 14.12 83 87 88 -5 Gabon 19.02 16.38 14.62 82 89 89 -7 Botswana 18.70 19.50 15.27 92 91 90 +2 Namibia 25.18 22.41 15.81 104 106 91 +13 Bhutan 33.88 29.28 16.28 122 107 92 +30 Tanzania 42.58 29.69 16.66 106 97 93 +13 Cambodia 35.20 26.79 18.61 94 93 94 +0 Myanmar 27.07 24.70 18.68 90 96 95 -5 Swaziland 22.41 25.54 18.86 86 90 96 -10 Zimbabwe 20.42 21.57 19.23 102 94 97 +5 Uganda 33.13 24.80 19.53 110 95 98 +12 Malawi 36.17 24.98 19.54 117 120 99 +18 Rwanda 39.26 35.60 19.94 107 110 100 +7 Comoros 35.34 31.60 20.64 111 118 101 +10 Zambia 36.40 34.47 20.79 97 102 102 -5 Kenya 30.42 28.52 21.18 120 115 103 +17 Madagascar 41.01 33.94 22.20 99 99 104 -5 Cameroon 31.00 28.10 22.52 continued overleaf 23
  • 32.
    Table A1: ChildDevelopment Index score and rank, all countries, over time continued the child development index 2012 CDI rank CDI rank CDI rank Change Country CDI score CDI score CDI score 1995–99 2000–04 2005–10 1995–2010 1995–99 2000–04 2005–10 125 114 105 +20 Benin 43.15 32.99 22.77 108 105 106 +2 Lao PDR 35.44 29.10 22.81 109 101 107 +2 Bangladesh 36.16 28.36 22.82 113 116 108 +5 Senegal 37.22 34.00 22.90 103 111 109 -6 Ghana 33.63 31.92 23.04 93 100 110 -17 Togo 26.83 28.25 23.26 98 109 111 -13 Congo, Republic 30.48 31.37 23.32 100 103 112 -12 India 31.22 28.72 23.46 116 112 113 +3 Nepal 38.92 32.57 25.01 96 92 114 -18 Lesotho 28.40 24.40 25.01 127 123 115 +12 Mozambique 45.35 38.18 25.38 101 113 116 -15 Mauritania 32.03 32.80 25.63 105 104 117 -12 Gambia, The 35.19 28.73 25.68 119 119 118 +1 Timor-Leste 40.47 34.79 28.16 140 134 119 +21 Angola 59.56 48.16 28.22 115 121 120 -5 Pakistan 38.64 36.50 30.15 129 126 121 +8 Guinea 46.48 41.78 30.47 132 133 122 +10 Guinea-Bissau 49.43 47.94 31.02 121 122 123 -2 Yemen, Republic 42.03 36.89 31.17 133 132 124 +9 Burundi 50.63 47.27 32.35 114 108 125 -11 Haiti 37.68 31.10 32.42 138 136 126 +12 Ethiopia 54.11 49.35 32.53 95 98 127 -32 Equatorial Guinea 28.30 27.59 32.93 112 117 128 -16 Côte d’Ivoire 37.06 34.02 34.42 123 127 129 -6 Sudan 42.79 41.93 35.77 124 125 130 -6 Nigeria 43.06 41.70 37.07 135 137 131 +4 Liberia 51.24 50.82 37.90 130 124 132 -2 Eritrea 48.81 40.85 39.39 137 135 133 +4 Mali 54.02 48.40 39.53 139 140 134 +5 Sierra Leone 55.45 55.51 39.71 128 130 135 -7 Djibouti 46.02 46.25 40.03 Central African 118 128 136 -18 40.40 44.65 41.47 Republic Congo, Democratic 126 131 137 -11 43.17 46.46 43.01 Republic 136 138 138 -2 Burkina Faso 52.17 52.58 43.93 131 129 139 -8 Chad 49.05 45.91 44.11 141 141 140 +1 Niger 70.04 62.19 48.73 134 139 141 -7 Somalia 50.93 55.02 54.5 24
  • 33.
    endnotes 1 Thispercentage refers only to the CDI sample, which includes 141 28 World Health Organization and UNICEF (2012) Countdown to 2015: countries. See Box 1 for further methodological details. Building a Future for Women and Children: the 2012 Report. Other countries 2 The CDI assesses a sample of 141 countries. See Box 1 for further include Cameroon, Chad, Democratic Republic of Congo, Lesotho, Somalia methodological details. and Zimbabwe. 3 World Health Organization and UNICEF (2012) Countdown to 2015: 29 Education data from United Nations and World Bank data sets Building a Future for Women and Children: the 2012 Report 30 L Jamieson et al (eds) (2011) South African Child Gauge 2010/2011, Cape 4 Ibid Town: Children’s Institute, University of Cape Town 5 World Bank and Education in Indonesia http://web.worldbank.org/ 31 Ibid WBSITE/EXTERNAL/COUNTRIES/EASTASIAPACIFICEXT/0,,contentMD 32 UNICEF (2009) State of the World’s Children 2009, New York K:23187196~pagePK:146736~piPK:146830~theSitePK:226301,00.html 33 South African Social Security Agency (SASSA) Fact Sheet No. 4 of 2012, 6 UNICEF http://www.unicef.org/infobycountry/indonesia_statistics.html 30 April 2012 7 Ibid 34 Department of Social Development, SASSA and UNICEF (2012) The 8 Ministry of National Development Planning/National Development South African Child Support Grant Impact Assessment: Evidence from a survey of Planning Agency (BAPPENAS) Republic of Indonesia – Report on the children, adolescents and their households. Pretoria: UNICEF South Africa Achievement of the Millennium Development Goals Indonesia 2010 35 Ibid 9 I Rafiqah and I Blackett (2010) Public-Private Partnership for Handwashing 36 Save the Children website: http://www.savethechildren.org.uk/what-we- with Soap in Indonesia http://www.wateraidcommunity.org.au/document. do/emergencies/west-africa-appeal doc?id=28 37 The full Index, for each of the three periods 1995–99, 2000–04 and 10 United Nations Population Fund (2011) State of the World’s Midwifery 2005–10, can be found in Table A1 of the Appendix. 2011: Delivering health, saving lives 38 See UNICEF’s State of the World’s Children reports for 2007 and 2012 11 UNICEF http://www.unicef.org/infobycountry/indonesia_statistics.html 39 See www.childinfo.org for the latest data on under-five mortality. 12 Ibid 40 World Health Organization and UNICEF (2012) Countdown to 2015: 13 Save the Children, Indonesia’s Ministry of Social Affairs, UNICEF (2077) Building a Future for Women and Children: the 2012 Report Someone That Matters: The quality of care in childcare institutions in Indonesia 41 Ibid 14 A Sumner, A Suryahadi and N Thang (2012) Poverty And Inequalities In 42 Ibid Middle-Income Southeast Asia Institute of Development Studies 43 Countdown to 2015 countries are 75 countries which together account 15 Demographic and Health Survey for Indonesia 2007, data on under-five for over 95% of under-five mortality globally. mortality disaggregated by wealth quintiles 44 Africa’s Child Health Miracle: The Biggest, Best Story in Development, http:// 16 See www.childinfo.org for the most up-to-date data on child blogs.cgdev.org/globaldevelopment/2012/05/africas-child-health-miracle- undernutrition. The 65th World Health Assembly adopted the Maternal, the-biggest-best-story-in-development.php?utm_ Infant and Young Child Nutrition Implementation plan which includes 45 Analyses of under-five mortality rates disaggregated by wealth quintile a global stunting reduction target of 40% by 2025. The Indonesian from the Demographic and Health Surveys show this. government also committed to reduce stunting prevalence among under-five children from 37 per cent in 2007 to 32 per cent in 2014 in its 46 The 2011 Global Compact on Learning provides a policy agenda and National Mid-term Development Plan 2010–2014. concrete steps to advance learning for girls and boys in some of the world’s poorest countries http://www.globalcompactonlearning.org/ 17 World Health Organization and UNICEF (2012) Countdown to 2015: Building a Future for Women and Children: the 2012 Report 47 UNESCO EFA Global Monitoring Report http://www.unesco.org/new/ en/education/themes/leading-the-international-agenda/efareport/ , World 18 Tanzanian Demographic and Health Survey (2009/10) Bank 2011 “Learning for All: Investing in People’s Knowledge and Skills to 19 Save the Children (2011) Analysis of Health Budget and Financing for Promote development”. http://siteresources.worldbank.org/EDUCATION/ Maternal, Newborn and Child Health in Tanzania Resources/ESSU/Education_Strategy_4_12_2011.pdf 20 World Health Organization, Accountability for Women’s and Children’s 48 Centre for Universal Education at Brookings (2011) A Global Compact health: The United Republic of Tanzania. Available at: http://www.who.int/ on Learning: Taking Action on Education in Developing Countries http://www. woman_child_accountability/countries/tza/en/index.html Accessed 15 June brookings.edu/~/media/events/2011/6/15%20education%20compact/0609_ 2012 global_compact.pdf 21 Ibid 49 UNESCO (2010) Education and the Millennium Development Goals, Paris: 22 Save the Children UK, UNICEF, Overseas Development Institute (2012) UNESCO http://www.unesco.org/fileadmin/MULTIMEDIA/HQ/ED/GMR/ Progress in Child Well-being: Building on What Works pdf/gmr2010/MDG2010_Facts_and_Figures_EN.pdf 23 Progress of the Scaling Up Nutrition Movement in Tanzania http://www. 50 Centre for Universal Education at Brookings (2011) A Global Compact scalingupnutrition.org/wp-content/uploads/2011/09/Tanzania-SUN-NYC- on Learning: Taking Action on Education in Developing Countries http://www. EE-2011.pdf brookings.edu/~/media/events/2011/6/15%20education%20compact/0609_ 24 Progress Report on Creation of the Partnership for Nutrition in global_compact.pdf Tanzania (PANITA) for the Period of September 2010-August 2011, http:// 51 UNESCO, Education and the Millennium Development Goals (2010) Paris: nutritiontanzania.org/cms/index.php?option=com_content&view=article&i UNESCO, 2010)http://www.unesco.org/fileadmin/MULTIMEDIA/HQ/ED/ d=16&Itemid=24 GMR/pdf/gmr2010/MDG2010_Facts_and_Figures_EN.pdf 25 United Republic of Tanzania (2011) Guidelines for Councils for the 52 See, for example, the survey in Helen Young and Susanne Jaspars (2006) preparation of Plan and Budget for nutrition 2012-13 ‘The meaning and measurement of acute malnutrition in emergencies: A 26 EU Health Overseas Development Assistance and Aid Effectiveness, primer for decision-makers’, ODI/Humanitarian Practice Network: http:// Country Briefing 2, October 2010, Health Spending in Tanzania: The Impact www.odihpn.org/documents/networkpaper056.pdf of Current Aid Structures and Aid Effectiveness 53 Save the Children (2009) How the Global Food Crisis is hurting Children: The 27 Save the Children website, Occupied Palestinian territory http://www. impact of the food price hike on a rural community in northern Bangladesh. savethechildren.org.uk/where-we-work/middle-east/occupied-palestinian- 54 Save the Children (2012) A Chance to Grow: How social protection can territory tackle malnutrition and promote economic opportunities 25
  • 34.
    Greenland (Denmark) Finland Norway Iceland Faeroe Is Sweden (Den) Russia Estonia United Latvia Kingdom Lithuania Denmark Canada Rep of Netherlands Poland Belarus Ireland Germany Belgium Lux. Cze. Slovakia Ukraine Lie. Swi. AustriaHungary Moldova France Slov. Romania Cro. Monaco San Marino Bos. Serbia Bulgaria Andorra Mon. Kos. FYR Georgia The Azores (Port) Alb.Mac. Italy Spain Turkey Armenia Azerbaijan Portugal Turkmenistan United States Greece Malta Cyprus Syria Tunisia Lebanon Iran Madeira (Port) Morocco Israel Iraq Bermuda (UK) OPT. OPT. Jordan Canary Is (Sp) Algeria Kuwait Libya Egypt Bahrain Qatar Bahamas Western Sahara UAE Cuba Saudi Arabia Oman Hawaiian Turks & Caicos Is Islands (UK) (USA) Revilla Gigedo Is Mexico Cayman Is Dominican Rep. Mauretania (Mex) Puerto Rico (US) Anguilla (UK) Mali Niger Chad Jamaica Haiti Belize St Kitts Antigua & Barbuda Eritrea Honduras & Nevis Guadeloupe (Fr) Cape Verde Dominica Guatemala Martinique (Fr) Senegal Sudan Yemen El Nicaragua Curaçao St Lucia Barbados The Gambia Burkina Salvador Faso Socotra (Yem) Guinea-Bissau Djibouti Benin Trinidad & Tobago Costa Rica Guinea Nigeria Ethiopia Kingman Reef (US) Venezuela Sierra Leone Panama Guyana Central South Palmyra Is (US) Côte Sudan Suriname d'Ivoire African Republic Cocos French Liberia Togo Somalia (CR) Guiana Ghana Cameroon Colombia Bioko (Eq G) Uganda Equatorial Guinea Democratic Sao Tomé Republic Jarvis Is (US) Galapagos Is Sao Paulo (Br) e Principé of Congo (Ecu) Gabon Kenya Line Ecuador Rwanda Islands Annabón (Eq G) (Kiri) Burundi Congo Cabinda (Angola) Seychelles Tanzania Marquesas Ascension (UK) Providence Is Islands Brazil Aldabra Is (Sey) Agalega Is (Fr) (Sey) (Maur) Peru Comoros Farquhar Is Angola Malawi (Sey) Mayotte Zambia (Fr) St Helena (UK) Bolivia Madagascar Society Mozambique Cook Islands Zimbabwe Mauritius Islands (Fr) (NZ) Namibia Reunion Paraguay Botswana (Fr) Tubai Is (Fr) Gambier Islands Sala-y-Gómez(Chile) (Fr) Pitcairn Is S Felix (UK) (Chile) S Ambrosio Swaziland Easter Is (Chile) (Chile) De Bass (Fr) Lesotho South Africa Chile Juan Fernandez Is Argentina MAP B (Chile) Uruguay Countries’ scores on the Child Development Index 2012, in four groups from ‘very high’ to ‘low’ Krozet Is Prince Edward Is (Fr) (S Afr) NOT INCLUDED VERY HIGH MEDIUM IN THE INDEX Falkland Is (UK) South Georgia (UK) HIGH LOW South Sandwich Is (UK)
  • 35.
    Finland Norway Iceland Faeroe Is Sweden (Den) Russia Estonia United Latvia Kingdom Lithuania Denmark Rep of Netherlands Poland Belarus Ireland Germany Kazakhstan Belgium Lux. Cze. Slovakia Ukraine Kazakhstan Lie. Swi. AustriaHungary Moldova France Mongolia Slov. Romania Mongolia Cro. Serbia Monaco San Marino Bos. Bulgaria Andorra Mon. Kos. FYR Georgia Uzbekistan The Azores (Port)Kyrgyzstan Italy Alb.Mac. Democratic Kyrgyzstan Democratic Uzbekistan Spain People’s Rep Armenia People’s Rep Turkey Portugal of Korea AzerbaijanTurkmenistan of Korea Tajikistan Republic of Tajikistan Republic of Korea Japan Korea Japan Greece ChinaMalta Cyprus Syria China Afghanistan Tunisia Lebanon Iran Afghanistan Madeira (Port) Morocco Israel Iraq OPT. OPT. Jordan Midway Is Midway Is (US) (US) Pakistan Is (Sp) Canary BhutanAlgeria Kuwait Pakistan Bhutan Nepal Libya Nepal Egypt Bahrain Qatar Western Bangladesh Oman Bangladesh Sahara UAE Republic of China Saudi Arabia Republic of China Myanmar (Taiwan) Myanmar (Taiwan) India India (Burma) (Burma) Wake Is Wake Is Mauretania Lao (US) Lao (US) Mali PDR Chad PDR Niger Northern Northern Eritrea Mariana Is Mariana Is Cape Verde Thailand Thailand Vietnam (US) Vietnam (US) Senegal Sudan Yemen Kampuchea Kampuchea The Gambia Burkina Philippines Philippines Faso Djibouti Socotra (Yem) Guinea-Bissau Laccadive Is Andaman Is Benin Laccadive Is Andaman Is (Ind) (Ind) (Ind) Marshall Islands (Ind) Marshall Islands Guinea Nigeria Ethiopia Sierra Leone Nicobar Is South Nicobar Is Côte(Ind) Central (Ind) African Republic Sudan Micronesia Micronesia d'Ivoire Sri Lanka Liberia Togo Brunei Somalia Sri Lanka Brunei Ghana Cameroon The Bioko (Eq G) Malaysia The Malaysia Maldives Uganda Maldives Equatorial Guinea Democratic Sao Tomé Republic Kiribati Kiribati Sao Paulo (Br) e Principé of Congo Gabon Kenya Rwanda Nauru Nauru Annabón (Eq G) Burundi Papua Papua Congo New Guinea New Guinea Indonesia Indonesia Chagos Cabinda (Angola) Seychelles Chagos Archipeligo Tanzania Archipeligo (UK) (UK) Ascension (UK) Providence Is Solomon Is Solomon Is Aldabra Is (Sey) Tuvalu Tuvalu (Sey) Agalega Is Comoros Farquhar Is (Maur) Christmas Angola Is (Sey) Christmas Is (Aus) Malawi (Aus) Mayotte Western Samoa Western Samoa Keeling Is Keeling Is (Aus) Zambia (Fr) (Aus) St Helena (UK) Vanuatu Vanuatu Fiji Fiji Mozambique Zimbabwe Madagascar Rodriguez Is Rodriguez Is (Maur) (Maur) Tonga Tonga Mauritius Namibia Reunion New New (Fr) Caledonia Caledonia Botswana Australia (Fr) Australia (Fr) Swaziland Lesotho Christmas Is Kermadec Is Christmas Is Kermadec Is South Africa (Aus) (NZ) (Aus) (NZ) Amsterdam Is (Fr) Amsterdam Is (Fr) St Paul (Fr) New Zealand Paul (Fr) St New Zealand Chatham Is Chatham Is (NZ) (NZ) Krozet Is Bounty Is Bounty Is Prince Edward Is (Fr) (S Afr) (NZ) (NZ) Kerguelen Is Kerguelen Is (Fr) (Fr) Auckland Is Antipodes Is Auckland Is Antipodes Is (NZ) (NZ) (NZ) (NZ) Heard Is (Aus) Macquarie Is Heard Is (Aus) Is Campbell Macquarie Is Campbell Is (NZ) (NZ) (Aus) (Aus) South Sandwich Is (UK) Cover photo: Three-year-old Asha in Sanjay Colony, a slum area in Delhi where Save the Children supports a mobile health clinic, staffed by a doctor, nurses and a pharmacist. (Photo: Rachel Palmer/Save the Children)
  • 36.
    The Child Development Cover ph index 2012 oto : per-ander s pe tter sso n/ sa ve t he c hildren Progress, challenges and inequality The Child Development Index (CDI) offers a fascinating insight into how children are faring around the world. Key findings of this new edition of the CDI are: • Overall improvement rates in child well-being almost doubled in the first decade of the 21st century. • Developing countries experienced faster rates of progress than developed countries in the same period. • Undernutrution remains one of the main factors holding back progress on children’s well-being as shown by the Index. • The proportion of children suffering from wasting – or acute weight loss – actually rose in the second half of the 2000s. The CDI monitors child well-being in 141 countries, aggregating data on child mortality, primary-school enrolment and underweight. Case studies on Tanzania – the highest climber on the CDI – Indonesia and South Africa are also included. This new edition highlights the impressive progress the world has made. At the same time it warns of the impact of the failure to tackle child undernutrition on children’s overall well-being. Drawing on data on stunting and wasting, it looks at the disastrous effects of the food and financial crises on children. Finally, it makes a series of recommendations to developing- country governments and to donors on tackling hunger and undernutrition. cover photo: hildren everyone.org