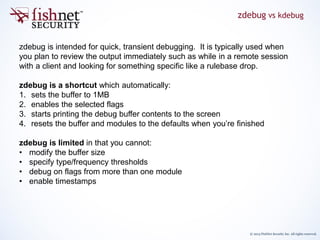
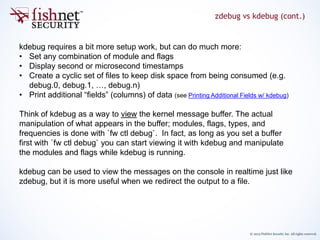
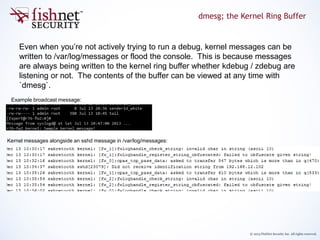
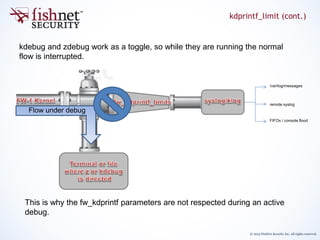
The document provides an in-depth guide on kernel debugging techniques using zdebug and kdebug, detailing their functionalities, setup, and advantages. It discusses various parameters and commands for managing debug output, including buffer sizes, message thresholds, and flags for more refined control. Additionally, it introduces practical tools like a debug-sampler bash script for simplifying the debugging process across various kernel flags.


![© 2013 FishNet Security Inc. All rights reserved.
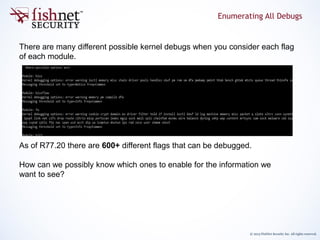
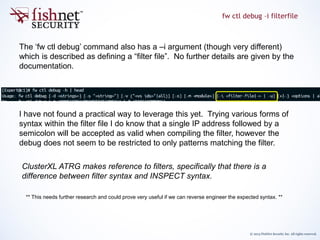
Type and frequency thresholds are not documented very well. They are a
means to control debug verbosity, but similar to the user space
“TDERROR_ALL_ALL=[1-5]”, the impact is arbitrary. Unless we know that a
particular message only appears at a higher “type” it is best to leave these at
the most verbose setting. As of the time of this writing the available levels are
as follows:
Type / Frequency Thresholds
Type Frequency
INFO COMMON
NOTICE RARE
WRN
ERR
NONE
Careful! Unlike all other levels of “type”, when NONE is set there is no feedback printed to
the console to warn you that your debug will be empty.
Type and frequency are changed with `fw ctl debug -t <type> -f <freq>`.](https://image.slidesharecdn.com/checkpointkerneldebug-171229165912/85/Check-Point-Advanced-Kernel-Debug-18-320.jpg)
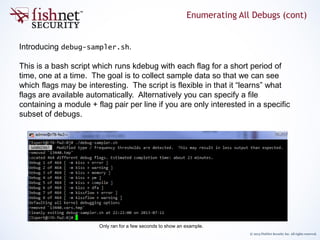
![© 2013 FishNet Security Inc. All rights reserved.
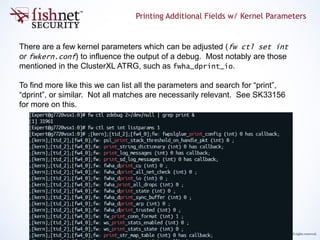
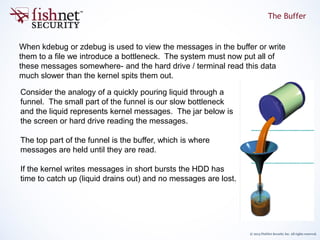
kdebug accepts an optional argument “[-p fld1[,fld2..]” which can be used to
further control fields that get printed.
This is the only exception to the earlier statement*;
“Think of kdebug as a way to view the kernel message buffer. The actual manipulation of what
appears in the buffer; modules, flags, types, and frequencies is done with `fw ctl debug`”
The contextual help shows all possible values for -p:
Among these is a “type” and “freq”, which can be leveraged to find at which
threshold a known message exists.
Printing Additional Fields w/ kdebug](https://image.slidesharecdn.com/checkpointkerneldebug-171229165912/85/Check-Point-Advanced-Kernel-Debug-19-320.jpg)