Chart (2)
•
0 likes•173 views

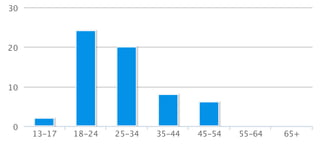
This document appears to be a bar graph showing age demographics broken into categories from 13-17 to 65+, with the y-axis ranging from 0 to 30. It shows increasing numbers in the 18-24, 25-34, and 35-44 age groups, with a peak in the 35-44 group, then tapering off in the older age groups.
Report
Share
Report
Share
Download to read offline
Recommended
Learn arabic lesson #3
Learn arabic lesson #3
This course teach numbers in arabic language and classement.
DECÀLEG PER A LES BANDES DE MÚSICA
Les 10 regles fonamentals per saber com ser un perfecte membre d'una banda de música.
Recommended
Learn arabic lesson #3
Learn arabic lesson #3
This course teach numbers in arabic language and classement.
DECÀLEG PER A LES BANDES DE MÚSICA
Les 10 regles fonamentals per saber com ser un perfecte membre d'una banda de música.
Startups + M&A Kuriermarkt
Zusammenstellung der Marktteilnehmer und Beteiligungen auf dem Kuriermarkt,
Senglea (Malta) during the World War 2 (1940 - 1944) by Mons. Emmanuel Brincat
Senglea (Malta) during the World War 2 (1940 - 1944) by Monsignor Emmanuel Brincat
Learn SQL from basic queries to Advance queries
Dive into the world of data analysis with our comprehensive guide on mastering SQL! This presentation offers a practical approach to learning SQL, focusing on real-world applications and hands-on practice. Whether you're a beginner or looking to sharpen your skills, this guide provides the tools you need to extract, analyze, and interpret data effectively.
Key Highlights:
Foundations of SQL: Understand the basics of SQL, including data retrieval, filtering, and aggregation.
Advanced Queries: Learn to craft complex queries to uncover deep insights from your data.
Data Trends and Patterns: Discover how to identify and interpret trends and patterns in your datasets.
Practical Examples: Follow step-by-step examples to apply SQL techniques in real-world scenarios.
Actionable Insights: Gain the skills to derive actionable insights that drive informed decision-making.
Join us on this journey to enhance your data analysis capabilities and unlock the full potential of SQL. Perfect for data enthusiasts, analysts, and anyone eager to harness the power of data!
#DataAnalysis #SQL #LearningSQL #DataInsights #DataScience #Analytics
一比一原版(爱大毕业证书)爱丁堡大学毕业证如何办理
毕业原版【微信:41543339】【(爱大毕业证书)爱丁堡大学毕业证】【微信:41543339】成绩单、外壳、offer、留信学历认证(永久存档真实可查)采用学校原版纸张、特殊工艺完全按照原版一比一制作(包括:隐形水印,阴影底纹,钢印LOGO烫金烫银,LOGO烫金烫银复合重叠,文字图案浮雕,激光镭射,紫外荧光,温感,复印防伪)行业标杆!精益求精,诚心合作,真诚制作!多年品质 ,按需精细制作,24小时接单,全套进口原装设备,十五年致力于帮助留学生解决难题,业务范围有加拿大、英国、澳洲、韩国、美国、新加坡,新西兰等学历材料,包您满意。
【我们承诺采用的是学校原版纸张(纸质、底色、纹路),我们拥有全套进口原装设备,特殊工艺都是采用不同机器制作,仿真度基本可以达到100%,所有工艺效果都可提前给客户展示,不满意可以根据客户要求进行调整,直到满意为止!】
【业务选择办理准则】
一、工作未确定,回国需先给父母、亲戚朋友看下文凭的情况,办理一份就读学校的毕业证【微信41543339】文凭即可
二、回国进私企、外企、自己做生意的情况,这些单位是不查询毕业证真伪的,而且国内没有渠道去查询国外文凭的真假,也不需要提供真实教育部认证。鉴于此,办理一份毕业证【微信41543339】即可
三、进国企,银行,事业单位,考公务员等等,这些单位是必需要提供真实教育部认证的,办理教育部认证所需资料众多且烦琐,所有材料您都必须提供原件,我们凭借丰富的经验,快捷的绿色通道帮您快速整合材料,让您少走弯路。
留信网认证的作用:
1:该专业认证可证明留学生真实身份
2:同时对留学生所学专业登记给予评定
3:国家专业人才认证中心颁发入库证书
4:这个认证书并且可以归档倒地方
5:凡事获得留信网入网的信息将会逐步更新到个人身份内,将在公安局网内查询个人身份证信息后,同步读取人才网入库信息
6:个人职称评审加20分
7:个人信誉贷款加10分
8:在国家人才网主办的国家网络招聘大会中纳入资料,供国家高端企业选择人才
留信网服务项目:
1、留学生专业人才库服务(留信分析)
2、国(境)学习人员提供就业推荐信服务
3、留学人员区块链存储服务
→ 【关于价格问题(保证一手价格)】
我们所定的价格是非常合理的,而且我们现在做得单子大多数都是代理和回头客户介绍的所以一般现在有新的单子 我给客户的都是第一手的代理价格,因为我想坦诚对待大家 不想跟大家在价格方面浪费时间
对于老客户或者被老客户介绍过来的朋友,我们都会适当给一些优惠。
选择实体注册公司办理,更放心,更安全!我们的承诺:客户在留信官方认证查询网站查询到认证通过结果后付款,不成功不收费!
Adjusting OpenMP PageRank : SHORT REPORT / NOTES
For massive graphs that fit in RAM, but not in GPU memory, it is possible to take
advantage of a shared memory system with multiple CPUs, each with multiple cores, to
accelerate pagerank computation. If the NUMA architecture of the system is properly taken
into account with good vertex partitioning, the speedup can be significant. To take steps in
this direction, experiments are conducted to implement pagerank in OpenMP using two
different approaches, uniform and hybrid. The uniform approach runs all primitives required
for pagerank in OpenMP mode (with multiple threads). On the other hand, the hybrid
approach runs certain primitives in sequential mode (i.e., sumAt, multiply).
Unleashing the Power of Data_ Choosing a Trusted Analytics Platform.pdf
In this guide, we'll explore the key considerations and features to look for when choosing a Trusted analytics platform that meets your organization's needs and delivers actionable intelligence you can trust.
一比一原版(CBU毕业证)卡普顿大学毕业证如何办理
CBU毕业证offer【微信95270640】《卡普顿大学毕业证书》《QQ微信95270640》学位证书电子版:在线制作卡普顿大学毕业证成绩单GPA修改(制作CBU毕业证成绩单CBU文凭证书样本)、卡普顿大学毕业证书与成绩单样本图片、《CBU学历证书学位证书》、卡普顿大学毕业证案例毕业证书制作軟體、在线制作加拿大硕士学历证书真实可查.
如果您是以下情况,我们都能竭诚为您解决实际问题:【公司采用定金+余款的付款流程,以最大化保障您的利益,让您放心无忧】
1、在校期间,因各种原因未能顺利毕业,拿不到官方毕业证+微信95270640
2、面对父母的压力,希望尽快拿到卡普顿大学卡普顿大学毕业证成绩单;
3、不清楚流程以及材料该如何准备卡普顿大学卡普顿大学毕业证成绩单;
4、回国时间很长,忘记办理;
5、回国马上就要找工作,办给用人单位看;
6、企事业单位必须要求办理的;
面向美国乔治城大学毕业留学生提供以下服务:
【★卡普顿大学卡普顿大学毕业证成绩单毕业证、成绩单等全套材料,从防伪到印刷,从水印到钢印烫金,与学校100%相同】
【★真实使馆认证(留学人员回国证明),使馆存档可通过大使馆查询确认】
【★真实教育部认证,教育部存档,教育部留服网站可查】
【★真实留信认证,留信网入库存档,可查卡普顿大学卡普顿大学毕业证成绩单】
我们从事工作十余年的有着丰富经验的业务顾问,熟悉海外各国大学的学制及教育体系,并且以挂科生解决毕业材料不全问题为基础,为客户量身定制1对1方案,未能毕业的回国留学生成功搭建回国顺利发展所需的桥梁。我们一直努力以高品质的教育为起点,以诚信、专业、高效、创新作为一切的行动宗旨,始终把“诚信为主、质量为本、客户第一”作为我们全部工作的出发点和归宿点。同时为海内外留学生提供大学毕业证购买、补办成绩单及各类分数修改等服务;归国认证方面,提供《留信网入库》申请、《国外学历学位认证》申请以及真实学籍办理等服务,帮助众多莘莘学子实现了一个又一个梦想。
专业服务,请勿犹豫联系我
如果您真实毕业回国,对于学历认证无从下手,请联系我,我们免费帮您递交
诚招代理:本公司诚聘当地代理人员,如果你有业余时间,或者你有同学朋友需要,有兴趣就请联系我
你赢我赢,共创双赢
你做代理,可以帮助卡普顿大学同学朋友
你做代理,可以拯救卡普顿大学失足青年
你做代理,可以挽救卡普顿大学一个个人才
你做代理,你将是别人人生卡普顿大学的转折点
你做代理,可以改变自己,改变他人,给他人和自己一个机会道银边山娃摸索着扯了扯灯绳小屋顿时一片刺眼的亮瞅瞅床头的诺基亚山娃苦笑着摇了摇头连他自己都感到奇怪居然又睡到上午点半掐指算算随父亲进城已一个多星期了山娃几乎天天起得这么迟在乡下老家暑假五点多山娃就醒来在爷爷奶奶嘁嘁喳喳的忙碌声中一骨碌爬起把牛驱到后龙山再从莲塘里采回一蛇皮袋湿漉漉的莲蓬也才点多点半早就吃过早餐玩耍去了山娃的家在闽西山区依山傍水山清水秀门前潺潺流淌的蜿蜒小溪一直都是山娃和小伙伴们盛试
More Related Content
Viewers also liked
Startups + M&A Kuriermarkt
Zusammenstellung der Marktteilnehmer und Beteiligungen auf dem Kuriermarkt,
Senglea (Malta) during the World War 2 (1940 - 1944) by Mons. Emmanuel Brincat
Senglea (Malta) during the World War 2 (1940 - 1944) by Monsignor Emmanuel Brincat
Viewers also liked (16)
Senglea (Malta) during the World War 2 (1940 - 1944) by Mons. Emmanuel Brincat
Senglea (Malta) during the World War 2 (1940 - 1944) by Mons. Emmanuel Brincat
Recently uploaded
Learn SQL from basic queries to Advance queries
Dive into the world of data analysis with our comprehensive guide on mastering SQL! This presentation offers a practical approach to learning SQL, focusing on real-world applications and hands-on practice. Whether you're a beginner or looking to sharpen your skills, this guide provides the tools you need to extract, analyze, and interpret data effectively.
Key Highlights:
Foundations of SQL: Understand the basics of SQL, including data retrieval, filtering, and aggregation.
Advanced Queries: Learn to craft complex queries to uncover deep insights from your data.
Data Trends and Patterns: Discover how to identify and interpret trends and patterns in your datasets.
Practical Examples: Follow step-by-step examples to apply SQL techniques in real-world scenarios.
Actionable Insights: Gain the skills to derive actionable insights that drive informed decision-making.
Join us on this journey to enhance your data analysis capabilities and unlock the full potential of SQL. Perfect for data enthusiasts, analysts, and anyone eager to harness the power of data!
#DataAnalysis #SQL #LearningSQL #DataInsights #DataScience #Analytics
一比一原版(爱大毕业证书)爱丁堡大学毕业证如何办理
毕业原版【微信:41543339】【(爱大毕业证书)爱丁堡大学毕业证】【微信:41543339】成绩单、外壳、offer、留信学历认证(永久存档真实可查)采用学校原版纸张、特殊工艺完全按照原版一比一制作(包括:隐形水印,阴影底纹,钢印LOGO烫金烫银,LOGO烫金烫银复合重叠,文字图案浮雕,激光镭射,紫外荧光,温感,复印防伪)行业标杆!精益求精,诚心合作,真诚制作!多年品质 ,按需精细制作,24小时接单,全套进口原装设备,十五年致力于帮助留学生解决难题,业务范围有加拿大、英国、澳洲、韩国、美国、新加坡,新西兰等学历材料,包您满意。
【我们承诺采用的是学校原版纸张(纸质、底色、纹路),我们拥有全套进口原装设备,特殊工艺都是采用不同机器制作,仿真度基本可以达到100%,所有工艺效果都可提前给客户展示,不满意可以根据客户要求进行调整,直到满意为止!】
【业务选择办理准则】
一、工作未确定,回国需先给父母、亲戚朋友看下文凭的情况,办理一份就读学校的毕业证【微信41543339】文凭即可
二、回国进私企、外企、自己做生意的情况,这些单位是不查询毕业证真伪的,而且国内没有渠道去查询国外文凭的真假,也不需要提供真实教育部认证。鉴于此,办理一份毕业证【微信41543339】即可
三、进国企,银行,事业单位,考公务员等等,这些单位是必需要提供真实教育部认证的,办理教育部认证所需资料众多且烦琐,所有材料您都必须提供原件,我们凭借丰富的经验,快捷的绿色通道帮您快速整合材料,让您少走弯路。
留信网认证的作用:
1:该专业认证可证明留学生真实身份
2:同时对留学生所学专业登记给予评定
3:国家专业人才认证中心颁发入库证书
4:这个认证书并且可以归档倒地方
5:凡事获得留信网入网的信息将会逐步更新到个人身份内,将在公安局网内查询个人身份证信息后,同步读取人才网入库信息
6:个人职称评审加20分
7:个人信誉贷款加10分
8:在国家人才网主办的国家网络招聘大会中纳入资料,供国家高端企业选择人才
留信网服务项目:
1、留学生专业人才库服务(留信分析)
2、国(境)学习人员提供就业推荐信服务
3、留学人员区块链存储服务
→ 【关于价格问题(保证一手价格)】
我们所定的价格是非常合理的,而且我们现在做得单子大多数都是代理和回头客户介绍的所以一般现在有新的单子 我给客户的都是第一手的代理价格,因为我想坦诚对待大家 不想跟大家在价格方面浪费时间
对于老客户或者被老客户介绍过来的朋友,我们都会适当给一些优惠。
选择实体注册公司办理,更放心,更安全!我们的承诺:客户在留信官方认证查询网站查询到认证通过结果后付款,不成功不收费!
Adjusting OpenMP PageRank : SHORT REPORT / NOTES
For massive graphs that fit in RAM, but not in GPU memory, it is possible to take
advantage of a shared memory system with multiple CPUs, each with multiple cores, to
accelerate pagerank computation. If the NUMA architecture of the system is properly taken
into account with good vertex partitioning, the speedup can be significant. To take steps in
this direction, experiments are conducted to implement pagerank in OpenMP using two
different approaches, uniform and hybrid. The uniform approach runs all primitives required
for pagerank in OpenMP mode (with multiple threads). On the other hand, the hybrid
approach runs certain primitives in sequential mode (i.e., sumAt, multiply).
Unleashing the Power of Data_ Choosing a Trusted Analytics Platform.pdf
In this guide, we'll explore the key considerations and features to look for when choosing a Trusted analytics platform that meets your organization's needs and delivers actionable intelligence you can trust.
一比一原版(CBU毕业证)卡普顿大学毕业证如何办理
CBU毕业证offer【微信95270640】《卡普顿大学毕业证书》《QQ微信95270640》学位证书电子版:在线制作卡普顿大学毕业证成绩单GPA修改(制作CBU毕业证成绩单CBU文凭证书样本)、卡普顿大学毕业证书与成绩单样本图片、《CBU学历证书学位证书》、卡普顿大学毕业证案例毕业证书制作軟體、在线制作加拿大硕士学历证书真实可查.
如果您是以下情况,我们都能竭诚为您解决实际问题:【公司采用定金+余款的付款流程,以最大化保障您的利益,让您放心无忧】
1、在校期间,因各种原因未能顺利毕业,拿不到官方毕业证+微信95270640
2、面对父母的压力,希望尽快拿到卡普顿大学卡普顿大学毕业证成绩单;
3、不清楚流程以及材料该如何准备卡普顿大学卡普顿大学毕业证成绩单;
4、回国时间很长,忘记办理;
5、回国马上就要找工作,办给用人单位看;
6、企事业单位必须要求办理的;
面向美国乔治城大学毕业留学生提供以下服务:
【★卡普顿大学卡普顿大学毕业证成绩单毕业证、成绩单等全套材料,从防伪到印刷,从水印到钢印烫金,与学校100%相同】
【★真实使馆认证(留学人员回国证明),使馆存档可通过大使馆查询确认】
【★真实教育部认证,教育部存档,教育部留服网站可查】
【★真实留信认证,留信网入库存档,可查卡普顿大学卡普顿大学毕业证成绩单】
我们从事工作十余年的有着丰富经验的业务顾问,熟悉海外各国大学的学制及教育体系,并且以挂科生解决毕业材料不全问题为基础,为客户量身定制1对1方案,未能毕业的回国留学生成功搭建回国顺利发展所需的桥梁。我们一直努力以高品质的教育为起点,以诚信、专业、高效、创新作为一切的行动宗旨,始终把“诚信为主、质量为本、客户第一”作为我们全部工作的出发点和归宿点。同时为海内外留学生提供大学毕业证购买、补办成绩单及各类分数修改等服务;归国认证方面,提供《留信网入库》申请、《国外学历学位认证》申请以及真实学籍办理等服务,帮助众多莘莘学子实现了一个又一个梦想。
专业服务,请勿犹豫联系我
如果您真实毕业回国,对于学历认证无从下手,请联系我,我们免费帮您递交
诚招代理:本公司诚聘当地代理人员,如果你有业余时间,或者你有同学朋友需要,有兴趣就请联系我
你赢我赢,共创双赢
你做代理,可以帮助卡普顿大学同学朋友
你做代理,可以拯救卡普顿大学失足青年
你做代理,可以挽救卡普顿大学一个个人才
你做代理,你将是别人人生卡普顿大学的转折点
你做代理,可以改变自己,改变他人,给他人和自己一个机会道银边山娃摸索着扯了扯灯绳小屋顿时一片刺眼的亮瞅瞅床头的诺基亚山娃苦笑着摇了摇头连他自己都感到奇怪居然又睡到上午点半掐指算算随父亲进城已一个多星期了山娃几乎天天起得这么迟在乡下老家暑假五点多山娃就醒来在爷爷奶奶嘁嘁喳喳的忙碌声中一骨碌爬起把牛驱到后龙山再从莲塘里采回一蛇皮袋湿漉漉的莲蓬也才点多点半早就吃过早餐玩耍去了山娃的家在闽西山区依山傍水山清水秀门前潺潺流淌的蜿蜒小溪一直都是山娃和小伙伴们盛试
Global Situational Awareness of A.I. and where its headed
You can see the future first in San Francisco.
Over the past year, the talk of the town has shifted from $10 billion compute clusters to $100 billion clusters to trillion-dollar clusters. Every six months another zero is added to the boardroom plans. Behind the scenes, there’s a fierce scramble to secure every power contract still available for the rest of the decade, every voltage transformer that can possibly be procured. American big business is gearing up to pour trillions of dollars into a long-unseen mobilization of American industrial might. By the end of the decade, American electricity production will have grown tens of percent; from the shale fields of Pennsylvania to the solar farms of Nevada, hundreds of millions of GPUs will hum.
The AGI race has begun. We are building machines that can think and reason. By 2025/26, these machines will outpace college graduates. By the end of the decade, they will be smarter than you or I; we will have superintelligence, in the true sense of the word. Along the way, national security forces not seen in half a century will be un-leashed, and before long, The Project will be on. If we’re lucky, we’ll be in an all-out race with the CCP; if we’re unlucky, an all-out war.
Everyone is now talking about AI, but few have the faintest glimmer of what is about to hit them. Nvidia analysts still think 2024 might be close to the peak. Mainstream pundits are stuck on the wilful blindness of “it’s just predicting the next word”. They see only hype and business-as-usual; at most they entertain another internet-scale technological change.
Before long, the world will wake up. But right now, there are perhaps a few hundred people, most of them in San Francisco and the AI labs, that have situational awareness. Through whatever peculiar forces of fate, I have found myself amongst them. A few years ago, these people were derided as crazy—but they trusted the trendlines, which allowed them to correctly predict the AI advances of the past few years. Whether these people are also right about the next few years remains to be seen. But these are very smart people—the smartest people I have ever met—and they are the ones building this technology. Perhaps they will be an odd footnote in history, or perhaps they will go down in history like Szilard and Oppenheimer and Teller. If they are seeing the future even close to correctly, we are in for a wild ride.
Let me tell you what we see.
办(uts毕业证书)悉尼科技大学毕业证学历证书原版一模一样
原版一模一样【微信:741003700 】【(uts毕业证书)悉尼科技大学毕业证学历证书】【微信:741003700 】学位证,留信认证(真实可查,永久存档)offer、雅思、外壳等材料/诚信可靠,可直接看成品样本,帮您解决无法毕业带来的各种难题!外壳,原版制作,诚信可靠,可直接看成品样本。行业标杆!精益求精,诚心合作,真诚制作!多年品质 ,按需精细制作,24小时接单,全套进口原装设备。十五年致力于帮助留学生解决难题,包您满意。
本公司拥有海外各大学样板无数,能完美还原海外各大学 Bachelor Diploma degree, Master Degree Diploma
1:1完美还原海外各大学毕业材料上的工艺:水印,阴影底纹,钢印LOGO烫金烫银,LOGO烫金烫银复合重叠。文字图案浮雕、激光镭射、紫外荧光、温感、复印防伪等防伪工艺。材料咨询办理、认证咨询办理请加学历顾问Q/微741003700
留信网认证的作用:
1:该专业认证可证明留学生真实身份
2:同时对留学生所学专业登记给予评定
3:国家专业人才认证中心颁发入库证书
4:这个认证书并且可以归档倒地方
5:凡事获得留信网入网的信息将会逐步更新到个人身份内,将在公安局网内查询个人身份证信息后,同步读取人才网入库信息
6:个人职称评审加20分
7:个人信誉贷款加10分
8:在国家人才网主办的国家网络招聘大会中纳入资料,供国家高端企业选择人才
My burning issue is homelessness K.C.M.O.
My burning issue is homelessness in Kansas City, MO
To: Tom Tresser
From: Roger Warren
一比一原版(Dalhousie毕业证书)达尔豪斯大学毕业证如何办理
原版定制【微信:41543339】【(Dalhousie毕业证书)达尔豪斯大学毕业证】【微信:41543339】成绩单、外壳、offer、留信学历认证(永久存档真实可查)采用学校原版纸张、特殊工艺完全按照原版一比一制作(包括:隐形水印,阴影底纹,钢印LOGO烫金烫银,LOGO烫金烫银复合重叠,文字图案浮雕,激光镭射,紫外荧光,温感,复印防伪)行业标杆!精益求精,诚心合作,真诚制作!多年品质 ,按需精细制作,24小时接单,全套进口原装设备,十五年致力于帮助留学生解决难题,业务范围有加拿大、英国、澳洲、韩国、美国、新加坡,新西兰等学历材料,包您满意。
【我们承诺采用的是学校原版纸张(纸质、底色、纹路),我们拥有全套进口原装设备,特殊工艺都是采用不同机器制作,仿真度基本可以达到100%,所有工艺效果都可提前给客户展示,不满意可以根据客户要求进行调整,直到满意为止!】
【业务选择办理准则】
一、工作未确定,回国需先给父母、亲戚朋友看下文凭的情况,办理一份就读学校的毕业证【微信41543339】文凭即可
二、回国进私企、外企、自己做生意的情况,这些单位是不查询毕业证真伪的,而且国内没有渠道去查询国外文凭的真假,也不需要提供真实教育部认证。鉴于此,办理一份毕业证【微信41543339】即可
三、进国企,银行,事业单位,考公务员等等,这些单位是必需要提供真实教育部认证的,办理教育部认证所需资料众多且烦琐,所有材料您都必须提供原件,我们凭借丰富的经验,快捷的绿色通道帮您快速整合材料,让您少走弯路。
留信网认证的作用:
1:该专业认证可证明留学生真实身份
2:同时对留学生所学专业登记给予评定
3:国家专业人才认证中心颁发入库证书
4:这个认证书并且可以归档倒地方
5:凡事获得留信网入网的信息将会逐步更新到个人身份内,将在公安局网内查询个人身份证信息后,同步读取人才网入库信息
6:个人职称评审加20分
7:个人信誉贷款加10分
8:在国家人才网主办的国家网络招聘大会中纳入资料,供国家高端企业选择人才
留信网服务项目:
1、留学生专业人才库服务(留信分析)
2、国(境)学习人员提供就业推荐信服务
3、留学人员区块链存储服务
→ 【关于价格问题(保证一手价格)】
我们所定的价格是非常合理的,而且我们现在做得单子大多数都是代理和回头客户介绍的所以一般现在有新的单子 我给客户的都是第一手的代理价格,因为我想坦诚对待大家 不想跟大家在价格方面浪费时间
对于老客户或者被老客户介绍过来的朋友,我们都会适当给一些优惠。
选择实体注册公司办理,更放心,更安全!我们的承诺:客户在留信官方认证查询网站查询到认证通过结果后付款,不成功不收费!
Levelwise PageRank with Loop-Based Dead End Handling Strategy : SHORT REPORT ...
Abstract — Levelwise PageRank is an alternative method of PageRank computation which decomposes the input graph into a directed acyclic block-graph of strongly connected components, and processes them in topological order, one level at a time. This enables calculation for ranks in a distributed fashion without per-iteration communication, unlike the standard method where all vertices are processed in each iteration. It however comes with a precondition of the absence of dead ends in the input graph. Here, the native non-distributed performance of Levelwise PageRank was compared against Monolithic PageRank on a CPU as well as a GPU. To ensure a fair comparison, Monolithic PageRank was also performed on a graph where vertices were split by components. Results indicate that Levelwise PageRank is about as fast as Monolithic PageRank on the CPU, but quite a bit slower on the GPU. Slowdown on the GPU is likely caused by a large submission of small workloads, and expected to be non-issue when the computation is performed on massive graphs.
Ch03-Managing the Object-Oriented Information Systems Project a.pdf
Object oriented system analysis and design
ViewShift: Hassle-free Dynamic Policy Enforcement for Every Data Lake
Dynamic policy enforcement is becoming an increasingly important topic in today’s world where data privacy and compliance is a top priority for companies, individuals, and regulators alike. In these slides, we discuss how LinkedIn implements a powerful dynamic policy enforcement engine, called ViewShift, and integrates it within its data lake. We show the query engine architecture and how catalog implementations can automatically route table resolutions to compliance-enforcing SQL views. Such views have a set of very interesting properties: (1) They are auto-generated from declarative data annotations. (2) They respect user-level consent and preferences (3) They are context-aware, encoding a different set of transformations for different use cases (4) They are portable; while the SQL logic is only implemented in one SQL dialect, it is accessible in all engines.
#SQL #Views #Privacy #Compliance #DataLake
一比一原版(UIUC毕业证)伊利诺伊大学|厄巴纳-香槟分校毕业证如何办理
UIUC毕业证offer【微信95270640】☀《伊利诺伊大学|厄巴纳-香槟分校毕业证购买》GoogleQ微信95270640《UIUC毕业证模板办理》加拿大文凭、本科、硕士、研究生学历都可以做,二、业务范围:
★、全套服务:毕业证、成绩单、化学专业毕业证书伪造《伊利诺伊大学|厄巴纳-香槟分校大学毕业证》Q微信95270640《UIUC学位证书购买》
(诚招代理)办理国外高校毕业证成绩单文凭学位证,真实使馆公证(留学回国人员证明)真实留信网认证国外学历学位认证雅思代考国外学校代申请名校保录开请假条改GPA改成绩ID卡
1.高仿业务:【本科硕士】毕业证,成绩单(GPA修改),学历认证(教育部认证),大学Offer,,ID,留信认证,使馆认证,雅思,语言证书等高仿类证书;
2.认证服务: 学历认证(教育部认证),大使馆认证(回国人员证明),留信认证(可查有编号证书),大学保录取,雅思保分成绩单。
3.技术服务:钢印水印烫金激光防伪凹凸版设计印刷激凸温感光标底纹镭射速度快。
办理伊利诺伊大学|厄巴纳-香槟分校伊利诺伊大学|厄巴纳-香槟分校毕业证offer流程:
1客户提供办理信息:姓名生日专业学位毕业时间等(如信息不确定可以咨询顾问:我们有专业老师帮你查询);
2开始安排制作毕业证成绩单电子图;
3毕业证成绩单电子版做好以后发送给您确认;
4毕业证成绩单电子版您确认信息无误之后安排制作成品;
5成品做好拍照或者视频给您确认;
6快递给客户(国内顺丰国外DHLUPS等快读邮寄)
-办理真实使馆公证(即留学回国人员证明)
-办理各国各大学文凭(世界名校一对一专业服务,可全程监控跟踪进度)
-全套服务:毕业证成绩单真实使馆公证真实教育部认证。让您回国发展信心十足!
(详情请加一下 文凭顾问+微信:95270640)欢迎咨询!的鬼地方父亲的家在高楼最底屋最下面很矮很黑是很不显眼的地下室父亲的家安在别人脚底下须绕过高楼旁边的垃圾堆下八个台阶才到父亲的家很狭小除了一张单人床和一张小方桌几乎没有多余的空间山娃一下子就联想起学校的男小便处山娃很想笑却怎么也笑不出来山娃很迷惑父亲的家除了一扇小铁门连窗户也没有墓穴一般阴森森有些骇人父亲的城也便成了山娃的城父亲的家也便成了山娃的家父亲让山娃呆在屋里做作业看电视最多只能在门口透透气间
一比一原版(UofS毕业证书)萨省大学毕业证如何办理
原版定制【微信:41543339】【(UofS毕业证书)萨省大学毕业证】【微信:41543339】成绩单、外壳、offer、留信学历认证(永久存档真实可查)采用学校原版纸张、特殊工艺完全按照原版一比一制作(包括:隐形水印,阴影底纹,钢印LOGO烫金烫银,LOGO烫金烫银复合重叠,文字图案浮雕,激光镭射,紫外荧光,温感,复印防伪)行业标杆!精益求精,诚心合作,真诚制作!多年品质 ,按需精细制作,24小时接单,全套进口原装设备,十五年致力于帮助留学生解决难题,业务范围有加拿大、英国、澳洲、韩国、美国、新加坡,新西兰等学历材料,包您满意。
【我们承诺采用的是学校原版纸张(纸质、底色、纹路),我们拥有全套进口原装设备,特殊工艺都是采用不同机器制作,仿真度基本可以达到100%,所有工艺效果都可提前给客户展示,不满意可以根据客户要求进行调整,直到满意为止!】
【业务选择办理准则】
一、工作未确定,回国需先给父母、亲戚朋友看下文凭的情况,办理一份就读学校的毕业证【微信41543339】文凭即可
二、回国进私企、外企、自己做生意的情况,这些单位是不查询毕业证真伪的,而且国内没有渠道去查询国外文凭的真假,也不需要提供真实教育部认证。鉴于此,办理一份毕业证【微信41543339】即可
三、进国企,银行,事业单位,考公务员等等,这些单位是必需要提供真实教育部认证的,办理教育部认证所需资料众多且烦琐,所有材料您都必须提供原件,我们凭借丰富的经验,快捷的绿色通道帮您快速整合材料,让您少走弯路。
留信网认证的作用:
1:该专业认证可证明留学生真实身份
2:同时对留学生所学专业登记给予评定
3:国家专业人才认证中心颁发入库证书
4:这个认证书并且可以归档倒地方
5:凡事获得留信网入网的信息将会逐步更新到个人身份内,将在公安局网内查询个人身份证信息后,同步读取人才网入库信息
6:个人职称评审加20分
7:个人信誉贷款加10分
8:在国家人才网主办的国家网络招聘大会中纳入资料,供国家高端企业选择人才
留信网服务项目:
1、留学生专业人才库服务(留信分析)
2、国(境)学习人员提供就业推荐信服务
3、留学人员区块链存储服务
→ 【关于价格问题(保证一手价格)】
我们所定的价格是非常合理的,而且我们现在做得单子大多数都是代理和回头客户介绍的所以一般现在有新的单子 我给客户的都是第一手的代理价格,因为我想坦诚对待大家 不想跟大家在价格方面浪费时间
对于老客户或者被老客户介绍过来的朋友,我们都会适当给一些优惠。
选择实体注册公司办理,更放心,更安全!我们的承诺:客户在留信官方认证查询网站查询到认证通过结果后付款,不成功不收费!
做(mqu毕业证书)麦考瑞大学毕业证硕士文凭证书学费发票原版一模一样
原版定制【Q微信:741003700】《(mqu毕业证书)麦考瑞大学毕业证硕士文凭证书》【Q微信:741003700】成绩单 、雅思、外壳、留信学历认证永久存档查询,采用学校原版纸张、特殊工艺完全按照原版一比一制作(包括:隐形水印,阴影底纹,钢印LOGO烫金烫银,LOGO烫金烫银复合重叠,文字图案浮雕,激光镭射,紫外荧光,温感,复印防伪)行业标杆!精益求精,诚心合作,真诚制作!多年品质 ,按需精细制作,24小时接单,全套进口原装设备,十五年致力于帮助留学生解决难题,业务范围有加拿大、英国、澳洲、韩国、美国、新加坡,新西兰等学历材料,包您满意。
【业务选择办理准则】
一、工作未确定,回国需先给父母、亲戚朋友看下文凭的情况,办理一份就读学校的毕业证【Q微信741003700】文凭即可
二、回国进私企、外企、自己做生意的情况,这些单位是不查询毕业证真伪的,而且国内没有渠道去查询国外文凭的真假,也不需要提供真实教育部认证。鉴于此,办理一份毕业证【微信741003700】即可
三、进国企,银行,事业单位,考公务员等等,这些单位是必需要提供真实教育部认证的,办理教育部认证所需资料众多且烦琐,所有材料您都必须提供原件,我们凭借丰富的经验,快捷的绿色通道帮您快速整合材料,让您少走弯路。
留信网认证的作用:
1:该专业认证可证明留学生真实身份
2:同时对留学生所学专业登记给予评定
3:国家专业人才认证中心颁发入库证书
4:这个认证书并且可以归档倒地方
5:凡事获得留信网入网的信息将会逐步更新到个人身份内,将在公安局网内查询个人身份证信息后,同步读取人才网入库信息
6:个人职称评审加20分
7:个人信誉贷款加10分
8:在国家人才网主办的国家网络招聘大会中纳入资料,供国家高端企业选择人才
【关于价格问题(保证一手价格)】
我们所定的价格是非常合理的,而且我们现在做得单子大多数都是代理和回头客户介绍的所以一般现在有新的单子 我给客户的都是第一手的代理价格,因为我想坦诚对待大家 不想跟大家在价格方面浪费时间
对于老客户或者被老客户介绍过来的朋友,我们都会适当给一些优惠。
原版制作(Deakin毕业证书)迪肯大学毕业证学位证一模一样
学校原件一模一样【微信:741003700 】《(Deakin毕业证书)迪肯大学毕业证学位证》【微信:741003700 】学位证,留信认证(真实可查,永久存档)原件一模一样纸张工艺/offer、雅思、外壳等材料/诚信可靠,可直接看成品样本,帮您解决无法毕业带来的各种难题!外壳,原版制作,诚信可靠,可直接看成品样本。行业标杆!精益求精,诚心合作,真诚制作!多年品质 ,按需精细制作,24小时接单,全套进口原装设备。十五年致力于帮助留学生解决难题,包您满意。
本公司拥有海外各大学样板无数,能完美还原。
1:1完美还原海外各大学毕业材料上的工艺:水印,阴影底纹,钢印LOGO烫金烫银,LOGO烫金烫银复合重叠。文字图案浮雕、激光镭射、紫外荧光、温感、复印防伪等防伪工艺。材料咨询办理、认证咨询办理请加学历顾问Q/微741003700
【主营项目】
一.毕业证【q微741003700】成绩单、使馆认证、教育部认证、雅思托福成绩单、学生卡等!
二.真实使馆公证(即留学回国人员证明,不成功不收费)
三.真实教育部学历学位认证(教育部存档!教育部留服网站永久可查)
四.办理各国各大学文凭(一对一专业服务,可全程监控跟踪进度)
如果您处于以下几种情况:
◇在校期间,因各种原因未能顺利毕业……拿不到官方毕业证【q/微741003700】
◇面对父母的压力,希望尽快拿到;
◇不清楚认证流程以及材料该如何准备;
◇回国时间很长,忘记办理;
◇回国马上就要找工作,办给用人单位看;
◇企事业单位必须要求办理的
◇需要报考公务员、购买免税车、落转户口
◇申请留学生创业基金
留信网认证的作用:
1:该专业认证可证明留学生真实身份
2:同时对留学生所学专业登记给予评定
3:国家专业人才认证中心颁发入库证书
4:这个认证书并且可以归档倒地方
5:凡事获得留信网入网的信息将会逐步更新到个人身份内,将在公安局网内查询个人身份证信息后,同步读取人才网入库信息
6:个人职称评审加20分
7:个人信誉贷款加10分
8:在国家人才网主办的国家网络招聘大会中纳入资料,供国家高端企业选择人才
Enhanced Enterprise Intelligence with your personal AI Data Copilot.pdf
Recently we have observed the rise of open-source Large Language Models (LLMs) that are community-driven or developed by the AI market leaders, such as Meta (Llama3), Databricks (DBRX) and Snowflake (Arctic). On the other hand, there is a growth in interest in specialized, carefully fine-tuned yet relatively small models that can efficiently assist programmers in day-to-day tasks. Finally, Retrieval-Augmented Generation (RAG) architectures have gained a lot of traction as the preferred approach for LLMs context and prompt augmentation for building conversational SQL data copilots, code copilots and chatbots.
In this presentation, we will show how we built upon these three concepts a robust Data Copilot that can help to democratize access to company data assets and boost performance of everyone working with data platforms.
Why do we need yet another (open-source ) Copilot?
How can we build one?
Architecture and evaluation
Recently uploaded (20)
Influence of Marketing Strategy and Market Competition on Business Plan
Influence of Marketing Strategy and Market Competition on Business Plan
Unleashing the Power of Data_ Choosing a Trusted Analytics Platform.pdf
Unleashing the Power of Data_ Choosing a Trusted Analytics Platform.pdf
Global Situational Awareness of A.I. and where its headed
Global Situational Awareness of A.I. and where its headed
Data_and_Analytics_Essentials_Architect_an_Analytics_Platform.pptx
Data_and_Analytics_Essentials_Architect_an_Analytics_Platform.pptx
Levelwise PageRank with Loop-Based Dead End Handling Strategy : SHORT REPORT ...
Levelwise PageRank with Loop-Based Dead End Handling Strategy : SHORT REPORT ...
Ch03-Managing the Object-Oriented Information Systems Project a.pdf
Ch03-Managing the Object-Oriented Information Systems Project a.pdf
ViewShift: Hassle-free Dynamic Policy Enforcement for Every Data Lake
ViewShift: Hassle-free Dynamic Policy Enforcement for Every Data Lake
Enhanced Enterprise Intelligence with your personal AI Data Copilot.pdf
Enhanced Enterprise Intelligence with your personal AI Data Copilot.pdf
Chart (2)
- 1. 13-17 18-24 25-34 35-44 45-54 55-64 65+ 0 10 20 30