1. Topic:To know how the insurance brokerage makes customers aware about their
products and also how they design their distribution channels
CHAPTER FOUR
ANALYSIS AND DISCUSSION OF FINDINGS
4.0 Introduction.
This chapter deals with the presentation of data, discussion and analysis of the data collected
from the field. It provides detailed information on the findings.
4.1 Background of Respondents
The sample size for the study is composed of six top Insurance Brokerage Firms sampled from
over 12 Insurance Brokerage Firms in Accra Metropolitan Area.
Table 4.1: Age and Gender of Respondents
Gender
Age Male Female Percentage
25-35 - - -
36-46 5 1 83
47-57 1 - 17
58+ - - -
Total 6 1 100
Source: Field Data, 2015
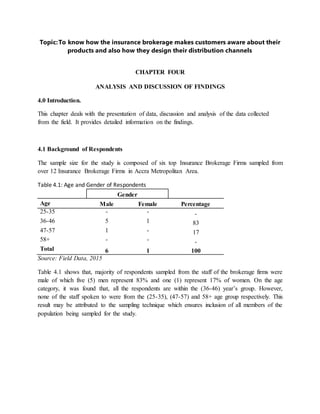
Table 4.1 shows that, majority of respondents sampled from the staff of the brokerage firms were
male of which five (5) men represent 83% and one (1) represent 17% of women. On the age
category, it was found that, all the respondents are within the (36-46) year’s group. However,
none of the staff spoken to were from the (25-35), (47-57) and 58+ age group respectively. This
result may be attributed to the sampling technique which ensures inclusion of all members of the
population being sampled for the study.
2. Figure: ……… Level ofEducation
Source: Field Data, 2015
On the level of education of the respondents sampled, it was found out that, most of them were
holders of First Degree as shown in Table 4.1. This is attributed to the fact that, most of
brokerage insurance firms recruit staff holding First Degree as Officers whilst most their
representatives selling life products for them are Senior Secondary School Certificate of
Education (SSSCE) holders. These staff required a higher level of education to operate and do
the kind of work they may be asked to do. Those in this area with Fist Degree constitute 89%.
The only female respondent in the sample had Master’s Degree.
Table 4.2: How did you start with the general business
Responses Frequency Percentage
Contacts and referrals 1 17
It started as a small office with few sales officers 1 17
It started with few sales in the beginning 2 33
We started with friends and companies we knew in addition
to members in the Anglican Church
2 33
0
10
20
30
40
50
60
70
80
90
100
1st Degree Masters Total
Frequency 5 1 6
Percentage 83 17 100
83
17
100
Frequency
3. Total 6 100
Source: Field Data, 2015
From Table 4.2, most the brokerage insurance companies started on the small scale in the
beginning through contacts and referrals. Some of the brokerage firms also had their clients
through their church members for example those in the Anglican Church.
Table 4.3: What do you insure under the general business
Responses Frequency Percentage
Fire, property, and allied peril, travel insurance, personal
accident cover, vehicle insurance
1 17
Fire, property, and allied peril, travel insurance, personal
accident cover, vehicle insurance and marine insurance
1 17
Fire, Theft, Marine, Allied perils bonds 2 33
Motor, Non Motors, Bonds 2 33
Total 6 100
Source: Field Data, 2015
Analysing Table 4.3 above, majority of the brokerage insurance companies insure under their
general business their clients against; fire, property and allied peril. They also insure against
travel insurance, personal accident and vehicle theft. Marine, Motor, and Non Motor as well as
Bonds are also part of their products they sell to clients.
Table 4.4: What other products do you offer alongside the general business
Responses Frequency Percentage
Life assurance products 1 17
Life business and consultancy in accounting 2 33
Life Policy 1 17
Life Product 1 17
We have Life office that is into the sale of Life Insurance
policy
1 17
Total 6 100
Source: Field Data, 2015
Table 4.4 showed that, all the brokerage companies we talked to sell in addition to their general
business Life Insurance and some adding consulting in accounting.
4. Table 4.5: Why did you enter into the Life brokerage business? Is it profitable
Responses Frequency Percentage
It all started in 2008 and it is profitable 1 17
It is a foresight my boss saw, The general business was not
profitable and so we decided to go for the Life business that
generates a lot of income monthly. It is profitable
1 17
Life business is one area you are assured of regular income and
the market is virgin and so you are assured of regular income.
1 17
To expand the Business, Yes it is Profitable 3 50
Total 6 100
Source: Field Data, 2015
The table above described why the samples brokerage insurance companies we talked to decide
to enter into the Life Brokerage business. Responses from our respondents revealed that,
initially, the general insurance business was not fetching them enough profit hence they decided
to add the brokerage to the general business. It is also a strategy to expand their business. They
have all agreed that the Life insurance business is very profitable and income is regular.
Table 4.5: Were you approached by a life company or you went to negotiate with them to
set up your life brokerage
Responses Frequency Percentage
Negotiate with some other Life Insurance company 2 33
The idea was to set up an insurance company initially but did not
have the full requirements in terms of financial deposits, so we
were advised to set up a brokerage. Based on this we went into
negotiations with Enterprise Life
1 17
We negotiated and purchased them to sell 1 17
We were approached by an Insurance Company to enter into the
brokerage business
1 17
We were approached by Enterprise Life Company Ltd. We were
the first to sign broker business with Enterprise Life
1 17
Total 6 100
Source: Field Data, 2015
Table 4.5 revealed that, some brokerage firms said they were more or less approached by an
insurance company initially to enter into the brokerage business. However, some said they went
into a negotiation with the insurance companies such as Enterprise Life Insurance Company and
even became first to sign brokerage business with them.
5. Table 4.6: How many Life Insurance Clients do you have
Number of Clients Frequency Percentage
112 Clients 1 17
120 Clients 1 17
123 Clients 1 17
127 Clients 1 17
1500 Clients 1 17
64000 Clients 1 17
Total 6 100
Source: Field Data, 2015
The table above showed the various numbers of Life Insurance Clients the brokerage firms we
talked to have. Number of Clients ranges from 112 to 64,000. According to the respondents,
these numbers are the active members on their list that they regularly deal with.
Table 4.7: What kind of arrangement do you have with the insurance company? Do you
only sell or you are part of the administrative procedure?
Responses Frequency Percentage
We only sell the product 3 50
We only sell the products 1 17
We sell products and facilitate claim payments 1 17
We sell products but in addition we give suggestions aimed at
improving the system
1 17
Total 6 100
Source: Field Data, 2015
From the table above, all (100%) of the brokerage firms said arrangement they have with the
Insurance Companies is to sell their products. However, some said they helped facilitate claim
payments and give advice and suggestion that will enhance their performance.
6. Table 4.8: As a broker what do you do to enhance the selling of Life products?
Responses Frequency Percentage
Training representatives, Promotions, Presentations to
Corporate Organizations
2 33
Training of representatives 1 17
Training of representatives, Advertisement, Promotions and
use of recruitment agencies
2 33
Training of representatives, Advertisement, Promotions and
use of recruitment agencies
1 17
Total 6 100
Source: Field Data, 2015
The above table showed that the brokerage firms does; training of their representatives, doing
advertisement, promotional activities and presentations to corporate organizations about their
products to enhance the selling of Life products.
Figure 2: What methods do you use to reach your customers?
Source: Field Data, 2015
The figure above showed the various methods the brokerage firms used to get to their customers.
Almost of them used Advertisement, Social Media, and Direct Sale of products as well as
marketing strategies to get to their customer.
17%
33%
17%
33%
Advertisement, Social
Media
Advertising, Direct
Sales/Marketing, Social
Media
Direct Sale/Makerting,
Social Media
Direct Sales/Marketing
7. Table 4.8: Do the premiums clients pay come to you directly or to the life assurance
company?
Responses Frequency Percentage
To the insurance company 1 17
To the Insurance Company 1 17
To the Life Assurance Company 1 17
To the Life Insurance Company and we receive commission 3 50
Total 6 100
Source: Field Data, 2015
In the Insurance business, the Client pay premium regularly. The question is who in the chain
gets the premium? According to the respondents, the premium is paid to the Life Insurance
Companies directly whilst they the Brokerage firms in turn receive a commission from the Life
Insurance Companies. This is shown in the table above.
Figure 3: Are you happy with the commission that is paid to you?
Source: Field Data, 2015
17%
83%
0
10
20
30
40
50
60
70
80
90
Yes No
Percentage
8. The figure above revealed that, 83% of the respondents were not happy with the amount paid to
them as commission. However, only 17% said they are happy with the amount given to the as
commission. The reasons for these are specified the next table below.
Table 4.9: Why people are not happy about the commission given to them
Responses Frequency Percent
Commission expectations are not met but we do not have
control we are still working to improve it
1 20
Commission expectations are sometimes not met but because
we do not have control we are still working on improving it
2 40
We have sold so many policies but the number of premium
paying policies is not too good
2 40
Total 5 100
Source: Field Data, 2015
Respondents were not happy with the amount given to them as a commission despite the hard
work they do for their Insurance Companies. Some of the reasons are; commission expectations
are not met but they do not have any control, they have sold many policies but the number of
premium paying policies is not too good this formed about 80% of the respondents.
Table 4.10: What problems are associatedwith your commissions? Is it positive?
Responses Frequency Percent
It fluctuate and so affects predictions based on production, The
client complain to us that they have money but deductions are
not met, Accessibility to banks, The life company's offices are
not easily accessible. Negative
1 17
It fluctuates not positive 1 17
It fluctuates not positive 2 33
Poor Inception of premium paying policies. It is negative 2 33
Total 6 100
Source: Field Data, 2015
The table above described the problems associated with commissions. From the study, 50% of
insurance brokerage firms said the commission they get fluctuates but still they see it as positive.
The other 50% also said though the commission fluctuates, that is not all accessibility to the
9. offices of the Life Insurance Offices is not easy. They also said there is the problem of poor
inception of premium payment by the Life Insurance Companies.
Table 4.11: What suggestions can you give to solve the poor commission problem?
Responses Frequency Percentage
Life Assurance must process commissions immediately after
payment of premiums, Life Assurance Companies can give
salaries to agents to augment their commissions
2 33
The rate for calculating the benefit must be attractive so that we
can sell more policies
2 33
There should be enhancement of the source collection points, It
should be possible to sell to all banks including savings and
loans and Premium Administration Officers should be more
proactive in collecting more premiums
1 17
We must have an insight as to how commission calculation is
done to remove doubts, The rates used for calculation should be
increased to make the selling of life policies attractive,
commission payments should be for life and not five years
duration to make the job attractive
1 17
Total 6 100
Source: Field Data, 2015
From table 4.11, various reasons were given to solve the poor commission give to them. Most of
them suggest changing the calculating formula for the commission to enhance their premium.
Some also suggested the premium should be paid for life the reps so as to make the job
attractive. The issue of paying premium promptly is also what should be considered. They
suggest that, Insurance Companies should consider paying salary to their agents to augment their
commissions.
Table 4.12: What criteria do you use in recruiting reps?
Criteria used Frequency Percentage
Age 25 year old and Senior Secondary School Certificate 1 17
Educational level .Minimum level Senior Secondary School
Certificate and the applicant should be 25 years and above
1 17
From Senior Secondary School Certificate and above, Age
qualification 25 yrs and above
1 17
10. Senior Secondary School Certificate and above 3 50
Total 6 100
Source: Field Data, 2015
From the table above, criteria used in recruiting representatives of the Insurance Brokerage Firms
are by mostly educational and age. From the study, 50% mentioned age from 25 years and above
with Senior Secondary School Certificate as an added advantage. The other half said Senior
Secondary School Certificate higher not stressing on age limit.
Table 4.13: Reasons why it is not easy to attract Reps
Responses Frequency Percent
Most of them do not see future in commission jobs, They see
their future in basic salary jobs, Most reps want to work in an
office as against becoming a sales rep
1 20
Reps in brokerage lack the sense of belongingness because they
feel the brokerage does not own the product
1 20
Reps in brokerages have friends in life companies and so there is
always bickering and comparison. Reps in brokerage lack the
sense of belongingness. This is because they feel that the
brokerage does not own the product
1 20
Some people come thinking it is a salary job 2 40
Total 5 100
Source: Field Data, 2015
The Insurance Brokers said it is difficult to recruit their reps to do their sale activities. They gave
reasons why it not easy to attract reps in table 4.13 above. The first reason is that, most of the
reps do not see the brokerage job as a job that can take them into the future. They were thinking
of getting a job that can pay them salary. They prefer working in the office than working as a
sales representative. Most of them think they are working for the Life Insurance companies and
that the brokerages do not own the product they selling. Sense of belongingness is not there.
About 40% of them also come into the job thinking it is a salary job initially. Later they abandon
the sales job.
Table 4.14: Who provides the training for your insurance officers/agents?
Responses Frequency Percent
Both the Life Company and my brokerage train the reps 1 17
Managers of the Life Assurance Company 2 33
The Life Insurance Company 2 33
11. Trained Managers and Officers from the Insurance Companies 1 17
Total 6 100
Source: Field Data, 2015
The study showed that, Life Insurance Companies and the some officers from the Brokerage
firms helped trained the Insurance Brokerage representatives before they embark on their sale
policy adventure. This is showed in Table 4.14 above.
Table 4.15: What is the impact of the training?
Responses Frequency Percent
Effective in increase the performance of the reps 1 17
Improve performance and skills of our reps 1 17
Improve work performance, Improve professionalism 2 33
It has a direct impact on the sales force. If no training is done
the reps become stale.
1 17
Positive in the sense that, it helps the reps have confidence in
what they are doing and be able to face clients in selling the
product
1 17
Total 6 100
Source: Field Data, 2015
The revealed in table 14.15 that, training the sale reps is very effective since it improve the
performance, skills and professionalism of the reps. It gives them confidence in what they do and
can face Clients in selling the products.
Table 14.16: How many training programs do you have in a year for your sales team?
Number of Times Frequency Percentage
11 times 1 17
36 times 1 17
48 times 1 17
56 times 1 17
98 times 1 17
162 times 1 17
Total 6 100
Source: Field Data, 2015
12. To keep the reps of the Insurance Brokerage firms in shape, the Brokerage firms organize
various training programs for the reps. From the study in table 14.16 above, as many as between
11 to 162 training schedules were organized for the reps within are year.
Table 14.17: How many times do you incentivize your team in a year? Give reasons?
Responses Frequency Percentage
16 times in a year 1 17
As and when necessary to drive sales 1 17
Monthly 3 50
Quarterly, the top10 reps receive awards with the top person
receiving 300 Ghana Cedis. Also the Life Company supports my
brokerage by organizing a competition for all the other
brokerages they deal with. The competition is for the top 50 reps
and they are awarded in a conference. The best five are taken
outside the country as part of their award package
1 17
Total 6 100
Source: Field Data, 2015
The study showed in table 14.17 showed various times that the Insurance Brokerage Firms
incentivize their reps. Almost 50% of the respondents said they do that monthly. Some said they
do that quarterly and number of times in a year. Some of the reps are even sent outside Ghana as
package for their incentives.
Table 14.18: Do you sell your products only through your sales reps? If no give
further details?
Responses Frequency Percentage
Yes, through sale agents 2 33
No, through sales managers, branch manager and also
referrals from management
4 67
Total 6 100
Source: Field Data, 2015
The table above showed whether the Insurance Brokerage Firms sells their products only through
their sales representatives. For respondents we talked to, 33% said yes they only sell their
products through their reps whilst 67% said no, not only through their reps but through their
branch managers, sales managers and through referrals from management as well.
13. Table 14.19: What are the challenges in selling Life Assurance products?
Responses Frequency Percentage
Fall of the Cedis, High Rep Turnover, Marketing Life
Products is very tough, Mistrust of the Life Insurance
Policies
2 33
Financial challenges, Mistrust of Life Companies, Wrong
perception about claims that it be paid when the time is due
would no
2 33
Low incomes and because of this purchasing power is very
small. Bad economy. Low level of education
1 17
Rate of penetration is low generally in Ghana and Africa.
More education of the populace is needed to be done by the
companies and the commission
1 17
Total 6 100
Source: Field Data, 2015
There various challenges in selling Life Insurance policy as a product. The study has shown
some of these challenges as follow; fall of the cedi, high rep turnover, marketing the Life product
is very tough at times and mistrust of the Life Product by some Clients. Most Clients do not trust
that their premium will be paid when their time is due. Also low income level of workers does
affect their purchasing power. Low level of education of Clients is another factor. Hence more
education of the populace is needed by Life insurance Companies and the Insurance Commission
to understand the importance of insurance. These are illustrated in the table above.