2.1 Overview
In ourrapidly advancing technological area, the large volumes of accumulated data,
on a daily basis, yield many benefits in different areas of our everyday lives
including finance, medicine, and industry, among others [1e3]. These large-scale
datasets are referred to as big data. The big data are characterized by four dimen-
sions, namely the volume, the velocity, the veracity, and the variety [1e6]. The speed
of the daily generated data, the amounts of collected data, the different types of
collected data, and the biases that are introduced during the data collection process
are the fundamental characteristics of the big data against the traditional datasets,
which are only characterized by one dimension, i.e., their volume. The big data in
medicine can improve the patient care through the enhancement of the clinical
decision-making process, as well as enhance the statistical power of the clinical
research studies yielding more accurate outcomes and powerful prediction models
[1e6]. Furthermore, the big data can further enhance the development of effective
patient stratification methods toward the identification of sensitive population
subgroups, as well as provide better insights on large population groups toward
the development of new public health policies and targeted therapeutic treatments.
There are many types of big data in medicine. These types of data vary from
biosignals and medical images to laboratory tests and omics data. The biosignals
are produced by the electrical activity that arises from the biological function of
the organs in the human body. Examples of the most common types of biosignals
include the electrocardiogram (ECG) [7], which records the electrical activity as a
result of the heart’s depolarization and repolarization function, the electroencephalo-
gram (EEG) [8], which records the changes in the electrical activity as a result of the
neural activation (i.e., the electrical field from the extracellular currents), along with
the magnetoencephalogram (MEG) [9], which measures the changes in the ensuing
magnetic field (from the intracellular currents), the electromyogram (EMG) [10],
which records the changes in the electrical activity as a result of the muscles contrac-
tion, the electrooculogram (EOG) [11], which records the corneoretinal potential as
a result of the eye movement, etc. The biosignals yield high temporal information
regarding a disease’s onset and progress, with numerous applications in medical
conditions and diseases that vary from amnesia and schizophrenia to heart failure,
myopathy, and Parkinson’s disease [5].
The medical images comprise another type of medical data with significant
importance in clinical diagnosis and screening procedures. Computerized tomogra-
phy (CT) [12] scans, and magnetic resonance imaging (MRI) [13] scans, can provide
detailed insight on the anatomic and tissue characteristics of different body parts,
yielding high spatial information, and are useful in the detection of malignancies
and other disorders. Furthermore, the positron emission tomography (PET) [14]
scans, the single-photon emission tomography (SPECT) [15] scans, and the func-
tional magnetic resonance imaging (fMRI) [16] scans provide additional informa-
tion regarding the biological and physiological operations, i.e., the metabolic
processes, at a molecular level, as well as the brain activations under specific
20 CHAPTER 2 Types and sources of medical and other related data
3.
physical and mentaltasks. Furthermore, ultrasound [17] and photoacoustic [18]
images are fast, nonionizing, real-time methods that are based on acoustic proper-
ties, having numerous applications in echocardiography, obstetric ultrasonography
(US), intravascular US, and duplex US, among others. Spectroscopy-based methods,
such as the functional near-infrared spectroscopy (fNIRS) [19], can also shed light
into the measurement of the metabolic rate of oxygen consumption, which indicates
a neural activation, similar to the fMRI.
The field of omics constitutes another vast domain of medical data with
numerous subfields, such as the fields of genomics [20], lipidomics [21], proteomics
[22], metabolomics [23], microbiomics [24], epigenomics [25], and transcriptomics
[26], among others. The omics data can be generated from high-throughput
next-generation sequencing (NGS) technologies [27], such as ribonucleic acid
(RNA)-sequence analysis [28], mass spectrometry (MS) [29], and thin-layer
chromatography (TLC) [30], which are able to analyze the proteins, lipids, transcrip-
tomes, metabolic profiles of the biological cells, microorganisms in the tissues,
pathological factors, and even whole human genome. The RNA-sequence analyzers
are able to capture all the single cellebased (or even group-based) RNA molecules
(i.e., the whole transcriptome). In addition, MS technology is able to reveal the struc-
tural and functional characteristics of proteins, as well as identify the lipids and their
involvements in cell functionality. Omics can be used to study a variety of
molecular-level functions, including the examination of bacteria and fungi on the
tissues and organs, the interactions between the proteins, the detection of patholog-
ical factors and metabolic effects in degenerative and chronic diseases, and gene
expression analysis, among others.
The laboratory tests along with the medical claims and the subscribed medica-
tions can offer a powerful basis for understanding the underlying mechanisms of
a virus and detecting various pathological conditions in tissue specimens. The
most common laboratory tests include the hematological tests, the serological tests,
the skin tests, the histopathological tests, the immunological tests, the endocrine
function tests, and the coagulation tests, among others. Straightforward methods,
such as microscopic analysis [31], fluoroscopy [32], immunocytochemistry (ICH)
[33], and immunohistochemistry (IHC) [34], are used to analyze the tissue and blood
samples. Each test offers a unique insight on a medical condition or a disease toward
the detection of blood clotting disorders, tumors, anemia, diabetes, fungal infections,
autoimmune disorders, skin cancer, allergies, inflammatory disorders, and endocrine
dysfunctions, among many others.
The sources of medical data are many. With the growing number of large volumes
of daily generated data from health sensors, medical images, laboratory tests, elec-
tronic patient records, patient registries (PRs), clinical and pharmaceutical claims,
and genome registries, the estimated amount of data is expected to overcome the zetta-
byte (1021 gigabytes) and even the yottabyte (1024 gigabytes) [1,35]. The medical data
acquisition process is often conducted according to international standards and proto-
cols for each type of medical data. For example, in signal acquisition, well-known
international standards are used for the placement of surface electrodes, such as the
2.1 Overview 21
4.
12-lead placement [7,36]for ECG signal acquisition and the International “10e20”
system (and “10e5” system) [37] for EEG signal acquisition. In laboratory tests,
hemodynamic, coagulation, serological, and immunoassay analyzers are most
commonly used for measuring biochemical (e.g., blood pressure, blood clotting
time) and pathological factors (e.g., the presence of antigens in the antibodies), as
well as analyzing tissue specimens (e.g., for skin cancer, endocrine disorders), under
different measurement units. Medical image acquisition protocols are also used for the
reconstruction of MRI, CT, fMRI, PET, and SPECT images, such as the filtered back-
projection (FBP) algorithm [38], the family of the iterative reconstruction algorithms,
such as the algebraic reconstruction algorithm [39], and the iterative sparse asymptotic
minimum variance (SAMV) algorithm [40], as well as the universal backprojection
algorithm [41] for ultrasound imaging reconstruction, toward the examination of
tissues and organs for tumors and other disorders. In the field of omics, standard
methods, such as the microarray analysis [42], the RNA-sequencing analysis [28],
MS [29], TLC [30], along with the high-throughput NGS technology [27], are widely
used in omics to study the proteins interactions, the genetic profiles, and metabolic
effects of different viruses, lipids, whole transcriptome, and genetic profiles of the
human microbiome, among many others.
A research-oriented source of medical data with high clinical significance is the
cohorts. Cohort studies are special types of observational studies [43] that are used to
examine a disease’s origins and the effects of the population characteristics [44]. The
longitudinal cohort studies are observational studies that involve the repetitive
collection of patient data over long (or short) periods of time and are able to provide
deeper insight on the disease progress over time with increased accuracy, over-
coming recall biases [43,44]. In general, a cohort study can use either retrospective
or prospective data. The retrospective cohort studies make use of data that have been
already collected with the purpose of identifying the association between the causes
(symptoms) and the disease’s outcomes [45]. On the other hand, the temporal dimen-
sion that is introduced by the prospective cohort studies (i.e., the follow-up data) can
reveal significant associations between the disease’s outcomes and the causes of the
disease, as well as the effects of various prognostic factors on the outcomes over
time. The risk ratio (RR) and the hazard ratio (HR) are mainly used to quantify
the associations between the drug exposure and the outcomes, as well as the
frequency of death, as a ratio between the exposed group and reference (or control)
group [46,47]. The former includes the subjects that are exposed on a specific drug,
whereas the latter consists of healthy individuals. Cohort studies are able to over-
come several limitations that are present in traditional clinical trial studies by
(i) measuring patient-specific outcomes from large population groups, (ii) keeping
track of follow-up patient data, and (iii) being less expensive than large-scale clinical
trials [48]. An example of the clinical importance of a cohort study lies on the fact
that it can address the unmet needs in the special case where the exposure is a rare
condition, such as an autoimmune disease [43,44]. In practice, a well-designed
cohort study can provide deep insight into the underlying mechanisms of a disease’s
onset and progress.
22 CHAPTER 2 Types and sources of medical and other related data
5.
2.2 Types ofmedical data
Below we provide some details on the sources of data mentioned above.
2.2.1 Biosignals
The biosignals are produced by the electrical activity that arises from the biological
activity that takes place within different tissues and organs of the human body. The
most common types of methods that are currently used to record biosignals in clin-
ical research are presented below along with a brief description of their functionality
and related clinical applications.
• EEG signals: these types of signals are produced by the electrical activity of the
brain cells. When a neuron fires, an action potential is generated as a result of
the exchange of ions that occurs inside and outside the neuron’s cell [8]. This
causes an alteration in the electrical charge from negative to positive and thus
generates an ionic current (extracellular current) that is then propagated through
the neuronal axons to other neurons, and as a result an electrical field is
generated. This field is propagated throughout the brain and can be recorded by
electrodes that are placed around the scalp. EEG signals consist of various brain
rhythms (brainwaves) including delta (0.3e4 Hz), theta (4e8 Hz), alpha
(8e14 Hz), beta (14e30 Hz), and gamma (>30 Hz), with each one having a
clinical importance in disease and pathological diagnosis [49]. EEG signals
have been extensively used in clinical research to study potential fluctuations
under specific events (i.e., event-related potentials [ERPs]) [50], as well as in
various pathologies including epilepsy [51], schizophrenia [52], dyslexia [53],
and dementia [52].
• MEG signals: these types of signals are produced by the magnetic fields that are
generated by the electrical activity of the brain cells. The electrical activity that
is generated by the neuronal triggering produces an extremely weak magnetic
field (as a result of intracellular current flow) that can be only recorded by
powerful magnetometers, known as superconducting quantum interference
devices (SQUIDs) [9]. SQUIDs are usually placed in liquid helium and are able
to capture the extremely small alterations in the brain’s magnetic field
(w1015 T), when the Earth’s magnetic field varies between 104 and 105 T
[54]. For this reason, the MEG examination is performed inside magnetically
shielded rooms to shield out the inference of outside magnetic fields [9]. The
main advantage of MEG against EEG is that the former is not affected by the
electrical field’s distortion during its propagation through the skull, scalp, and
cerebrospinal fluid. Thus, the MEG yields both higher spatial and temporal
resolution [9]. However, the MEG equipment is very expensive due to its
superconducting technology and is often subject to high noise levels. MEG has
been used for the examination of neocortical epilepsy regions due to its high
spatial resolution [55], amnesia [56], etc.
2.2 Types of medical data 23
6.
• EMG signals:these types of signals are produced by the electric currents that are
generated by the muscle contraction. The depolarization and repolarization of
the skeletal muscle produces a difference in the electrical potential within the
muscle cells (i.e., an electrical field), which propagates throughout the muscle
fiber [10]. The electrical activity of the selected muscle is detected by surface
electrodes. A needle is often used to stimulate the skeletal muscles, yielding the
single motor unit action potential (SMUAP) with an amplitude of 300e400 mV.
EMG signals are used to detect anomalies in the activity of the muscles,
including myopathy and neuropathy [57], as well as in biomechanics for the
development of body prosthetics [58].
• EOG signals: these types of signals are produced by the electric potential that is
generated by the cornea and the retinal activity during eye movement. A typical
EOG records the electrical field that is produced by the difference between the
cornea’s positive potential and the retina’s negative potential, i.e., the cor-
neoretinal potential, with an amplitude from 0.4 to 1 mV [11]. EOG has been
used as a method for removing ocular artifacts in other biosignals, such as EEG
[59], as well as for studying the eye movement in humanecomputer interaction
systems [60]. Other relevant procedures include the electronystagmography []
[61] that records the eye movement during nystagmus.
• ECG or EKG signals: these types of signals record the electrical activity that
arises from the depolarization and repolarization activity of the heart [7]. A
typical ECG records the P wave as a result of the right atrium’s activation
(80 ms), the QRS complex (120 ms) as a result of the depolarization
between the left and the right ventricles, the T wave (160 ms) as a result of the
repolarization of the right and the left ventricles, and finally the U wave as a
result of the repolarization of the interventricular septum [7]. The intervals
between the waves can be used as indications of abnormal heart activity, e.g., a
prolonged PR interval from the atrial activation to the beginning of the
ventricular activation might indicate heart failure [62] and a wide QRS complex
might denote both left and right bundle branch block [62]. Furthermore, ECGs
have been widely used for studying arrhythmias [63], coronary artery disease
[64], and other heart failure conditions.
• Phonocardiography (PCG) signals: these types of acoustic signals record the
sounds that are produced by the heart’s beat and the blood flow (murmurs)
between the heart valves [65]. PCGs have the same origins as ECGs, and they
have been used to study abnormalities on heart sound for the detection of heart
defects (e.g., cardiomyopathy) [66], as well as for biometric identification [67].
• Electrocorticography (ECoG) signals: these types of signals can directly capture
the extracellular currents that are produced by the electrical activity of the brain
cells within the cerebral cortex [68]. ECoG signals have been widely used to
localize epileptic zones before epileptic surgery with very high precision [69] and
for the localization of activated brain regions using motor- or somatosensory-
evoked potentials through a procedure that is known as electrical cortical stim-
ulation [][70]. ECoG signals yield high temporal resolutions, and their invasive
24 CHAPTER 2 Types and sources of medical and other related data
7.
nature, however, involvessurgical operation procedures, a fact that makes it
difficult to obtain with the exception of heavy medical conditions.
In all types of biosignals, the sampling frequency (or sampling rate) and the
recording duration are directly proportional to the size of the acquired data and
the speed of data acquisition process. For the majority of the biosignals, the modern
recording systems use sampling frequencies that may vary from 50 to 500 Hz to
1 kHz and even 10 kHz (i.e., 10,000 samples per second). According to the signal
recording time (e.g., on an hourly basis or on a daily basis) and the number of
bits used for encoding the samples (e.g., 8 bits), the data size may vary from MB
(megabyte) to even GB (gigabyte) of digitized signal data. For example, the ECG
biosensors for patient monitoring can record the activity of the heart for hours or
weeks with sampling rates that vary in 50e250 Hz, yielding huge amounts of accu-
mulated data (e.g., a system with a sampling rate 250Hz can record more than 21
million samples per day).
2.2.2 Medical images
The medical images can be obtained by a variety of diagnostic imaging modalities or
systems. Widely used sources of medical images in clinical research include the
computerized axial tomography (CAT), MRI, fMRI, PET, SPECT, the optical coher-
ence tomography (OCT), fNRIS, the US imaging, and the photoacoustic imaging,
where each type of medical image has a unique clinical meaning. The origins and
applications of these types of medical images in clinical research are summarized
below:
• X-ray CT or CAT: a medical tomographic imaging technique that uses X-rays
(ionizing radiation) to construct highly detailed cross-sectional images
(slices) of different body parts [12]. An X-ray tube produces X-rays that are
passed through the patient’s body parts (in parallel, fan, or cone shape), yielding
radiation intensities (projections) that carry information regarding the structure
of the examined body part [12]. The whole system is placed into a gantry that is
able to generate projections around the body, which are captured by the X-ray
detectors as electrical signals. The structural image is finally reconstructed
using a special computer software. Multiple images can be obtained according
to the scanner’s ability to generate multiple cross-sectional images (i.e., the slice
thickness). CT scanners have high spatial resolution and are able to detect
fluctuations in small area units yielding clinical images with high anatomic
detail [12]. Contrast agents can be also injected into the body to observe changes
between normal and abnormal tissues (lesions) [71], as well as track the arterial
blood flow (angiography) to examine for blood vessel diseases, such as aneu-
rysms [72]. However, the radiation level that is followed by a CT scan is large
enough and shall not exceed certain levels. CT scans have been widely used in
clinical research for the three-dimensional (3D) reconstruction of the arteries,
heart, and other organs [73] and cancer treatment [74], among others.
2.2 Types of medical data 25
8.
• MRI: anuclear medical imaging technique that uses strong electromagnetic
fields to excite the hydrogen atoms in the body and produce cross-sectional
images highlighting the structure of the tissues in different planes [13]. The
hydrogen atoms are excited using radiofrequency (RF) pulses that are emitted in
a specific frequency range (i.e., the Larmor frequency), yielding an energy
release from the nuclei of the hydrogen atoms in the form of RF signals [13].
The latter are recorded by RF detectors. As the hydrogen atoms have different
magnetic characteristics in different tissues, the MRI scanner is able to capture
various pathological conditions inside the organs of the body in the complete
absence of ionized radiation. Echo-planar imaging is usually used to obtain
multiple slices with a single RF excitation pulses, in almost milliseconds,
overcoming motion artifacts [75]. Popular types of contrast MR images include
the T1-weighted images that are produced using a short repetition time between
the RF pulses, yielding images with good anatomic information, and the
T2-weighted images that are produced using a long repetition time between the
RF pulses, yielding images with high tissue detail, which are useful for the
detection of tumors [76]. A practitioner can configure the contrast of the MR
scanner (i.e., the T1/T2 ratio) to construct images that can be used to detect
benign or malignant tumors [77], neoplasms [78], inflammatory myopathies
[79], etc. An emerging MRI-based technique is diffusion weighted imaging,
which is based on the motion of the water molecules in the human body [80]. A
similar approach is the diffusion tensor imaging, which enables the examination
of the brain’s white matter tracts and fiber tracking by computing the diffusion
tensors that describe the diffusion anisotropy per pixel [81].
• fMRI: a straightforward medical imaging technique that is based on the princi-
ples of MRI but offers an additional new temporal dimension that accounts for
the changes in the blood’s oxygen levels, i.e., the blood oxygen levele
dependent contrast mechanism [16]. When a neuron fires, the blood flow on the
neuron’s region is increased, a fact that alters the concentration of oxygen in the
hemoglobin (HBC). The change in the oxygenation state of HBC alters the
strong surrounding magnetic field that is applied. The fMRI BOLD contrast
mechanism is able to capture these fluctuations in the magnetic field and thus
provides functional information regarding the activation of different neuronal
regions according to different tasks. Although the fMRI is both spatially and
temporarily limited, it can enable the mapping of different activities of the
human body, such as sensory, motor, processing, memory, cognition, emotion,
speech, and language tasks with brain regions [82], as well as for the detection
of brain regions that are activated during epilepsy [83].
• PET: a molecular-level medical imaging technique that makes use of positron-
emitting radioactive isotopes to detect the photons that are produced as a
result of the radioactive decay of the positrons during their interaction with an
important biological molecule, such as amino acids [14]. The radioactive decay
is recorded by the PET detectors. Thus, the PET scan can track the position of
the isotopes and provide significant clinical information regarding the
26 CHAPTER 2 Types and sources of medical and other related data
9.
biological and physiologicaloperations, i.e., the metabolic processes, at a
molecular level, from different angles. Thus, the PET scan can record the
temporal evolution of undergoing molecular-level interactions, e.g., the degree
of the nucleic acid uptake and absorption as well as from other tracers too, a
process known as compound labeling. PET scans are extensively used in clinical
oncology to reveal the biochemical characteristics of tumors using the flur-
odeoxyglucose as a radioactive isotope, based on the fact that the glucose
molecules are highly susceptible by tumors [84]. PET scans can be also
combined with CT scans yielding the hybrid PET-CT scan that can provide
images that combine both anatomic and functional information regarding
biochemical and physiological conditions [85].
• SPECT: a medical tomographic imaging technique that is based on the principles
of PET to detect gamma ray photons that are emitted by radionuclides using a
scintillation camera to produce a 3D radioactivity distribution [15]. The SPECT
scan records the distribution of the radionuclide uptake within the body, i.e., the
radioactivity distribution, from different angles and thus provides functional
information from multiple projections regarding the uptake of the radionuclides
from the organs. SPECT uses typical radionuclides that do not emit positrons in
the case of PET where highly expensive, short half-life radioisotopes are used,
which are generated inside radionuclide generators. SPECT can be combined
with CT to reduce the noise levels that are often introduced by the scattering of
the gamma ray photons [86]. SPECT clinical applications include myocardial
perfusion [87], tumor imaging [88], and cerebral blood flow imaging [89].
• OCT: an optical medical imaging technique that produces cross-sectional images
of the internal structure of biological tissues and organs by capturing the
backscattered light from the tissue [90]. The produced images are of high
quality (100 times larger than the ultrasound), on the micron scale (1e15 mm),
and can be obtained in real time, making OCT an emerging diagnostic imaging
modality. OCT has many applications in ophthalmology for detecting glaucoma
and macular edema [91], in arterial pathologies for studying plaque develop-
ment [92], in gastric and esophageal cancer for identifying lesions using cath-
eters/endoscopes [93], etc.
• fNIRS: a medical imaging technique that measures the oxygen consumption in
the blood flow within different types of tissues based on spectroscopy [19]. The
NIRS measures the absorption of oxygenated and deoxygenated HBC by the
living tissue in the near-infrared electromagnetic spectrum, as well as the
oxygen delivery in the living tissue, and thus it is able to record the metabolic
rate of oxygen consumption in different tissues. fNIRS is based on the principles
of the BOLD contrast mechanism (the basis of fMRI), by measuring the
hemodynamic response in different brain regions, where an increased hemo-
dynamic response denotes an activation in the region of interest (ROI). fNIRS is
a relatively fast technology that uses fiber optics to transfer the changes in
absorption of the light that is emitted by sources onto the head’s surface. A
similar technique is the optical topography that measures the changes in the
2.2 Types of medical data 27
10.
blood concentration usingnear-infrared light [94]. fNIRS is easily portable and
can be used to assess the functional recovery after stroke and other traumatic
brain injuries [95], as well as to measure the cortical blood flow and activation
during physical activities, e.g., sensorimotor tasks [96].
• US: a real-time, medical imaging technique that is based on the principles of
ultrasound to produce ultrasonic images that capture the echoes that are
produced by soft tissues when the probes (transducers) generate sound waves
with high frequency (20 kHz) [17]. In an ultrasound imaging system, a probe
is usually used to generate sound waves that travel into the tissue. The sound
waves are reflected or backscattered from the internal tissue structures having
different acoustic properties. The frequency of the sound waves can be recon-
figured to yield better resolution of the tissues or more tissue depth. Although
ultrasound imaging does not make use of ionizing radiation and is easily
portable with real-time evidence, it does not provide detailed anatomic infor-
mation regarding the structures behind the bones and sometimes it is difficult to
interpret the outcomes [17]. US has many clinical applications including the
obstetric US that is used for examining the fetus during pregnancy [97], the
echocardiography that is used to examine the functionality of the heart valves
[98], the intravascular US [99] that is used to visualize the blood flow within the
blood vessels using catheters with attached probes to detect coronary artery
lesions, and the duplex US [100] that makes use of the Doppler effect to display
the tissue movement and blood flow to detect stenosis in carotid arteries and
intracerebral arteries, among many others. The B-mode US has been also
proposed, enabling the visualization of anatomic details in the ultrasound
images for atherosclerotic progression [101].
• Photoacoustic imaging: a real-time, medical imaging technique that is based on
the principles of the photoacoustic effect [18]. A photoacoustic imaging system
consists of a nanosecond pulsed laser that generates pressure waves that are
emitted into biological tissues that produce photoacoustic pressure waves that
can be recorded by ultrasonic transducers yielding an image of the tissue.
During the pulse emission process, the biological tissues absorb the light energy
and convert it into heat. This causes the biological tissue to expand its size due
to the changes in its thermoelastic properties (the thermoacoustic effect) and to
produce sound waves (in the frequency range of MHz) that propagate and are
recorded by the ultrasound transducers. Photoacoustic imaging is a hybrid
method that combines the spectral characteristics of optical imaging with the
spatial information of ultrasound. Photoacoustic imaging has numerous appli-
cations in the field of medical diagnostics including cardiovascular diseases
[102], cancer detection, diagnosis and treatment [18], and brain function [103],
among others.
The number of acquired images may vary from several hundred to even
thousands of images per scan depending on the slice thickness technology that
is used. The majority of the medical imaging methods generate a series of
28 CHAPTER 2 Types and sources of medical and other related data
11.
two-dimensional (2D) image/slicesthat are organized into a 3D structure. In the
majority of the imaging acquisition protocols, the size of a 2D slice/image may
vary from 256 256 pixels and 512 512 pixels to even 1024 1024 pixels
(in the modern scanners). The size of a voxel depends on the spatial resolution
(slice thickness) and the field of view of the scanner, where a voxel is a pixel in
the 3D space (i.e., a volume element). As the modern scanners are characterized
by high spatial resolution, they are able to capture very small fluctuations in pixels
with extremely small dimension, such as 0.5 0.5 mm2, and in voxels with size
(width, height, depth) ¼ 0.5 0.5 0.5 mm3 (depending on the slice thickness),
yielding images that consist of millions of volume elements. Therefore, the smaller
the pixel size, the higher the resolution of the images. In the majority of the cases, a
voxel is usually stored as 1 byte (i.e., 8 bits) according to the Digital Imaging and
Communications in Medicine (DICOM) standard (see Section 2.3.3), where in
each imaging type, the voxel represents a unique information (see Section 2.3.3
for the medical imaging standards). For example, the voxel in a CT scan represents
the absorption rate of the X-rays from a specific part of the body. In 3D ultrasound
imaging, the voxels represent the volumetric flow rates and densities of the organs.
In MRI scans, the voxels represent the tissue characteristics as a result of the
hydrogen excitation in the water molecules. A scanner that generates 1000
images/slices with 512 512 voxels per slice, in the 3D space, can produce
images with a total size 256 MB (512 512 voxels/slice x 1000 slices 1 byte/
voxel). In all cases, the image size is equal to the header size (which includes
patient metadata and imaging acquisition specifications) plus the pixel data size,
which is calculated by multiplying the number of columns with the number of
rows, the pixel depth (i.e., the number of bits that are used to encode the pixel’s
information), and the number of slices (or frames).
2.2.3 Omics
The field of omics consists of a large number of areas/types of omics, with each one
having a specific unique clinical importance toward understanding the underlying
mechanisms behind the cellular interactions. Examples of omics data types include
the following:
• Genomics: the study of structural and functional genomic information. Structural
genomics involves the coding of whole genomes, whereas functional genomics
involve the investigation of the genome’s behavior during the gene’s develop-
ment process, as well as under environmental circumstances [20]. A genome
consists of genes, i.e., RNA or deoxyribonucleic acid (DNA) sequences, which
carry valuable genetic information regarding the formation, development, and
functionality of the biological cells. The DNA and RNA are nucleic acids that
comprise the fundamental genomic materials of any living organism along with
the lipids, proteins, and polysaccharides [104]. The clinical applications in the
field of genomics include chromosome mapping (the assignment of genes to
2.2 Types of medical data 29
12.
chromosomes, i.e., DNAmolecules that carry portions of genetic material),
coding unannotated genes, and mapping genetic variants to phenotypes (i.e.,
traits of an organism) and haplotypes (i.e., genetic variants that are grouped
together) using single-nucleotide polymorphism (SNP) genotyping arrays to
study the implication of genetic variants in different diseases [105]. In contrast
to genomics, the genetics is a smaller field that studies the behavior of specific
genes instead of the whole genome.
• Transcriptomics: the study of all the RNA transcripts of an organism. The RNA is
a nucleic acid that is involved in different biological processes including gene
expression and gene coding and decoding [26]. The transcriptome refers to all
the RNA molecules that are present in a single cell or in a group of cells, where
the messenger RNA (mRNA) serves as a transient intermediary molecule that
transfers the genetic information (i.e., the nitrogen-containing nucleobases:
guanine, uracil, adenine, and cytosine) that is used to synthesize the proteins.
High-throughput RNA-sequencing and microarray technologies can capture the
whole transcriptome, yielding important details regarding the gene regulation
and the gene expression in different tissues and organs of the human body and
thus being able to capture the genetic profile of an organism. This is the reason
why transcriptomic technologies, such as RNA-sequencing [28], are often
employed to annotate previously unannotated genes and understand the
underlying cellular mechanisms of diseases, such as cancer [106].
• Proteomics: the study of the proteins, their topological characteristics, and
further interactions between them [22]. High-throughput technologies, such as
MS [29], are used to detect proteins from the peptides and thus shed light into
the structure and functionality of the proteins in specific types of cells. Proteins
are involved in a variety of biological processes including the cell growth and
the intracellular communication, among others, and thus it is important to
understand their expression profile in terms of how they function and interact
with other proteins. Toward this direction, the analysis of proteineprotein
interactions (PPIs) using concepts from graph theory is able to simulate the
complex interactions between the proteins and thus reveal functional associa-
tions between them under a given biological process [107]. Furthermore, the
topological characteristics of the PPI networks can reveal hubs, i.e., proteins
with increased participation in different biological processes, as well as identify
specific groups of proteins (clusters) that exhibit common functional charac-
teristics [107].
• Lipidomics: the study of lipids, i.e., biomolecules with structural diversity and
complexity. Lipids are used to address the cellular needs for energy storing,
signaling, and regulation and are highly engaged in preserving the balance
within a biological cell [21]. Any attempt to disturb this balance has a direct
effect on the chemical properties of the lipids. Therefore, the lipids can reveal
important information regarding pathophysiological conditions, such as
inflammatory and neurodegenerative diseases [108]. TLC [30] and MS [29] are
30 CHAPTER 2 Types and sources of medical and other related data
13.
the two mostcommonly used methods for identifying the lipids and under-
standing their functions in any biological cell.
• Metabolomics: the study of the multitude of metabolites (e.g., amino acids).
Metabolomics involves all those processes that involve the characterization of
the metabolic profiles of cells according to a genetic variation [23]. Technol-
ogies such as nuclear magnetic resonance and MS are widely used to detect the
metabolic changes in cells under different metabolomics experiments (e.g.,
under a drug administration). Metabolomics can provide valuable information
related to the metabolic effects of cancer cells in the presence of drugs, as well
as assess the chemical toxicities of a proposed drug in different organs and
tissues of the body during preclinical drug development [109].
• Microbiomics: the study of the effect of microorganisms in the human physi-
ology [24]. These effects include the negative implications of bacteria, fungi,
and other related microorganisms in the tissues and organs. These microor-
ganisms are usually referred to as microbiota. The genes of the microbiota form
the microbiome. The high-throughput NGS technology [27] can be used to
generate genetic profiles of the human microbiome and thus identify microbiota
variations [109,110] for various human diseases, including heart disease,
diabetes, and cancer, among many others.
• Epigenomics: a field that focuses on studying the effects of pathological factors,
such as degenerative diseases, cancer, and metabolic disorders to the whole-
gene expression [25]. These effects usually yield alterations in DNA methyl-
ation, proteins, enzymes, and other epigenetic marks. In fact, epigenomics aims
at exclusively identifying gene expression implications “on” the genome. The
most commonly used method for epigenomics analysis is the chromatin
immunoprecipitation (ChIP), which is combined with high-throughput
sequencing (HTS) [111]. This enables the genome-wide epigenetic analysis so
as to study for the effect of the isolated DNA from chromatin-associated
proteins that have been shown to play an important role during cancer devel-
opment [112].
The majority of the omics data, including genomic, proteomic, and transcrip-
tomic, among many others, are generated by the NGS analysis, a straightforward
technology that uses high-throughput methods for molecular profiling, such as
transcriptome sequencing (RNA-Seq) [28]. The raw data that are generated by the
NGS technology, for an individual sample, may vary from 10 gigabytes (GB),
e.g., in the case of microRNA sequencing (miRNA-Seq), and 20 GB, e.g., in the
case of RNA sequencing (RNA-Seq), to even more than 200 GB, e.g., in the case
of whole-genome sequencing (WGS) [27]. The size of the generated sequencing
data (raw data) is proportional to the number of samples under examination. The
raw data are usually stored in a FASTQ format (see Section 2.3.4) that is the funda-
mental input of an NGS analysis workflow that is executed by parallelized,
high-performance computing pipelines. The output of the pipeline is stored in the
SAM format (see Section 2.3.4).
2.2 Types of medical data 31
14.
2.2.4 Laboratory tests
Thelaboratory tests comprise a widely known type of medical data. Some examples
include the following:
• Hematological (or haematological or blood) tests: perhaps the most common
types of laboratory tests that are used for the analysis and examination of the
hemic system [113]. These types of tests make use of microscopes and hema-
tologic analyzers to examine the concentration of HBC in the blood flow (i.e.,
the oxygen levels in the blood flow), white blood cell (WBC) count, and the red
blood cell (RBC) counts, as well as the number of platelets (PLTs), the iron
concentration, and the number of erythrocytes and leukocytes. Furthermore, the
hematological tests are also used to evaluate certain types of diseases and
monitor different kinds of disorders through the measurement of the
prothrombin time and the thrombin time, the hematocrit (HCT), the blood
sedimentation, the blood coagulation time, the fibrin clot lysis time, and the
bone marrow, among others [113]. In general, the hematological tests are widely
used for the examination of inflammatory and blood clotting disorders and
genetic defects, as well as for monitoring an administered drug’s progress (e.g.,
the plasma levels under an anticlotting medication), the diagnosis of anemia, the
detection of blood cancer, the measurement of the cholesterol levels and the
blood pressure, and the detection of blood loss and blood clotting, among many
others [114].
• Urine tests: tests that examine the urine through a procedure that is known as
urinalysis [115]. Urinalysis uses chemical screening tests and microscopes to
study and analyze the urine flow, the urine gravity, the urine color levels, and the
occurrence of any bacteria and cellular fragments. The urine tests, along with
the hematological tests, comprise the two most common types of laboratory
tests that are conducted during a typical health examination process (check-up)
and during a pregnancy test. Urine tests are widely used for the detection of
kidney and liver disorders, as well as for the diagnosis of diabetes and prostate
cancer and the detection of urinary tract infections and prostatic hypertrophy
[116].
• Serological tests: special types of blood tests that seek for the infection of
antibodies under a specific virus [117]. More specifically, microscopic analysis
is used to examine the blood samples toward the detection of fungi, bacteria, and
other parasites that are present in the blood cells, as a result of a virus. In fact,
people who are infected by a virus exhibit different symptoms that weaken the
immune system. For this reason, the serological tests are widely employed to
understand the underlying mechanisms behind the virus infection and the
origins of the symptoms and are used for the detection of rubella, fungal
infections, and autoimmune disorders and for finding appropriate therapeutic
treatments [118].
• Coagulation tests: special types of blood tests that examine the blood clotting
process. Coagulation tests are performed through fast coagulation analyzers and
32 CHAPTER 2 Types and sources of medical and other related data
15.
microcoagulation systems thatmeasure the blood’s coagulation speed, pro-
thrombin time, complete blood count (CBC), and the overall blood PLT levels
[119]. Coagulation tests are used for the detection of blood clotting disorders,
such as thrombophilia and hemophilia, as well as for liver disorders that include
excessive bleeding and the evaluation of any drug-related medication that
involves blood clotting as a negative implication [119].
• Histopathological (histological) tests: these tests are used to examine the
different types of tissues (e.g., muscle, nervous, epithelial) that reflect the
disease’s type [120]. Histopathological tests are primarily used in cancer
diagnosis. A sample tissue is initially obtained, on the least invasive way, for the
purposes of a biopsy test, where the size of the collected tissue sample varies
according to the tissue area that is under examination. Microscopic analysis
combined with cytological and histopathological principles, such as ICH [33]
and IHC [34], as well as gene profiling techniques, is then used to analyze the
tissue specimens yielding a histopathological report. The latter indicates
whether the tissue sample was found malignant (or metastatic malignant) or
benign according to the “behavior” of a specific marker that is used for tumor
detection (e.g., like the p53 tumor protein). In fact, the marker binds into the
sample causing the antigens or proteins of the sample to be marked or not (i.e.,
invokes a chemical release). Moreover, the histopathological report provides
information regarding the tumor type, the hormone susceptibility, and similar
tumor indicators to define a more targeted drug treatment in the case of a
malignancy (or metastases) [121].
• Immunological tests: these tests examine the functionality of the immune
system. Immunological tests share a similar basis with the histopathological
tests, where markers are used to identify pathogenetic characteristics on tissue
specimens [122]. These markers can take the form of either antibodies or
antigens according to the type of immunological analysis. Immunological tests
are used to diagnose chronic diseases, such as autoimmune diseases, where the
immune system attacks itself (e.g., like in systemic lupus erythematosus,
multiple sclerosis, rheumatoid arthritis), as well as to detect primary and
secondary immunodeficiency disorders, where the immune system is not able to
function properly and thus it is more susceptible to viruses and parasites (e.g.,
like in HIV/AIDS, neutropenia, etc.) [123].
• Skin tests: tests that examine the changes in the skin. These changes might be a
result of an allergy, a skin disorder, or might even denote skin cancer. In the
latter case, a skin biopsy is conducted to examine the suspected skin tissue
sample by removing the skin tissue sample and applying microscopic analysis
(similar to the histopathological tests) [124]. Skin tests are widely used to detect
skin redness as a result of widened blood vessels, nonblanching hemorrhages
(like purpura and palpable purpura), skin carcinoma, and skin lesions that might
lead to skin cancer, as well as to detect allergies through a skin prick test [125].
The latter involves the insertion of allergens that trigger allergic reactions
(through the release of chemical compounds), which might cause symptoms,
2.2 Types of medical data 33
16.
such as feverand dermatitis. Allergies can be originated by different sources
including food (food allergies), drug substances (drug reaction allergies), etc.
• Endocrine function tests: tests that examine the functionality of the endocrine
system [126]. The latter is vital for the maternal health and consists of endocrine
glands that can be found in different parts of the human body including the
hypothalamus, thyroid, pancreas, liver, and adrenal, among others. These glands
release chemical compounds, which are known as hormones, which are trans-
ferred to the hormone receptors of the human body through the bloodstream.
Hormones are involved in a variety of biological functions including growth,
fertility, metabolism, and energy consumption, etc. Endocrine function tests are
used to detect gland dysfunctions [127], where a hormone imbalance is
observed. The hormone imbalance might be related to a hormone release by an
endocrine tumor, a virus infection, a hyperplasia (e.g., enlarged salivary gland),
a sexual dysfunction, etc. The early detection of an endocrine gland dysfunction
is crucial as a dysfunction in one gland can cause a direct or indirect reaction to
another [126].
2.3 Medical data acquisition
2.3.1 Biosignal acquisition standards
The ECG signal acquisition devices use surface electrodes that are placed to specific
points in the chest and the limbs based on the standard 12-lead ECG placement [36].
According to the 12-lead ECG placement, four electrodes are placed symmetrically
on the limbs, namely on the right-hand wrist, the left-hand wrist, the right ankle, and
the left ankle, where one of this lead usually serves as the neutral lead. Alternatively,
these leads can be placed close to the hips and shoulders. Then, six electrodes are
placed on the chest, i.e., the precordial electrodes, starting from the intercostal space
at the right of the sternum to the midaxillary line, according to the angle of Louis
method. Additional placements involve the 3-electrode system and the 5-electrode
system where the electrodes are limited to the chest on equal distances from the
heart. In any case, the electrodes record the electrical activity that occurs due to
the depolarization and repolarization activity of the heart’s valves, providing a
lateral and inferior view of the ventricular and articular activity. The contraction
activity is recorded as a potential difference that is transformed into electrical signals
with peak amplitudes that vary from 3 to 7 mV [7].
For EMG signals, there are both invasive and noninvasive methods for the data
acquisition process. In the latter case, surface electrodes are placed on the skin
around the muscle with a conductive gel to enhance the signal’s quality. In the inva-
sive case, a needle is used to detect the electrical signals directly from the muscle. In
both cases, electrical potentials are recorded as part of the muscle’s contraction
activity with peak amplitudes varying from 0 to 10 mV [10]. Depending on the
muscle under observation, the EMG potentials might be higher than 10 mV [10].
34 CHAPTER 2 Types and sources of medical and other related data
17.
The EOG signalacquisition process involves the placement of six electrodes to
record the activity of the muscles that are responsible for the human eye movement
(i.e., the medial, lateral, and superior rectus and the superior and inferior oblique),
where one electrode is neutral (on the forehead). These muscles are usually referred
to as extraocular muscles. The EOG signals are acquired through horizontal or
vertical eye movement. The EOG potentials occur as a result of the cornea and
retinal electrical activity (corneoretinal potential) during eye movement with peak
amplitudes that vary on the interval [0.05,3.5] mV [11].
The EEG signal acquisition process involves the placement of 16e32, 128, and
even up to 256 surface electrodes on the human brain (i.e., scalp electrodes), which
are usually incorporated into appropriate head caps. The scalp electrodes are most
commonly placed on the head cap according to the International 10e20 system
[37], where the distances between the electrodes are either 10% or 20% the distance
from the nasion to inion or from the left side of the head to the right side. Conductive
gels are also placed for improving the quality of the recorded signals. For obtaining a
high-resolution analysis, more sensors need to be placed. These additional sensors
can be placed according to the International 10e5 system [37], where the distances
between the adjacent electrodes are smaller, i.e., the area between the adjacent elec-
trodes in the 10e20 system is filled. The EEG electrodes capture the changes in the
electrical field with peak amplitudes that vary on the interval [10,20] mV and convert
them to electrical signals that are digitized and stored in a computer device for
further analysis [8]. In the case of the ECoG signal acquisition, the amplitude of
the recorded transcranial signals is 1000 times higher, as the signal recording
approach is invasive [68].
In MEG signal acquisition, the sensors are coils (and more specifically supercon-
ducting magnets) that are already placed inside a dewar. The powerful magnetom-
eters are usually placed inside liquid helium to reduce the heat levels that are
produced by the superconducting technology that captures the extremely weak
changes in the magnetic field that occur during the neural activation. The whole sys-
tem is placed into an electromagnetically shielded room for reducing the noise levels
from the outside magnetic fields. These changes in the magnetic field are recorded
from the sensors and finally digitized for further manipulation. The extremely small
alterations in the brain’s magnetic field are approximately equal to 1015 T [9].
Biosignals can be also acquired using real-time health monitoring devices that
record the physiological activity, such as the heart rate, the respiratory rate, and
the blood pressure. These measures are transferred through wireless sensor networks
(WSNs) to computer devices and can be monitored on a daily basis.
2.3.2 Laboratory tests standards
Hematological analyzers are used to conduct hematological tests. The blood sample
is first collected either through venipuncture sampling or through arterial sampling
and sometimes fingerstick sampling. The hematological analyzers are able to differ-
entiate and measure the different types of blood cells using the traditional electrical
2.3 Medical data acquisition 35
18.
impedance method [128],according to which a change in the electrical impedance
between two electrodes (among which the blood flows) under an applied electrical
field is proportional to the cells volume. Thus, the volume of the WBCs, RBCs, and
PLTs can be differentiated and measured. Another widely used qualitative and quan-
titative method is the flow cytometric technology [129], where the blood sample is
first treated with fluorescent antibodies that bind in the sample and then a laser beam
is applied on the blood cells and appropriate photodetectors are able to capture the
amount of light that is absorbed by the blood cells. Together with the light that is
scattered by the blood cells from different angles, they can provide useful informa-
tion regarding the chemical compounds of the blood and the cells morphology. A
standard biochemical analysis involves the measurement of WBCs, RBCs, PLTs,
HBC, HCT, C-reactive protein, creatinine, glucose, cholesterol, potassium, sodium
levels, and the CBC as an overall index, among others. The measurement units vary
according to the laboratory where the analysis takes place, with the typical measure-
ment units usually being in mg=dL or mmol=L.
Coagulation analyzers are used to analyze the blood coagulation. The coagula-
tion analyzers are based on an optical detection method according to which a laser
beam hits the blood sample [119]. The scattered light is recorded by photodetectors
that covert the optical signals into electrical signals. The intensity of the scattered
light is proportional to the coagulation time and the blood clotting time. When
thrombolytic agents are applied on the blood sample, the analyzer can measure
the thrombin and prothrombin time.
In histological analysis, microscopes are used to analyze the tissue specimens for
detecting pathological conditions. A tissue sample is usually obtained from the area
under examination (e.g., from epithelium, endothelium, mesothelium), at the least
invasive way. The sample is then placed on a glass microscope slide for analysis.
The microscope that is used to analyze the sample can either be optical or electronic.
The optical microscope uses light to magnify the sample using photodetectors,
whereas the electron microscope uses a beam of electrons that is generated using
high voltage, instead of the light beam that is used in the optical microscope, to
reveal the morphological characteristics of smaller objects, with higher magnifica-
tion ratio, through electrostatic lens [130]. The IHC technique [34] is usually used
to detect specific proteins or antigens in the tissue sample using specific primary
antibodies that bind in the tissue sample where the sample is obtained through a sec-
tion, against the ICH technique where the cells have not been isolated by the tissue
sample (remain intact). In endocrine analysis, the functionality of the endocrine
glands is examined using gene expression analysis [131] to detect the activity of
proteins that are affected by the activity of the hormones. Endocrine tumors usually
cause a hormone imbalance that affects the activity of the proteins in the cells.
Standard urine test strips are used to detect pathological conditions in the
patient’s urine [115]. The urine test strip is a plastic strip with a colored scale that
indicates the presence of leukocytes, pH, protein, glucose, specific gravity, and
HBC levels, among others, on the urine sample. Each pad on the plastic strip consists
of a specific chemical compound that reacts with the urine compounds yielding a
36 CHAPTER 2 Types and sources of medical and other related data
19.
color that indicatesthe presence of the pad’s chemical compound on the urine
sample. A urine test strip is able to detect metabolism disorders, urinary deficiencies,
liver and kidney disorders, dehydration, and drug abuse, among others. Another
widely used method is the optical microscopy, according to which the sample is
magnified and examined. Laboratory measurements can also be obtained, e.g., for
sodium, potassium, and calcium levels, with the typical measurement units usually
being in mmol=24 h. Blood testerelated measures, such as the number of erythro-
cytes and leukocytes, can also be obtained.
Immunoassay analyzers are used to examine a patient’s collected samples for
bacteria, parasites, and other disease-related substances. First, reagents are bound
into the collected sample, and then a light beam (of specific frequency) is applied
on the molecules of the sample. An emitted light from the molecules indicates
that the collected sample is positive to the reagent. The light signals that are captured
by the photodetectors can be converted to electrical signals. The most commonly
used reagents in immunoassay analyzers are fluorescent substances. A prominent
technology that is currently used in immunoassay analyzers is based on chemilumi-
nescence [132], according to which light is emitted as a result of a chemical reaction.
Serological analyzers are used to analyze the blood samples for infected
antibodies. A popular test in this area is the direct fluorescent antibody test [133],
also referred to as direct immunofluorescence, where fluorescent antibodies are
used to detect antigens that exist in specific bacteria and fungi. The emitted fluores-
cence (of specific wavelength) confirms the presence of the antigen under examina-
tion. Other widely used tests include the complement fixation test that tests the
presence of antigens in the serum and the enzyme-linked immunosorbent assay
(ELISA) test [134], where a microtiter plate is used to test the presence of antigens
using antibodies with tethered enzymes that bind with the antigens and cause a
chemical reaction that appears in the form of a color change (chemiluminescence).
2.3.3 Medical imaging acquisition standards
The traditional image reconstruction process involves the application of the inverse
fast Fourier transform (FFT) to transform the data from the k-space (the projection
space) where the spatial information lies in Cartesian coordinates to the original
space (the image space). This is known as the inverse problem in tomographic
imaging. A widely used, computationally efficient algorithm for tomographic image
reconstruction is FBP algorithm [38], which is based on the inverse of the Radon
transform. The FBP algorithm applies a one-dimensional filter on the raw data
from different projections before the backprojection process to the image space to
recover the image [38]. These methods, however, are often inadequate, especially
in the case where non-Cartesian coordinates are available or when the FFT can no
longer be applied due to the nonlinearity introduced [135]. To face this problem, iter-
ative reconstruction algorithms have been proposed using statistical methods (e.g.,
by minimizing a regularized least square cost function) to provide object estimations
from projections, in multiple iterations [135]. Examples of these algorithms include
2.3 Medical data acquisition 37
20.
the algebraic reconstructionalgorithm [39] and the iterative SAMV algorithm [40].
These algorithms provide better reconstruction but are more complex than the
previous approaches.
In MRI, the RF detectors capture the RF pulses that are generated by the
hydrogen atoms when the Larmor frequency is applied. The RF signals are con-
verted to electrical signals that are digitized. The data are recorded in the k-space
where the spatial information exists. Then, tomographic reconstruction algorithms
are applied to convert the raw data from the projections space into the image space.
The pixel’s brightness in an MRI slice denotes the mean attenuation of the hydro-
gens’ emitted RF signals by the tissue, bones, organs, and fat of the human body.
In fMRI, the MRI slices are obtained along with additional temporal information
regarding the BOLD responses that denote increased or decreased hemodynamic
response (activation) in the ROIs. fNIRS shares a common basis with fMRI, where
the hemodynamic responses are recorded by measuring the near-infrared light atten-
uation based on the neurovascular coupling. For fNIRS 3D image reconstruction,
methods similar to the diffusion optical tomography can be used, such as boundary
element methods for near-infrared absorption and scatter estimation [136]. In PET
scans, the metabolic processes at a molecular level are recorded in the form of coin-
cidence events [14]. PET image reconstruction is analogous to CT image reconstruc-
tion methods, yielding images with poorer quality, however, due to the photon
scattering and coincidence overlaps. The pixels in a PET image quantify the absorp-
tion of nucleic acid as a result of the molecular-level interactions with the adminis-
tered radioisotope (similar to the SPECT). In CT, the X-ray detectors capture the
ionizing particles that pass through the human body and finally convert them to elec-
trical signals. A pixel’s brightness in a CT image depends on the mean attenuation of
the tissue in terms of the radiodensity [12]. In general, the size of the pixel is dispro-
portional to the spatial resolution, with higher spatial resolution yielding smaller
pixels, with high detail. The 2D dimensions of imaging data may vary from
128 128 pixels to 256 256 pixels or 512 512 pixels and the number of slices
varies based on the slicing technology.
Examples of standard image formats include DICOM [137] and the Neuroimag-
ing Informatics Technology Initiative (Nifti) [137,138]. The former constitutes a
standard medical imaging format that is adopted by the majority of the manufac-
turers and clinical centers worldwide. According to the DICOM standard, a DICOM
file format (the format is recognized by the “.dcm” extension) consists of (i) a header
that includes the patient metadata (e.g., patient identification number, age, gender)
and the specifications of the image acquisition protocol (e.g., the scanner parame-
ters) and (ii) the pixel data, where a pixel value is represented as an 8-bit, 16-bit,
or 32-bit integer value through a linear transformation with a certain slope and inter-
cept [137]. The DICOM standard supports image compression that is useful in the
case where a series of DICOM images is produced by the scanner. On the other
hand, the Nifti file format constitutes the backbone format for storing neuroimaging
data (e.g., in brain studies), where the header and the pixel data are stored together
38 CHAPTER 2 Types and sources of medical and other related data
21.
under a “.nii”file format [137,138]. The most common method that is used by the
Nifti format for storing neuroimaging data is through a rotation and translation
matrix, which is used to transform the voxel coordinates to the desirable volume
space. According to the Nifti format, the images are encoded as 16-bit integer values
although the most recent Nifti-2 file format supports 64-bit integer values, thus
significantly increasing the size of the image space.
In the ultrasound imaging systems, the sound waves produced by the piezoelec-
tric transducers are scattered from the tissues and organs and finally returned to the
transducer in the form of echoes. The echo time and the intensity of the echo are
used to form the ultrasound image, where a pixel’s brightness is proportional to
echoes’ intensity. In photoacoustic imaging systems, the universal backprojection
algorithm [41] is used to reconstruct the image from the photoacoustic waves that
are reflected by the tissues or organs denoting the optical absorption in these regions.
In OCT, the optical scattering is measured. The images can be formatted either using
single-point scanning based on depth information from two lateral dimensions or
using charge-coupled device cameras for parallel scanning [139].
2.3.4 Omics acquisition standards
DNA sequencing is an approach that is used to detect the canonical structure of the
DNA in terms of the four nucleotides, i.e., the adenine (A), cytosine (C), guanine
(G), and thymine (T). According to the helix model, the “A” is always paired
with “T” forming one strand, and the “C” is always paired with a “G” forming
another strand. The strands are linked using hydrogen atoms. Popular DNA
sequencing methods include the Sanger sequencing [140], where the four deoxynu-
cleotides are used along with the DNA polymerase for four reactions where a DNA
primer binds with the fragments, as well as the MaxameGilbert sequencing [141],
which is more complex and uses radioactive labeling for sequencing DNA frag-
ments, and thus it is less used. HTS technology is the key technology toward the gen-
eration of millions of sequences simultaneously [27]. The high-throughput NGS
(also referred to as second-generation) method aims at enhancing the traditional
DNA sequencing methods using parallel sequencing to achieve the WGS through
genome fragmentation [27]. Examples of straightforward HTS methods include
the pyrosequencing [142] and the Illumina sequencing [143], which are based on
advanced polymerases and reversible dye-terminators for the detection of nucleo-
tides (using fluorescence and luciferase) yielding millions of detected nucleotides,
among others. In addition, ChIP-NGS [111] is used to examine the interactions
between DNA and proteins. Common standard data formats include the Sanger
FASTQ file format [144] that is used to store sequence information and the standard
flowgram format (SFF) that is used to encode sequence reads [145].
RNA sequencing is used to examine the transcriptome, i.e., the set of transcrip-
tomes in a biological cell [28]. RNA sequencing can provide great insight on the
RNA molecules that are responsible for the gene regulation, function, and coding,
2.3 Medical data acquisition 39
22.
as well asunderstanding the underlying mechanisms of a disease. Emphasis is
given on the mRNA molecules that transfer information regarding the encoding
of proteins, i.e., they act as an intermediate between the genes and the proteins
[28]. Additional groups of RNA molecules have been recently emerged including
the miRNA and the piwi-interacting RNA that is involved in the regulation of the
gene expression [146]. A standard RNA-sequencing analysis procedure involves
the execution of four steps [28]: (i) RNA isolation from the biological sample
(e.g., from a biological cell), (ii) reverse transcription of RNA to complementary
DNA (cDNA), (iii) amplification through polymerase chain reaction, and (iv)
cDNA sequencing. The conversion to cDNA is performed due to the fact that
the majority of the next-generation sequencers make use of DNA libraries for
sequencing. The serial analysis gene expression [][147] and the cap analysis
gene expression [][148] methods are often used to examine the mRNA molecules
for transcriptome fragments, where the number of RNA molecules, for a mamma-
lian cell, is more than 500 million [149].
The tissue microarray technology is used to detect tumors and other patholog-
ical characteristics in many tissue specimens that are placed on a tissue microarray
block [42]. The tissue specimens are obtained using sectional methods that manage
to isolate specific parts of the tissue for conducting a biopsy test. The block is then
divided into hundreds of smaller sections that can be placed either on an optical or
an electron microscope for analysis, similar to the IHC technology in histological
analysis, where specific proteins or antigens are detected in the tissue samples
using fluorescent antibodies that bind in the tissue sample. These proteins can
lead to the identification of new biomarkers or the validation of existing ones,
for different types of cancer, such as breast cancer and colorectal cancer, among
others. Furthermore, MS are used to quantify the mass of a molecule using an
ionizer that ionizes the molecule, then sorts the ions, and finally separates them
based on their mass-to-charge ratio to quantify the mass of the molecule using
electron multipliers or ion-to-photon detectors [29]. The output is a distribution
of the detected ions versus the mass-to-charge ratio. MS is widely used for the
characterization of the proteins’ morphological characteristics and to study the
function of the lipids in lipidomics [21].
TLC technology is widely used to monitor chemical reactions and discriminate
mixtures [30]. The standard procedure involves (i) the solid phase, where a thin glass
plate is covered with aluminum oxide or silica gel, and (ii) the mobile phase, where a
solvent is applied on the mixture. The flow of the solvent can reveal the molecular
structure of the mixture compounds through spots that remain on the plate and have
different colors depending on the compound characteristics. Finally, the retardation
factor is used for quantitative analysis that is defined as the distance of the spot from
the starting point [30] and depends on the solvent, the layer’s thickness, etc. These
spots can also be visualized using fluorescent compounds that make them visible
under a blacklight, as well as iodine vapors among others [30]. TLC is also widely
used in lipidomics for identifying the lipids concerning different disorders, such as
inflammatory and neurodegenerative diseases [108].
40 CHAPTER 2 Types and sources of medical and other related data
23.
2.4 Sources ofmedical data
2.4.1 Patient registries
The PRs are research-oriented collections (records) of health information from pa-
tients for clinical or scientific purposes in the form of an observational study [150].
The term “health information” refers to standardized types and formats of medical
data, including patient history, laboratory tests, medical images, and additional sour-
ces, such as patient and clinician/patient questionnaires, disease-related information,
and reported patient outcomes (or clinician claims) under health-related events
[150]. A PR is usually used by clinicians for the long-term (or short-term) collection,
storage, and evaluation of health information for a specific group of individuals who
exhibit a particular type of disease or medical condition. Therefore, the PRs can be
used in clinical research to (i) manage patient data, (ii) recruit patients for clinical
trials, (iii) develop drugs for chronic or rare diseases, including cardiovascular
diseases, diabetes, cancer, and arthritis, among others, and (iv) evaluate the subse-
quent patient outcomes. The PRs, however, do not focus on patients and are
purpose-specific as the majority of the PRs are mainly constructed for clinical
research purposes (research-oriented registries) although efforts have been made
toward the establishment of the patient-powered registries[][151] (patient-oriented
registries) to promote the collaboration between the clinicians and the patients.
2.4.2 Health sensors
The health sensors are intelligent wearable or implanted devices that are used for
health monitoring and disease prognosis. The current advances in wireless commu-
nications combined with the rapid development of “smart” biosensors have enabled
the low-cost, continuous monitoring of a patient’s health condition for home reha-
bilitation purposes, as well as the secure transfer of individual-related health infor-
mation through wireless networks, directly to a central data repository for clinical
evaluation and further analysis. The emerging biological microelectromechanical
systems (Bio-MEMS) with organic substrates make use of mechanical and electrical
components to record antigen interactions, nucleic acid interactions, and other
biological fluctuations through analytes that interact with the biosensors to invoke
fluctuations that are recorded by the transducers in the form of electrical (e.g.,
through electrochemical reactions), mechanical (e.g., through stress sensing), or
optical signals (e.g., through fluorescence) [152]. Furthermore, the rapid advances
in nanotechnology have enabled the construction of nanostructured thin films and
nanomaterials [153] (e.g., polymer nanoparticles, gold nanoparticles) for construct-
ing highly sensitive biosensors, in the nanoscale, having a larger number of
bioreceptor units than the typical Bio-MEMS (in the micron scale).
In the majority of the electronic health (e-Health) systems, the patient data are
transferred from the biosensors and through WSNs to a central processing node
(system) for remote monitoring [154]. Furthermore, the health information can be
also displayed to the user’s mobile through appropriate mobile applications that
2.4 Sources of medical data 41
24.
are part ofthe mobile health (m-Health) systems [155]. Health sensors are embedded
into real-time wireless systems that enable the continuous monitoring of the patient’s
physiological activity (e.g., heart rate, respiration rate, body temperature), physical
activity (e.g., motor movement), and mental activity (e.g., sleep patterns) toward the
improvement of the individual’s life quality, the evaluation of a drug’s progress, and
the early diagnosis of symptoms in numerous medical conditions and chronic disor-
ders, such as Parkinson’s disease, diabetes, chronic obstructive pulmonary disease,
and dementia, among many others.
2.4.3 Electronic health records
The electronic health records (EHRs) are digital, individual-level, health records for
the management and analysis of health information [156]. EHRs enable the collec-
tion and structured management of individual-level, health-related data (e.g., labo-
ratory tests, patient history, clinical claims, medical images) and the “true” analysis
of the health information using computerized methods against the traditional PRs
that are purpose-specific and thus focus more on the population characteristics, as
well as on deriving the health information before the collection and analysis of
the health information [156]. EHRs can enhance the clinician’s decision process
regarding the patient outcomes and make the communication between the clinician
and the patient much easier, as well as ensure the safety of the stored medical records
and avoid medical errors during the data entry in digital forms. In addition, the EHRs
can enable the electronic prescription of drugs and promote medical data sharing
through their interconnectivity with other EHR systems toward the establishment
of a global EHRs system. The majority of the national healthcare systems have
already adopted the EHR technology for transforming their traditional PR systems
due to the former’s (proven) positive effectiveness in patient care [156].
The majority of the EHR systems adopt the Health Level 7 (HL7) standard
clinical document architecture (CDA) [157]. The latter is based on a referenced
information model (RIM) that serves as a semantic model that consists of a set of
structural components (e.g., classes with data types) and semantic relations (e.g.,
a healthcare provider “belongs to” an organization where the healthcare provider
is an actor who is represented by a class and has a name, a surname, etc.) that are
used to represent clinical notes in the form of an extensible markup language docu-
ment [157]. The CDA is part of the HL7 version 3 family and uses the RIM as an
object-oriented model to define the actors (e.g., clinicians, healthcare providers),
the clinical document standard terms, and the targets (i.e., patients). CDA can
also include multimedia content, such as medical images. All this information is
organized into a human readable and standardized format that enables the interlink-
ing of EHRs among different clinical centers.
2.4.4 Genome registries
The genome registries are collections (records) of genomic information (e.g.,
biochemical genetic tests) that are stored in large databases [158]. These databases
include molecular-level health information regarding the genes, the chromosomes,
42 CHAPTER 2 Types and sources of medical and other related data
25.
the DNA andRNA sequences, the proteins, the haplotypes, the genotypes, and the
phenotypes, which are related to a specific disease. In addition, these databases
include demographic information that is related to the population characteristics
of the patients so as to study for the effects of drugs in target groups during clinical
trials. The genomic registries can help the clinicians to study the genotypee
phenotype relationships, the genetic profiles of various diseases in a cellular level,
and the SNPs associations with genetic variants and thus can shed light into the
underlying genetic variations in chronic and rare diseases. The sharing of genomic
data between genome registries can help geneticists to comprehend the mecha-
nisms behind genetic disorders and yield clinical decisions with higher statistical
power and thus enhance patient care [158]. Furthermore, similar types of genome
registries can be also generated for other areas of omics studies, such as prote-
omics, lipidomics, transcriptomics, and metabolomics, among others. In addition,
the individual omics registries can be combined together to establish multiomics
registries [159].
2.4.5 Clinical trials
Large pharmaceutical and biotechnological companies conduct large-scale clinical
trials with the purpose of examining and validating the effectiveness of a proposed
drug in a specific group of patients, which is usually referred to as the target group
[160]. This group consists of patients (usually referred to as subjects) who are drawn
from the overall population, fulfilling specific criteria, i.e., under the same medical
condition or disease. The patient selection process is usually based on stringent and
eligibility criteria and is compliant with all the legal, ethical, and patient privacy
requirements. The properly conducted large-scale clinical trials can yield significant
outcomes and pharmaceutical claims regarding the underlying mechanisms of a
disease’s genetic profile, as well as the negative implications of a proposed drug’s
(e.g., toxicities) on the target group. Clinical trials have numerous applications in
cancer and other chronic diseases [161]. Clinical trials can be also part of govern-
mental health plans that envisage to promote patient care toward the development
of new public health policies or the reinforcement of the existing ones. The
outcomes from the small- or medium-scale clinical trials are gathered according
to the case report form (CRF) designing architecture that is based on well-
structured, high-quality, user-friendly questionnaires that summarize the outcomes
of the clinical trial, as well as information regarding the specifications and actors
of the clinical trial in the form of concise questions and prompts [162]. The actors
of the CRF are the investigators that conducted the clinical study and the recipients
are clinicians, programmers, researchers, etc. The CRF content provides population-
related demographic information (e.g., age, sex), patient history (e.g., medical
conditions, smoking history, therapies), personal details (e.g., body weight), and
information regarding the presence of adverse events, among others. In the case
of large-scale clinical studies, the electronic case report form reduces the time effort
needed for data entry and processing.
2.4 Sources of medical data 43
26.
2.4.6 Clinical claims
Clinicalclaims are diagnostic reports from clinicians, general practitioners, and
healthcare stakeholders related to the diagnosis of a patient’s medical condition/dis-
ease or the patient’s outcomes under a specific administered drug. For example, a
clinician can evaluate a patient’s medical condition through the thorough examina-
tion of the patient’s medical images (i.e., imaging reports), laboratory measures (i.e.,
laboratory examination reports), etc. These diagnostic reports can usually be found
in EHR systems or in traditional PRs, as well as in the form of published articles in
international medical journals. Similar to the medical claims, the pharmaceutical
(and biotechnological) claims are clinical trial reports that are derived by pharma-
ceutical and biotechnology companies and health-related stakeholders during
small-, medium-, and large-scale clinical trials, i.e., during drug research, where
the effects (e.g., negative implications) of a proposed drug are extensively studied
on the participating group of subjects, i.e., the target group (see Section 2.4.5 for
more information about clinical trials).
2.4.7 Additional data sources
Additional sources where various medical data can be found are public or private
clinical centers, urban clinics, diagnostic centers, and clinical laboratories, as well
as in social media (e.g., Twitter, Facebook), private or public blogs, and web pages,
through which an individual can post any health-related information. Furthermore, a
variety of different types of medical data have already been made publicly available
by large healthcare platforms and funded projects for promoting clinical research
worldwide, such as the Human Connectome Project, which has made available
fMRI and diffusion neuroimaging data from more than 1000 healthy subjects
[163], and the Entrez Gene database at the National Center for Biotechnology Infor-
mation [][164], which includes more than 7 million gene-specific records (e.g., from
fungi, bacteria, eukaryotes, etc.) since 2010, among many others. Medical data can
also be found in cohort studies that will be extensively discussed separately due to
their clinical significance toward the investigation of a disease’s onset and progress,
against the interventional studies which are often high cost and involve treatment
randomization [43e47].
2.5 Cohorts
2.5.1 Origins
The term “cohort,” which has been extensively used in the field of clinical study
design, has its roots back in the Roman Empire, where the word “cohors” was
used to denote groups of soldiers who were part of a military Roman legion [43].
In synchronous epidemiology, the term “cohort” is used to describe a group of
follow-up individuals who exhibit a common medical condition or a specific type
of rare and/or chronic disease [43e47]. The cohort studies are part of a larger group
44 CHAPTER 2 Types and sources of medical and other related data
27.
of studies, whichare widely known in the literature as analytical (or inferential)
observational studies, along with the caseecontrol and the cross-sectional studies
[43]. An observational study is a specific type of medical study design that mainly
aims to answer important questions regarding a disease’s origins and examine the
descriptive statistics of the population that is under examination. A well-designed
cohort study can be of great clinical importance because it can introduce a temporal
dimension (follow-up) that is able to provide clinical outcomes about a disease’s
prevalence and reveal the associations between the causes and the disease’s
outcomes [45].
The longitudinal cohort studies are of great importance in the vast domain of the
observational cohort studies. A longitudinal cohort study is a special type of obser-
vational study that involves the repetitive collection of patient data over long (or
short) time periods [165]. This is a key characteristic of the longitudinal cohort
studies that enables the accurate examination of differences between the same
patients over the time as the recall biases in patients are reduced along with the
well-known “cohort effect,” which introduces erroneous components in the cohort
(e.g., erroneously parsed ages) [165]. The longitudinal cohort studies can provide
deeper insight on a disease’s progress over time, yielding more accurate risk predic-
tors for the disease under investigation [165]. An example of a longitudinal cohort
study is the prospective cohort study, where the same patients are examined over
time although the longitudinal studies can also take the form of retrospective cohort
studies where the data from patients who have experienced the same medical con-
dition or disease have been already collected for a long time period in the past [165].
In general, the observational studies can either be descriptive or analytical [43].
The former focus more on the examination of a disease’s characteristics either on a
single patient (i.e., a case report study) or on a series of patients (i.e., a case series
study), as well as the disease’s prevalence (i.e., a cross-sectional study). The descrip-
tive observational studies make use of descriptive statistics, such as mean, variance,
etc., to study the population characteristics and identify the causes of a disease or
medical condition. On the other hand, the inferential observational studies include
(i) the cross-sectional studies, which quantify the associations between the causes
and the disease’s outcomes, on a specific time period (i.e., no follow-up information
is recorded), (ii) the caseecontrol studies, which are retrospective studies that
compare the disease prevalence between a case group and a control group, where
the latter is a group of healthy individuals and the former is a group of individuals
that share common disease characteristics, and (iii) the cohort studies that are
prospective or retrospective studies that investigate the associations between the
causes and the disease’s outcomes, as well as the effect of various prognostic factors
(e.g., laboratory measures) on the clinical outcomes [45].
2.5.2 Cohort study design
In cohort studies, the participating individuals (subjects) are selected on their expo-
sure to a specific disease (or medical condition) and according to specific exclusion
2.5 Cohorts 45
28.
criteria that areset during the design of the cohort study. These criteria are important
and comprise the fundamental basis of a cohort study. The exclusion criteria pose
restrictions to minimize the introduction of bias into the cohort study , for example,
to avoid the inclusion of patients that exhibit adverse events due to drug usage [44].
Once all the necessary exclusion criteria have been set, the exposed and unexposed
groups are defined, where both groups are drawn from the same population. The
exposed group comprises the subjects that will be exposed to a particular type of
drug, whereas the control group includes the healthy ones (in the absence of any
clinical outcome) and serve as the reference group. The drug exposure time may
vary from weeks or months, depending on the initial hypothesis of the cohort study.
The fact that a cohort study is designed to investigate the disease versus the outcome
(e.g., a symptom such as fever) associations, on a temporal basis, can reveal signif-
icant information regarding the disease’s onset and progress over the time.
In the meantime, the association between the drug exposure and the outcome
can be measured in terms of the RR [46]. The RR quantifies the chance that the
outcome is increased or decreased by the drug exposure and is defined as the ratio
between an incidence in the exposed group versus the incidence in the reference
group. A cohort study is finalized either when the drug exposure timescale comes
to an end or when the expected outcomes are fulfilled [43e45]. Other quite similar
measures include the HR, the risk difference (RD), and the odds ratio (OR). HR
corresponds to the hazard of death after treatment and is used to measure the
frequency of death between the drug-exposed group and the reference group
[47]. OR measures the odds that the outcome of interest will occur given the
drug exposure against the opposite and is mostly used in cross-sectional and casee
control studies where the RR cannot be estimated [166]. Finally, RD is defined as
the difference between an incidence in the exposed group and an incidence in the
reference group [167]. The absolute risk reduction is also used to measure whether
the outcome of interest is increased by the drug exposure. In multivariate statistics,
a 2x2 cross-tabulation table (or contingency table) [168] is usually used to compute
the risk measures through the examination of the associations between the out-
comes and the groups.
A cohort study can either use prospective or retrospective data. The difference
between the prospective and retrospective cohort studies lies on the fact that, on
the former, the cohort data are expected to be updated across time, where a temporal
dimension is used to keep track of the upcoming data (on a patient basis), whereas on
the latter, the cohort data are not expected to be updated in the future. This means
that in prospective (where “pro” denotes future) cohort studies, the clinical informa-
tion can be collected both at baseline and during follow-up, where multiple reoccur-
rences of the same symptom(s) might exist. On the other hand, in retrospective
(where “retro” denotes past) cohort studies, the clinical researchers analyze the
association between the exposures and the disease’s prevalence using past patient
data. Thus, in a retrospective cohort study, the starting point begins from the present
and “looks back” in time, whereas in a prospective cohort study, the starting point
begins from the present and “looks ahead.”
46 CHAPTER 2 Types and sources of medical and other related data
29.
2.5.3 Comparison withother study designs
The cohort studies can address several limitations that are present in the randomized
clinical trials, which are part of the interventional studies [160]. The cohort studies
[43e45] (i) can involve a large number of patients who are often followed for a large
timescale (i.e., longitudinal cohort studies) instead of the clinical trials where the
tracking of new patient data is often lost and the sensitive population groups (e.g.,
the children) are often excluded from the experiments, (ii) can measure patient-
specific outcomes instead of surrogate end points, (iii) do not use single-blind or
double-blind procedures, where the tracking of the subjects in the exposure group
is partially or completely lost, (iv) are less expensive than large-scale clinical trials,
and (v) are easier for the subjects to be part of instead of the clinical trials where the
subjects are often ambiguous. The cohort studies do not always involve any exper-
imentation with the subjects in terms of treatment randomization and the mandatory
use of placebos or other interventions for the control groups. The cohorts, however,
could be used for conducting low-cost, realistic clinical trials.
In a cohort study, the different types of medical data can be either prospective or
retrospective and thus can be collected both at baseline and during follow-up,
including data collected in the past, as well. The caseecontrol studies share a com-
mon basis with the retrospective cohort studies, where the analysis of the disease
versus outcome associations involves the analysis of the data that have been already
collected in the past (Fig. 2.1). In addition, in the cross-sectional studies, the inves-
tigation of the disease versus outcome associations occurs only in the presence, i.e.,
at a single time point (Fig. 2.1). The clinical significance of a cohort study can be
met in the special case where the exposure is a rare condition, such as a chronic
disease. In that case, a cohort study can be a powerful tool. Understanding a
disease’s onset and progress over time can address clinical unmet needs, such as
FIGURE 2.1
An illustration of the temporal dimension for each type of observational studies.
2.5 Cohorts 47
30.
the early identificationof high-risk individuals (patient stratification), the discovery
of new targeted therapeutic treatments, and the development of new public health
policies for promoting healthcare worldwide.
2.6 Big data in medicine
Under the ages of our rapidly advancing technological era, the vast amount of daily
generated digital data has led to a scientific breakthrough with huge benefits in many
fields of our everyday lives including finance, medicine, and industry [1e6]. The
term “big data” has been extensively used to characterize these massively accumu-
lated datasets, which are mainly characterized by the four V’s [1e6]: (i) volume, (ii)
velocity, (iii) veracity, and (iv) variety, where each dimension has a unique scope.
The “volume” dimension refers to the massive amounts of collected data elements,
whereas the “velocity” refers to the speed of the continuously generated data flows.
The “veracity” dimension refers to the biases that are introduced during the data
collection process, and the “variety” refers to the different types of data sources
(e.g., different formats, structural differences). The definition of big data overcomes
the classic definition of the ordinary datasets, which is only limited to their size (i.e.,
volume). Big data is a promising tool that provides broader and more comprehensive
insight from large data elements, a fact that greatly enhances their impact in various
scientific and research areas, especially in healthcare. However, the size of the
collected data and the speed of the data generation process, combined with the
different types and the complexity of the big data, are crucial challenges that still
need to be addressed by the scientific community.
Currently, there are many types of big data in healthcare. More specifically,
medical big data can be found in the medical imaging domain, where the thin-
slice technology that has already been adopted by the modern diagnostic imaging
scanners (e.g., CT, MRI, OCT) is able to capture thousands (2000 slices) of
high-quality (in terms of spatial and temporal resolution) slices of different body
parts, in a very small amount of time. In addition, in the field of genomic analysis,
the advances in HTS technology has led to the NGS or second-generation
sequencing technology that is able to capture the entire human genome (which
consists of 30,000e35,000 genes), producing millions of DNA and RNA sequences.
Moreover, in the field of biomedical signal analysis, the continuous, high-resolution
monitoring (e.g., for days or even weeks) of a patient’s physiological, mental, or
physical activity produces large amounts of recorded waveforms that consist of
thousands of samples per second.
The application of big data in healthcare is promising and with many benefits.
The vast amount of generated data can improve the statistical power of the conven-
tional methods for data analytics including data mining and predictive modeling.
Furthermore, the big data can boost the clinical decision-making process and yield
clinical outcomes with higher statistical power (i.e., higher scientific impact due to
the large number of participating subjects) and improved accuracy [1e6]. As a
48 CHAPTER 2 Types and sources of medical and other related data
31.
result, the patientcare will be greatly improved as the patients will avoid the risk of
unnecessary surgery operations, as well as the negative implications of unnecessary
(or even false) drug administration. Big data can enhance the performance of tradi-
tional machine learning methods, giving rise to a field that is known in computer
science as deep learning [1e6], a modern technique that makes use of multilayer
neural networks that are able to capture valuable patterns and associations that are
hidden between the large data elements, such as in multislice medical images,
omics, biomedical signals, etc. For example, the high-resolution, multidimensional,
four-dimensional medical images, such as the PET images that can capture addi-
tional information regarding the metabolic effects of a radioisotope apart from the
anatomic structure, or the fMRI images that can depict the brain activations under
a specific physical activity, can greatly enhance the accuracy of clinical diagnosis.
The application of big data in medicine can also enhance the patient stratification
process according to which straightforward machine learning methods can be
applied to identify and discriminate high-risk individuals from large populations
[1e6], i.e., groups of patients having high risk for the development of a type of
malignancy, such as lymphoma. This will also yield significant improvements in
personalized medicine for the selection of appropriate therapies by taking into
consideration molecular-level health information. Furthermore, the multivariate
analysis of large population groups can also reveal significant statistical associations
between the disease’s manifestations and different demographic factors, such as age,
gender, etc., and other medication related factors. Moreover, the outcomes from
large-scale clinical trials and clinical research studies that make use of big data
from large populations can enable the development of new, low-cost, targeted ther-
apies for chronic and rare diseases, as well as the development of new public health
policies toward a global and sustainable healthcare system.
The software advancements toward the development of methods for big data
analytics are an emerging field. The current software advancements in neuroimaging
have led to the voxel-wise analysis of hundreds of thousands of voxels (100,000)
within the human brain yielding large-scale similarity matrices, i.e., brain networks,
which are able to simulate the brain activations across different ROIs, yielding
millions of connections between the voxels [169]. These large-scale networks
have been widely used to study the brain activation patterns during resting state
or under specific physical and mental tasks [170]. Furthermore, the analysis of omics
big data using high-computing resources can reveal important clinical information
concerning the genetic variants and cellular functionalities in different types of
diseases, as well as assist the development of effective drugs with reduced implica-
tions in the participating subjects. A great example can be found in the field of inter-
actomics [171], where the PPI networks are constructed, on a cellular basis, to study
the stable and transient interactions among proteins [107]. In addition, in signal anal-
ysis, the applications of deep learning methods for the prediction of disease
outcomes have shown significant performance yielding high sensitivity and low
specificity scores in numerous cases, such as the prediction of epileptic events
[172], among others.
2.6 Big data in medicine 49
32.
Understanding big datais a difficult and demanding task for researchers and data
analysts. With the growing number of large volumes of daily generated data from
health sensors, social media posts, medical images, laboratory tests, electronic
patient records, blogs, and web pages, the estimated amount of data is expected to
overcome the zettabyte (1021 gigabytes) and even the yottabyte (1024 gigabytes)
[35]. Therefore, the development of straightforward software architectures along
with hardware components and computer-aided tools and systems toward the effi-
cient storage, management, quality assessment, high-performance computing anal-
ysis, and visualization of big data is a constant and increasing demand. For example,
in medical imaging analysis, emphasis must be given to the development of methods
for big data compression (e.g., image compression), registration and mapping of
thousands of slices, and methods for segmentation of anatomical structures across
these slices. A scientific researcher who is able to understand the nature (e.g., the
data patterns) of big data can discover new opportunities for the development of
new methods for big data analytics.
There is no doubt that the benefits of big data in healthcare are many. However,
there are several technical and clinical challenges that still need to be addressed. The
main challenge is the fact that the sources of big data are disparate, heterogeneous,
and costly, a fact that increases the computational complexity of handling large
volumes of data, as well as hampers the application of traditional statistical and
machine learning methods for big data analytics. In addition, the big data are often
incomplete with several discrepancies due to the lack of a global protocol for big
data acquisition. As a result, data standardization methods need to be adopted to
overcome this structural heterogeneity. Moreover, the big data are difficult to
manage due to their size and structural complexity. Furthermore, the risk of data
misuse is increased in big data with the data quality assessment process being a
significant challenge along with the lack of the researcher’s skills that might hamper
the quality of the data yielding unreliable outcomes. The big data are often prone to
the existence of missing values and measurement errors throughout their context,
which pose significant obstacles toward their effective analysis. As a result, the
irrational use of machine learning methods for predictive modeling in large datasets
might lead to false outcomes, with no clinical importance at all.
There are also privacy issues that lurk behind the use of big data [35]. Ethical and
legal issues must be carefully taken into consideration during the collection and
processing of big medical data from multiple data sources. As the big data are large
collections of patient data, it is difficult and even impossible to obtain signed
informed consent forms from every single patient. In addition, the large volume
of medical data shall not be stored in centralized databases as the risk for data abuse
is greatly increased. Therefore, the data should be stored in cloud environments that
are compliant with data protection regulations and should be collected under appro-
priate data protection agreements based on international privacy and protection stan-
dards. The researchers and data analysts must be fully aware of the data protection
regulations during the collection and processing of the data. Furthermore, there is an
increased necessity toward the development of machine learning methods for
50 CHAPTER 2 Types and sources of medical and other related data
33.
analyzing data thatare distributed in multiple sites, a fact that remains a great chal-
lenge (see Chapter 7 for methods that deal with the analysis of distributed data).
2.7 Conclusions
The medical domain has been overwhelmed by the big data. The dramatic increase
in the speed of the data collection process along with the large volumes of accumu-
lated data from dispersed data sources has led to a scientific breakthrough, especially
in healthcare. The types of big data in healthcare are many (Fig. 2.2), varying from
medical images and laboratory tests to biosignals and omics. The volume size in
each type of data varies from megabytes (e.g., the size of the data in the laboratory
tests depends on the number of samples, and the size of the recorded biosignals
depends on the sampling frequency and the time duration) to gigabytes (e.g., the
size of medical images depends on the pixel depth and the number of slices) and
even Terabytes (e.g., the size of omics data depends on the type of sequencing) of
generated data. The mining of knowledge from big data can shed light into the unmet
needs of various diseases and lead to the development of more effective treatments
and public health policies. In addition, the rapid advances in volume-rendering
methods have led to 3D medical image reconstruction, a method that has signifi-
cantly improved the quality of image interpretation during the clinical diagnosis.
Moreover, the coregistration of different types of medical images, such as
PET-CT and SPECT-CT, can significantly enhance the diagnostic accuracy through
the construction of images that combine both high spatial resolution and temporal
information regarding the metabolic effects of the organs. Meanwhile, the current
advances in thin slicing technology have enabled the acquisition of thousands of
slices, in short time, yielding images with high spatial resolution from different parts
of the human body. Powerful 10.5T MRI scanners have been also constructed (i.e.,
the one located at the Center for Magnetic Resonance Research [173]) to further
enhance the image resolution. Apart from the fusion of medical images, the high
temporal resolution of the biomedical signals can be also combined with medical
imaging systems, such as MRI and CT, to provide both high spatial and temporal
information.
The evolution of NGS has enabled the parallel generation of millions of
sequences, yielding powerful RNA and DNA sequencers that are able to study the
whole transcriptome and even generate the genetic profiles of the whole human
microbiome. This breakthrough has shed light into the mechanisms of cancer cells,
the genetic profiles of various microorganisms, the genetic variants in different
diseases, and the gene regulation in different tissues and organs. In addition, the
advances in lipidomics and proteomics have made the identification of lipids and
proteins much easier and have provided great insight on their importance in gene
regulation. Modern techniques, such as microarray analysis, MS, and TLC, have
offered many capabilities toward the examination of proteins, lipids, and the meta-
bolic changes in biological cells in inflammatory and neurodegenerative diseases.
2.7 Conclusions 51
34.
FIGURE 2.2
A summaryof the types of big data in healthcare along with the volume dimension.
35.
Furthermore, the applicationof Graph Theory has enabled the construction of PPI
networks to understand the associations between the proteins and the identification
of proteins with similar functional characteristics. Meanwhile, the NGS technology
in the field of epigenomics has also enabled the examination of the implications of
different pathological factors in the whole-genome expression.
The advances of the postgenomic era aim at providing straightforward tools
toward the analysis and interpretation of the different omics data types. These ad-
vances are referred to as additional spans of the omics field, including [174]
(i) the phylogenomics that involves the development of computational methods
for the prediction of gene function using gene sequencing data, (ii) the physiomics
that uses Graph Theory to construct networks that represent the interactions between
genes so as to identify highly associated genes and predict the gene function, (iii) the
pharmacogenomics that studies the effect of drugs on the gene function by
computing the associations between SNPs and drug substances, (iv) the interactom-
ics that uses Graph Theory to construct networks that represent the interactions
between proteins (PPIs) and genes as well, and (v) the nutrigenomics that studies
the implication of nutrition in gene function, among others. In addition, the construc-
tion of multiomics registries that are able to combine the uniqueness of every indi-
vidual omics registry can provide great insight toward the analysis of the whole
genome, the genetic profiling, and shed light into the underlying mechanisms of
rare viruses and chronic disorders.
As far as the laboratory tests are concerned, the hematological analyzers that are
widely used to analyze the chemical compounds of the blood cells can provide great
insight on blood clotting disorders, inflammatory disorders, and blood cancer, as
well as check-up information through the measurement of the HCT level, the
WBC and RBCs, the cholesterol levels, and the glucose levels, among others. The
coagulation analyzers can provide additional information regarding the thrombin
and prothrombin time and blood clotting time, based on optical detection methods.
Histological and immunological analyzers using powerful optical and electron
microscopes along with the chemiluminescence effect (based on the IHC) can
provide valuable information regarding the existence of pathological factors on
different types of tissue specimens that are obtained using sectional approaches
from (e.g., epithelial) and thus test for the existence of tumor cells (through color
changes) or not. The traditional urine strips in urinalysis can reveal urinary
deficiencies and the use of drug substances, as well as, prostate cancer and various
kidney and liver disorders. Moreover, the direct fluorescent test that is used in sero-
logical analyzers can detect the presence of antigens on tissue antibodies and thus
confirm the existence of specific compounds in the tissue sample for the detection
of fungal and rubella infections and autoimmune disorders, among others. Finally,
the endocrine tests can reveal important clinical information regarding the endocrine
gland function by measuring the hormone levels, where high hormone levels denote
the existence of endocrine gland dysfunction that can be expressed by endocrine
tumors or other disorders.
2.7 Conclusions 53
36.
The retrospective andprospective cohort studies are able to overpass several
limitations that are introduced by caseecontrol studies, clinical trial studies, and
cross-sectional studies. The temporal dimension that is present in the prospective
cohort studies can yield important information regarding the disease’s onset and evo-
lution over the time, as well as reveal valuable information that is related to the disease
versus outcome associations. In addition, the fact that the cohort studies are patient-
specific and composed of groups of individuals who share a common disease or a
medical condition along with the ability to track follow-up data can address the unmet
needs in rare and autoimmune diseases toward more effective therapeutic treatments
and health policies, as well as better prediction models toward the identification of
high-risk individuals who are more prone to the development of a malignancy or a
pathological condition. Cohort studies have been used in a variety of diseases
including heart failure [175], Alzheimer’s disease [176], rheumatoid arthritis [177],
diabetes [178], epilepsy [179], and breast cancer [180], among many others.
Several laboratories and clinical centers, however, use their own measurement
units, a fact that hampers the coanalysis of their data with those from other labora-
tories and clinical centers, as well as the concept of data sharing. Moreover, the
structural heterogeneity of the acquired medical data introduces crucial biases
toward the effective analysis of medical data, and thus emphasis must be given on
the development of new automated methods and international guidelines for data
standardization and harmonization. The ethical and legal compliance of the data
acquisition procedures are of great importance. All the necessary consent forms
must be signed by the individuals, a fact that is difficult or even impossible in the
case of big data as the data sources are often dispersed. Data protection agreements
are also important toward the sharing of medical data. Security compromise is also a
serious threat. Having all these large volumes of data stored in centralized databases
poses significant threats for data abuse, and additional emphasis must be given on
the compliance with data security standards. Thus, emphasis must be given on the
development of distributed databases with security measures to ensure the confiden-
tiality of the data.
The fact that the profile of the big data is complex, with multiple and dispersed
data sources and different data formats, hampers the application of the traditional
approaches for data management and analytics. The sources of medical data are
many (Fig. 2.3), including PRs, EHRs, genome registries, clinical centers, social
media posts, and clinical claims, to name but a few, and thus the variety of these
disparate sources pose several issues regarding the structural heterogeneities that
are introduced during the analysis of such data. This is a crucial barrier that high-
lights the need for the development of new software architectures along with
high-performance computational resources that are able to deal with big data man-
agement, analysis, and visualization. In addition, before the application of cohort
studies and clinical trials, the researchers and data analysts must be able to under-
stand the structure of the big data so as to avoid any data misuse and biases that
are introduced during the data preprocessing stage, as well as during the statistical
analysis procedure. Furthermore, the researchers and data analysts must be well
54 CHAPTER 2 Types and sources of medical and other related data
aware of theethical and legal issues that are posed by the international data protec-
tion regulations. Although the current efforts are very promising, additional
emphasis must be given on the development of global data acquisition standards
for the different types of medical data, toward medical data sharing and database
federation.
References
[1] Raghupathi W, Raghupathi V. Big data analytics in healthcare: promise and potential.
Health Inf Sci Syst 2014;2(1):3.
[2] Lee CH, Yoon HJ. Medical big data: promise and challenges. Kidn Res Clin Pract
2017;36(1):3.
[3] Krumholz HM. Big data and new knowledge in medicine: the thinking, training, and
tools needed for a learning health system. Health Aff 2014;33(7):1163e70.
[4] Belle A, Thiagarajan R, Soroushmehr SM, Navidi F, Beard DA, Najarian K. Big data
analytics in healthcare. BioMed Res Int 2015;2015,370194.
[5] Obermeyer Z, Emanuel EJ. Predicting the futuredbig data, machine learning, and
clinical medicine. N Engl J Med 2016;375(13):1216.
[6] Bates DW, Saria S, Ohno-Machado L, Shah A, Escobar G. Big data in health care: us-
ing analytics to identify and manage high-risk and high-cost patients. Health Aff 2014;
33(7):1123e31.
[7] AlGhatrif M, Lindsay J. A brief review: history to understand fundamentals of
electrocardiography. J Community Hosp Intern Med Perspect 2012;2(1):14383.
[8] Britton JW, Frey LC, Hopp JL, Korb P, Koubeissi MZ, Lievens WE, et al. Electroen-
cephalography (EEG): an introductory text and atlas of normal and abnormal findings
in adults, children, and infants. Chicago: American Epilepsy Society; 2016.
[9] Hari R, Salmelin R. Magnetoencephalography: from SQUIDs to neuroscience: neuro-
image 20th anniversary special edition. Neuroimage 2012;61(2):386e96.
[10] Mills KR. The basics of electromyography. J Neurol Neurosurg Psychiatry 2005;
76(Suppl. 2):ii32e5.
[11] Usakli AB, Gurkan S, Aloise F, Vecchiato G, Babiloni F. On the use of electrooculo-
gram for efficient human computer interfaces. Comput Intell Neurosci 2010;2010:1.
[12] Khadivi KO. Computed tomography: fundamentals, system technology, image quality,
applications. Med Phys 2006;33(8):3076.
[13] Hashemi RH, Bradley WG, Lisanti CJ. MRI: the basics. Lippincott Williams Wil-
kins; 2010.
[14] Saha GB. Basics of PET imaging: physics, chemistry, and regulations. New York:
Springer; 2016.
[15] Wernick MN, Aarsvold JN. Emission tomography: the fundamentals of PET and
SPECT. Elsevier; 2004.
[16] Ulmer S, Jansen O, editors. fMRI: basics and clinical applications. Berlin: Springer-
Verlag; 2010.
[17] Chan V, Perlas A. Basics of ultrasound imaging. In: Atlas of ultrasound-guided proced-
ures in interventional pain management. New York: Springer; 2011. p. 13e9.
[18] Mallidi S, Luke GP, Emelianov S. Photoacoustic imaging in cancer detection, diag-
nosis, and treatment guidance. Trends Biotechnol 2011;29(5):213e21.
56 CHAPTER 2 Types and sources of medical and other related data
39.
[19] Ferrari M,Quaresima V. A brief review on the history of human functional near-
infrared spectroscopy (fNIRS) development and fields of application. Neuroimage
2012;63(2):921e35.
[20] Griffiths AJF, Miller JH, Suzuki DT, Lewontin RC, Gelbart WM. An introduction to
genetic analysis. 7th ed. New York: W. H. Freeman; 2000 Available from: http://
www.ncbi.nlm.nih.gov/books/NBK21766/.
[21] Yang K, Han X. Lipidomics: techniques, applications, and outcomes related to
biomedical sciences. Trends Biochem Sci 2016;41(11):954e69.
[22] Aslam B, Basit M, Nisar MA, Khurshid M, Rasool MH. Proteomics: technologies and
their applications. J Chromatogr Sci 2017;55(2):182e96.
[23] Tzoulaki I, Ebbels TM, Valdes A, Elliott P, Ioannidis JP. Design and analysis of metab-
olomics studies in epidemiologic research: a primer on-omic technologies. Am J Epi-
demiol 2014;180(2):129e39.
[24] Shukla SK, Murali NS, Brilliant MH. Personalized medicine going precise: from ge-
nomics to microbiomics. Trends Mol Med 2015;21(8):461e2.
[25] Jones PA, Baylin SB. The epigenomics of cancer. Cell 2007;128(4):683e92.
[26] Lowe R, Shirley N, Bleackley M, Dolan S, Shafee T. Transcriptomics technologies.
PLoS Comput Biol 2017;13(5):e1005457.
[27] Metzker ML. Sequencing technologies e the next generation. Nat Rev Genet 2010;
11(1):31.
[28] Ozsolak F, Milos PM. RNA sequencing: advances, challenges and opportunities. Nat
Rev Genet 2011;12(2):87.
[29] Lavinder JJ, Horton AP, Georgiou G, Ippolito GC. Next-generation sequencing and
protein mass spectrometry for the comprehensive analysis of human cellular and serum
antibody repertoires. Curr Opin Chem Biol 2015;24:112e20.
[30] Fuchs B, Süß R, Teuber K, Eibisch M, Schiller J. Lipid analysis by thin-layer chroma-
tography e a review of the current state. J Chromatogr A 2011;1218(19):2754e74.
[31] Ljosa V, Carpenter AE. Introduction to the quantitative analysis of two-dimensional
fluorescence microscopy images for cell-based screening. PLoS Comput Biol 2009;
5(12):e1000603.
[32] Wang D, Bodovitz S. Single cell analysis: the new frontier in ‘omics’. Trends Bio-
technol 2010;28(6):281e90.
[33] Polak JM, Van Noorden S, editors. Immunocytochemistry: practical applications in pa-
thology and biology. Butterworth-Heinemann; 2014.
[34] Dabbs DJ. Diagnostic immunohistochemistry E-book: theranostic and genomic
applications. Elsevier Health Sciences; 2017.
[35] Greene CS, Tan J, Ung M, Moore JH, Cheng C. Big data bioinformatics. J Cell Physiol
2014;229(12):1896e900.
[36] Ashley EA, Niebauer J. Conquering the ECG. In: Cardiology explained. England:
Remedica; 2004.
[37] Teplan M. Fundamentals of EEG measurement. Meas Sci Rev 2002;2(2):1e11.
[38] Pan X, Sidky EY, Vannier M. Why do commercial CT scanners still employ traditional,
filtered back-projection for image reconstruction? Inverse Probl 2009;25(12):123009.
[39] Gordon R, Bender R, Herman GT. Algebraic reconstruction techniques (ART) for
three-dimensional electron microscopy and X-ray photography. J Theor Biol 1970;
29(3):471e81.
References 57
40.
[40] Abeida H,Zhang Q, Li J, Merabtine N. Iterative sparse asymptotic minimum variance
based approaches for array processing. IEEE Trans Signal Process 2013;61(4):
933e44.
[41] Xu M, Wang LV. Universal back-projection algorithm for photoacoustic computed
tomography. Phys Rev 2005;71(1):016706.
[42] Hegde P, Qi R, Abernathy K, Gay C, Dharap S, Gaspard R, et al. A concise guide to
cDNA microarray analysis. Biotechniques 2000;29(3):548e63.
[43] Song JW, Chung KC. Observational studies: cohort and case-control studies. Plast
Reconstr Surg 2010;126(6):2234.
[44] Gamble JM. An introduction to the fundamentals of cohort and caseecontrol studies.
Can J Hosp Pharm 2014;67(5):366.
[45] Süt N. Study designs in medicine. Balkan Med J 2014;31(4):273.
[46] Robbins AS, Chao SY, Fonseca VP. What’s the relative risk? A method to directly es-
timate risk ratios in cohort studies of common outcomes. Ann Epidemiol 2002;12(7):
452e4.
[47] Kim HY. Statistical notes for clinical researchers: risk difference, risk ratio, and odds
ratio. Restor Dent Endod 2017;42(1):72e6.
[48] McNutt LA, Wu C, Xue X, Hafner JP. Estimating the relative risk in cohort studies and
clinical trials of common outcomes. Am J Epidemiol 2003;157(10):940e3.
[49] Buzsaki G. Rhythms of the brain. Oxford University Press; 2006.
[50] Kropotov JD. Quantitative EEG, event-related potentials and neurotherapy. Academic
Press; 2010.
[51] Nishida K, Morishima Y, Yoshimura M, Isotani T, Irisawa S, Jann K, et al. EEG mi-
crostates associated with salience and frontoparietal networks in frontotemporal de-
mentia, schizophrenia and Alzheimer’s disease. Clin Neurophysiol 2013;124(6):
1106e14.
[52] Kindler J, Hubl D, Strik WK, Dierks T, König T. Resting-state EEG in schizophrenia:
auditory verbal hallucinations are related to shortening of specific microstates. Clin
Neurophysiol 2011;122(6):1179e82.
[53] Penolazzi B, Spironelli C, Vio C, Angrilli A. Brain plasticity in developmental
dyslexia after phonological treatment: a beta EEG band study. Behav Brain Res
2010;209(1):179e82.
[54] Proudfoot M, Woolrich MW, Nobre AC, Turner MR. Magnetoencephalography. Pract
Neurol 2014;14(5):336e43.
[55] Kharkar S, Knowlton R. Magnetoencephalography in the presurgical evaluation of
epilepsy. Epilepsy Behav 2015;46:19e26.
[56] Stam CJ. Use of magnetoencephalography (MEG) to study functional brain networks
in neurodegenerative disorders. J Neurol Sci 2010;289(1e2):128e34.
[57] Preston DC, Shapiro BE. Electromyography and neuromuscular disorders E-book:
clinical-electrophysiologic correlations (expert consult-online). Elsevier Health Sci-
ences; 2012.
[58] Sartori M, Reggiani M, Farina D, Lloyd DG. EMG-driven forward-dynamic estimation
of muscle force and joint moment about multiple degrees of freedom in the human
lower extremity. PLoS One 2012;7(12):e52618.
[59] Hsu WY, Lin CH, Hsu HJ, Chen PH, Chen IR. Wavelet-based envelope features with
automatic EOG artifact removal: application to single-trial EEG data. Expert Syst
Appl 2012;39(3):2743e9.
58 CHAPTER 2 Types and sources of medical and other related data
41.
[60] Deng LY,Hsu CL, Lin TC, Tuan JS, Chang SM. EOG-based Human-Computer Inter-
face system development. Expert Syst Appl 2010;37(4):3337e43.
[61] Szirmai A, Keller B. Electronystagmographic analysis of caloric test parameters in
vestibular disorders. Eur Arch Oto-Rhino-Laryngol 2013;270(1):87e91.
[62] Holm H, Gudbjartsson DF, Arnar DO, Thorleifsson G, Thorgeirsson G,
Stefansdottir H, et al. Several common variants modulate heart rate, PR interval and
QRS duration. Nat Genet 2010;42(2):117.
[63] Khorrami H, Moavenian M. A comparative study of DWT, CWTand DCT transforma-
tions in ECG arrhythmias classification. Expert Syst Appl 2010;37(8):5751e7.
[64] Acharya UR, Fujita H, Lih OS, Adam M, Tan JH, Chua CK. Automated detection of
coronary artery disease using different durations of ECG segments with convolutional
neural network. Knowl Based Syst 2017;132:62e71.
[65] Emmanuel BS. A review of signal processing techniques for heart sound analysis in
clinical diagnosis. J Med Eng Technol 2012;36(6):303e7.
[66] Konishi E, Kawasaki T, Shiraishi H, Yamano M, Kamitani T. Additional heart sounds
during early diastole in a patient with hypertrophic cardiomyopathy and atrioventric-
ular block. J Cardiol Cases 2015;11(6):171e4.
[67] Kumar SBB, Jagannath M. Analysis of phonocardiogram signal for biometric identi-
fication system. In: Proceedings of the 2015 IEEE International Conference on Perva-
sive Computing (ICPC); 2015. p. 1e4.
[68] Hill NJ, Gupta D, Brunner P, Gunduz A, Adamo MA, Ritaccio A, et al. Recording hu-
man electrocorticographic (ECoG) signals for neuroscientific research and real-time
functional cortical mapping. J Vis Exp 2012;64.
[69] Tripathi M, Garg A, Gaikwad S, Bal CS, Chitra S, Prasad K, et al. Intra-operative elec-
trocorticography in lesional epilepsy. Epilepsy Res 2010;89(1):133e41.
[70] Picht T, Schmidt S, Brandt S, Frey D, Hannula H, Neuvonen T, et al. Preoperative func-
tional mapping for rolandic brain tumor surgery: comparison of navigated transcranial
magnetic stimulation to direct cortical stimulation. Neurosurgery 2011;69(3):581e9.
[71] Lusic H, Grinstaff MW. X-ray-computed tomography contrast agents. Chem Rev
2012;113(3):1641e66.
[72] Auer M, Gasser TC. Reconstruction and finite element mesh generation of abdominal
aortic aneurysms from computerized tomography angiography data with minimal user
interactions. IEEE Trans Med Imaging 2010;29(4):1022e8.
[73] Herman GT, Kuba A, editors. Discrete tomography: foundations, algorithms, and
applications. New York: Springer Science Business Media; 2012.
[74] Miglioretti DL, Johnson E, Williams A, Greenlee RT, Weinmann S, Solberg LI, et al.
The use of computed tomography in pediatrics and the associated radiation exposure
and estimated cancer risk. JAMA Pediatr 2013;167(8):700e7.
[75] Poser BA, Koopmans PJ, Witzel T, Wald LL, Barth M. Three dimensional echo-planar
imaging at 7 Tesla. Neuroimage 2010;51(1):261e6.
[76] Yang H, Zhuang Y, Sun Y, Dai A, Shi X, Wu D, et al. Targeted dual-contrast T1-and
T2-weighted magnetic resonance imaging of tumors using multifunctional
gadolinium-labeled superparamagnetic iron oxide nanoparticles. Biomaterials 2011;
32(20):4584e93.
[77] Gordillo N, Montseny E, Sobrevilla P. State of the art survey on MRI brain tumor
segmentation. Magn Reson Imag 2013;31(8):1426e38.
References 59
42.
[78] Tsili AC,Argyropoulou MI, Giannakis D, Sofikitis N, Tsampoulas K. MRI in the char-
acterization and local staging of testicular neoplasms. Am J Roentgenol 2010;194(3):
682e9.
[79] Del Grande F, Carrino JA, Del Grande M, Mammen AL, Stine LC. Magnetic resonance
imaging of inflammatory myopathies. Top Magn Reson Imaging 2011;22(2):39e43.
[80] Khoo MM, Tyler PA, Saifuddin A, Padhani AR. Diffusion-weighted imaging (DWI) in
musculoskeletal MRI: a critical review. Skelet Radiol 2011;40(6):665e81.
[81] Basser PJ, Pierpaoli C. Microstructural and physiological features of tissues elucidated
by quantitative-diffusion-tensor MRI. J Magn Reson 2011;213(2):560e70.
[82] Barch DM, Burgess GC, Harms MP, Petersen SE, Schlaggar BL, Corbetta M, et al.
Function in the human connectome: task-fMRI and individual differences in
behavior. Neuroimage 2013;80:169e89.
[83] Formaggio E, Storti SF, Bertoldo A, Manganotti P, Fiaschi A, Toffolo GM. Integrating
EEG and fMRI in epilepsy. Neuroimage 2011;54(4):2719e31.
[84] Han D, Yu J, Yu Y, Zhang G, Zhong X, Lu J, He W. Comparison of 18F-
fluorothymidine and 18F-fluorodeoxyglucose PET/CT in delineating gross tumor vol-
ume by optimal threshold in patients with squamous cell carcinoma of thoracic
esophagus. Int J Radiat Oncol Biol Phys 2010;76(4):1235e41.
[85] Boss A, Bisdas S, Kolb A, Hofmann M, Ernemann U, Claussen CD. Hybrid PET/MRI
of intracranial masses: initial experiences and comparison to PET/CT. J Nucl Med
2010;51(8):1198.
[86] Hutton BF, Buvat I, Beekman FJ. Review and current status of SPECT scatter
correction. Phys Med Biol 2011;56(14):R85.
[87] Wang Y, Qin L, Shi X, Zeng Y, Jing H, Schoepf UJ, et al. Adenosine-stress dynamic
myocardial perfusion imaging with second-generation dual-source CT: comparison
with conventional catheter coronary angiography and SPECT nuclear myocardial
perfusion imaging. Am J Roentgenol 2012;198(3):521e9.
[88] Zhou Y, Chakraborty S, Liu S. Radiolabeled cyclic RGD peptides as radiotracers for
imaging tumors and thrombosis by SPECT. Theranostics 2011;1:58.
[89] Willeumier KC, Taylor DV, Amen DG. Elevated BMI is associated with decreased
blood flow in the prefrontal cortex using SPECT imaging in healthy adults. Obesity
2011;19(5):1095e7.
[90] Izatt JA, Choma MA, Dhalla AH. Theory of optical coherence tomography. Cham:
Springer; 2015.
[91] Jia Y, Wei E, Wang X, Zhang X, Morrison JC, Parikh M, et al. Optical coherence to-
mography angiography of optic disc perfusion in glaucoma. Ophthalmology 2014;
121(7):1322e32.
[92] Jia H, Abtahian F, Aguirre AD, Lee S, Chia S, Lowe H, et al. In vivo diagnosis of pla-
que erosion and calcified nodule in patients with acute coronary syndrome by intravas-
cular optical coherence tomography. J Am Coll Cardiol 2013;62(19):1748e58.
[93] Kirtane TS, Wagh MS. Endoscopic optical coherence tomography (OCT): advances in
gastrointestinal imaging. Gastroenterol Res Pract 2014;2014:376367.
[94] Sutoko S, Sato H, Maki A, Kiguchi M, Hirabayashi Y, Atsumori H, et al. Tutorial on
platform for optical topography analysis tools. Neurophotonics 2016;3(1):010801.
[95] Eierud C, Craddock RC, Fletcher S, Aulakh M, King-Casas B, Kuehl D, et al. Neuro-
imaging after mild traumatic brain injury: review and meta-analysis. Neuroimage Clin
2014;4:283e94.
60 CHAPTER 2 Types and sources of medical and other related data
43.
[96] Leff DR,Orihuela-Espina F, Elwell CE, Athanasiou T, Delpy DT, Darzi AW, et al.
Assessment of the cerebral cortex during motor task behaviours in adults: a systematic
review of functional near infrared spectroscopy (fNIRS) studies. Neuroimage 2011;
54(4):2922e36.
[97] Abramowicz JS. Benefits and risks of ultrasound in pregnancy. Semin Perinatol 2013;
37(5):295e300.
[98] Biswas M, Sudhakar S, Nanda NC, Buckberg G, Pradhan M, Roomi AU, et al. Two-
and three-dimensional speckle tracking echocardiography: clinical applications and
future directions. Echocardiography 2013;30(1):88e105.
[99] Räber L, Taniwaki M, Zaugg S, Kelbæk H, Roffi M, Holmvang L, et al. Effect of high-
intensity statin therapy on atherosclerosis in non-infarct-related coronary arteries
(IBIS-4): a serial intravascular ultrasonography study. Eur Heart J 2014;36(8):
490e500.
[100] Wong CS, McNicholas N, Healy D, Clarke-Moloney M, Coffey JC, Grace PA, et al.
A systematic review of preoperative duplex ultrasonography and arteriovenous fistula
formation. J Vasc Surg 2013;57(4):1129e33.
[101] Salonen JT, Salonen R. Ultrasound B-mode imaging in observational studies of athero-
sclerotic progression. Circulation 1993;87(3 Suppl):II56e65.
[102] Beard P. Biomedical photoacoustic imaging. Interface Focus 2011;1(4):602e31.
[103] Wang X, Pang Y, Ku G, Xie X, Stoica G, Wang LV. Noninvasive laser-induced photo-
acoustic tomography for structural and functional in vivo imaging of the brain. Nat
Biotechnol 2003;21(7):803.
[104] Devlin TM. Textbook of biochemistry. John Wiley Sons; 2011.
[105] Seeb JE, Carvalho G, Hauser L, Naish K, Roberts S, Seeb LW. Single-nucleotide poly-
morphism (SNP) discovery and applications of SNP genotyping in nonmodel
organisms. Mol Ecol Resour 2011;11:1e8.
[106] Sager M, Yeat NC, Pajaro-Van der Stadt S, Lin C, Ren Q, Lin J. Transcriptomics in
cancer diagnostics: developments in technology, clinical research and
commercialization. Expert Rev Mol Diagn 2015;15(12):1589e603.
[107] Nepusz T, Yu H, Paccanaro A. Detecting overlapping protein complexes in protein-
protein interaction networks. Nat Methods 2012;9(5):471.
[108] Mazereeuw G, Herrmann N, Bennett SA, Swardfager W, Xu H, Valenzuela N, et al.
Platelet activating factors in depression and coronary artery disease: a potential
biomarker related to inflammatory mechanisms and neurodegeneration. Neurosci Bio-
behav Rev 2013;37(8):1611e21.
[109] Wishart DS. Emerging applications of metabolomics in drug discovery and precision
medicine. Nat Rev Drug Discov 2016;15(7):473.
[110] Buermans HPJ, Den Dunnen JT. Next generation sequencing technology: advances
and applications. Biochim Biophys Acta 2014;1842(10):1932e41.
[111] Bernstein BE, Stamatoyannopoulos JA, Costello JF, Ren B, Milosavljevic A,
Meissner A, et al. The NIH roadmap epigenomics mapping consortium. Nat Bio-
technol 2010;28(10):1045.
[112] Sandoval J, Esteller M. Cancer epigenomics: beyond genomics. Curr Opin Genet Dev
2012;22(1):50e5.
[113] Hoffman R, Benz Jr EJ, Silberstein LE, Heslop H, Anastasi J, Weitz J. Hematology:
basic principles and practice. Elsevier Health Sciences; 2013.
[114] Hillman RS, Ault KA, Rinder HM. Hematology in clinical practice, (LANGE clinical
medicine). New York: McGraw-Hill; 2011.
References 61
44.
[115] Wu X.Urinalysis: a review of methods and procedures. Crit Care Nurs Clin 2010;
22(1):121e8.
[116] Gratzke C, Bachmann A, Descazeaud A, Drake MJ, Madersbacher S, Mamoulakis C,
et al. EAU guidelines on the assessment of non-neurogenic male lower urinary tract
symptoms including benign prostatic obstruction. Eur Urol 2015;67(6):1099e109.
[117] Wine Y, Horton AP, Ippolito GC, Georgiou G. Serology in the 21st century: the
molecular-level analysis of the serum antibody repertoire. Curr Opin Immunol
2015;35:89e97.
[118] Guarner J, Brandt ME. Histopathologic diagnosis of fungal infections in the 21st
century. Clin Microbiol Rev 2011;24(2):247e80.
[119] Triplett DA. Coagulation and bleeding disorders: review and update. Clin Chem 2000;
46(8):1260e9.
[120] Peckham M. Histology at a glance, vol. 50. John Wiley Sons; 2011.
[121] Öberg K, Castellano D. Current knowledge on diagnosis and staging of neuroendo-
crine tumors. Cancer Metastasis Rev 2011;30(1):3e7.
[122] Delves PJ, Martin SJ, Burton DR, Roitt IM. Essential immunology. John Wiley
Sons; 2017.
[123] Chandrashekara S. The treatment strategies of autoimmune disease may need a
different approach from conventional protocol: a review. Indian J Pharmacol 2012;
44(6):665.
[124] Helfand M, Mahon SM, Eden KB, Frame PS, Orleans CT. Screening for skin cancer.
Am J Prev Med 2001;20(3):47e58.
[125] Heinzerling L, Mari A, Bergmann KC, Bresciani M, Burbach G, Darsow U, et al. The
skin prick testeEuropean standards. Clin Transl Allergy 2013;3(1):3.
[126] Greenstein B, Wood DF. The endocrine system at a glance. John Wiley Sons; 2011.
[127] Yu J. Endocrine disorders and the neurologic manifestations. Ann Pediatr Endocrinol
Metab 2014;19(4):184.
[128] Spence N. Electrical impedance measurement as an endpoint detection method for
routine coagulation tests. Br J Biomed Sci 2002;59(4):223e7.
[129] Adan A, Alizada G, Kiraz Y, Baran Y, Nalbant A. Flow cytometry: basic principles and
applications. Crit Rev Biotechnol 2017;37(2):163e76.
[130] Rose HH. Optics of high-performance electron microscopes. Sci Technol Adv Mater
2008;9(1):014107.
[131] Parmigiani G, Garrett ES, Irizarry RA, Zeger SL. The analysis of gene expression data:
an overview of methods and software. New York: Springer; 2003.
[132] Cinquanta L, Fontana DE, Bizzaro N. Chemiluminescent immunoassay technology:
what does it change in autoantibody detection? Auto Immun Highlights 2017;8(1):9.
[133] Odell ID, Cook D. Optimizing direct immunofluorescence. Methods in molecular
biology (methods and protocols), vol. 1180. New York: Humana Press; 2014.
[134] Aydin S. A short history, principles, and types of ELISA, and our laboratory experi-
ence with peptide/protein analyses using ELISA. Peptides 2015;72:4e15.
[135] Knopp T, Kunis S, Potts D. A note on the iterative MRI reconstruction from nonuni-
form k-space data. Int J Biomed Imaging 2007;2007:24727.
[136] Srinivasan S, Pogue BW, Carpenter C, Yalavarthy PK, Paulsen K. A boundary element
approach for image-guided near-infrared absorption and scatter estimation. Med Phys
2007;34(11):4545e57.
[137] Larobina M, Murino L. Medical image file formats. J Digit Imaging 2014;27(2):
200e6.
62 CHAPTER 2 Types and sources of medical and other related data
45.
[138] Gorgolewski KJ,Auer T, Calhoun VD, Craddock RC, Das S, Duff EP, et al. The brain
imaging data structure, a format for organizing and describing outputs of neuroimag-
ing experiments. Sci Data 2016;3:160044.
[139] Mazurenka M, Di Sieno L, Boso G, Contini D, Pifferi A, Dalla Mora A, et al. Non-
contact in vivo diffuse optical imaging using a time-gated scanning system. Biomed
Opt Express 2013;4(10):2257e68.
[140] Sanger F, Nicklen S, Coulson AR. DNA sequencing with chain-terminating inhibitors.
Proc Natl Acad Sci USA 1977;74(12):5463e7.
[141] Maxam AM, Gilbert W. A new method for sequencing DNA. Proc Natl Acad Sci USA
1977;74(2):560e4.
[142] Harrington CT, Lin EI, Olson MT, Eshleman JR. Fundamentals of pyrosequencing.
Arch Pathol Lab Med 2013;137(9):1296e303.
[143] Bronner IF, Quail MA, Turner DJ, Swerdlow H. Improved protocols for illumina
sequencing. Curr Protoc Hum Genet 2014;21(80). 18.2.1-42.
[144] Cock PJ, Fields CJ, Goto N, Heuer ML, Rice PM. The Sanger FASTQ file format for
sequences with quality scores, and the Solexa/Illumina FASTQ variants. Nucleic
Acids Res 2009;38(6):1767e71.
[145] Leinonen R, Sugawara H, Shumway M. The sequence read archive. Nucleic Acids Res
2011;39:D19e21.
[146] Ishizu H, Siomi H, Siomi MC. Biology of PIWI-interacting RNAs: new insights into
biogenesis and function inside and outside of germlines. Genes Dev 2012;26(21):
2361e73.
[147] Yamamoto M, Wakatsuki T, Hada A, Ryo A. Use of serial analysis of gene expression
(SAGE) technology. J Immunol Methods 2001;250(1e2):45e66.
[148] Takahashi H, Kato S, Murata M, Carninci P. CAGE (cap analysis of gene expression):
a protocol for the detection of promoter and transcriptional networks. Humana Press;
2012.
[149] Singh G, Pratt G, Yeo GW, Moore MJ. The clothes make the mRNA: past and present
trends in mRNP fashion. Annu Rev Biochem 2015;84:325e54.
[150] Workman TA. Engaging patients in information sharing and data collection: the role of
patient-powered registries and research networks. Rockville (MD): Agency for
Healthcare Research and Quality (US); 2013.
[151] Fleurence RL, Beal AC, Sheridan SE, Johnson LB, Selby JV. Patient-powered research
networks aim to improve patient care and health research. Health Aff 2014;33(7):
1212e9.
[152] Bashir R. BioMEMS: state-of-the-art in detection, opportunities and prospects. Adv
Drug Deliv Rev 2004;56(11):1565e86.
[153] Holzinger M, Le Goff A, Cosnier S. Nanomaterials for biosensing applications: a
review. Front Chem 2014;2:63.
[154] Black AD, Car J, Pagliari C, Anandan C, Cresswell K, Bokun T, et al. The impact of
eHealth on the quality and safety of health care: a systematic overview. PLoS Med
2011;8(1):e1000387.
[155] Kay M, Santos J, Takane M. mHealth: new horizons for health through mobile
technologies. World Health Organ 2011;64(7):66e71.
[156] Häyrinen K, Saranto K, Nykänen P. Definition, structure, content, use and impacts of
electronic health records: a review of the research literature. Int J Med Inform 2008;
77(5):291e304.
References 63
46.
[157] Dolin RH,Alschuler L, Beebe C, Biron PV, Boyer SL, Essin D, et al. The HL7 clinical
document architecture. J Am Med Assoc 2001;8(6):552e69.
[158] Rubinstein WS, Maglott DR, Lee JM, Kattman BL, Malheiro AJ, Ovetsky M, et al.
The NIH genetic testing registry: a new, centralized database of genetic tests to enable
access to comprehensive information and improve transparency. Nucleic Acids Res
2012;41(D1):D925e35.
[159] Hasin Y, Seldin M, Lusis A. Multi-omics approaches to disease. Genome Biol 2017;
18(1):83.
[160] Umscheid CA, Margolis DJ, Grossman CE. Key concepts of clinical trials: a narrative
review. Postgrad Med 2011;123(5):194e204.
[161] Unger JM, Cook E, Tai E, Bleyer A. The role of clinical trial participation in cancer
research: barriers, evidence, and strategies. Am Soc Clin Oncol Educ Book 2016;
36:185e98.
[162] Bellary S, Krishnankutty B, Latha MS. Basics of case report form designing in clinical
research. Perspect Clin Res 2014;5(4):159e66.
[163] Van Essen DC, Smith SM, Barch DM, Behrens TE, Yacoub E, Ugurbil K. The Wu-
Minn human connectome project: an overview. Neuroimage 2013;80:62e79.
[164] Maglott D, Ostell J, Pruitt KD, Tatusova T. Entrez gene: gene-centered information at
NCBI. Nucleic Acids Res 2005;33(Suppl. l_1):D54e8.
[165] Caruana EJ, Roman M, Hernández-Sánchez J, Solli P. Longitudinal studies. J Thorac
Dis 2015;7(11):E537e40.
[166] Szumilas M. Explaining odds ratios. J Can Acad Child Adolesc Psychiatry 2010;19(3):
227e9.
[167] Austin PC. The performance of different propensity-score methods for estimating dif-
ferences in proportions (risk differences or absolute risk reductions) in observational
studies. Stat Med 2010;29(20):2137e48.
[168] Olivier J, Bell ML. Effect sizes for 2 2 contingency tables. PLoS One 2013;8(3):
e58777.
[169] Rubinov M, Sporns O. Complex network measures of brain connectivity: uses and
interpretations. Neuroimage 2010;52(3):1059e69.
[170] Glasser MF, Coalson TS, Robinson EC, Hacker CD, Harwell J, Yacoub E, et al.
A multi-modal parcellation of human cerebral cortex. Nature 2016;536(7615):171e8.
[171] De Las Rivas J, Fontanillo C. Proteineprotein interactions essentials: key concepts to
building and analyzing interactome networks. PLoS Comput Biol 2010;6(6):
e1000807.
[172] Tsiouris KM, Pezoulas VC, Zervakis M, Konitsiotis S, Koutsouris DD, Fotiadis DI.
A long short-term memory deep learning network for the prediction of epileptic sei-
zures using EEG signals. Comput Biol Med 2018;99:24e37.
[173] Eryaman Y, Zhang P, Utecht L, Kose K, Lagore RL, DelaBarre L, et al. Investigating
the physiological effects of 10.5 Tesla static field exposure on anesthetized swine.
Magn Reson Med 2018;79:511e4.
[174] Lindon JC, Nicholson JK, Holmes E, editors. The handbook of metabonomics and
metabolomics. Elsevier; 2011.
[175] Christensen S, Mogelvang R, Heitmann M, Prescott E. Level of education and risk of
heart failure: a prospective cohort study with echocardiography evaluation. Eur Heart J
2010;32(4):450e8.
64 CHAPTER 2 Types and sources of medical and other related data
47.
[176] Vos SJ,Xiong C, Visser PJ, Jasielec MS, Hassenstab J, Grant EA, et al. Preclinical Alz-
heimer’s disease and its outcome: a longitudinal cohort study. Lancet Neurol 2013;
12(10):957e65.
[177] Hyldgaard C, Hilberg O, Pedersen AB, Ulrichsen SP, Løkke A, Bendstrup E, et al.
A population-based cohort study of rheumatoid arthritis-associated interstitial lung
disease: comorbidity and mortality. Ann Rheum Dis 2017;76(10):1700e6.
[178] Driver JA, Smith A, Buring JE, Gaziano JM, Kurth T, Logroscino G. Prospective
cohort study of type 2 diabetes and the risk of Parkinson’s disease. Diabetes Care
2008;31(10):2003e5.
[179] Shorvon SD, Goodridge DM. Longitudinal cohort studies of the prognosis of epilepsy:
contribution of the National General Practice Study of Epilepsy and other studies.
Brain 2013;136(11):3497e510.
[180] Kuehn T, Bauerfeind I, Fehm T, Fleige B, Hausschild M, Helms G, et al. Sentinel-
lymph-node biopsy in patients with breast cancer before and after neoadjuvant chemo-
therapy (SENTINA): a prospective, multicentre cohort study. Lancet Oncol 2013;
14(7):609e18.
References 65
![2.1 Overview
In our rapidly advancing technological area, the large volumes of accumulated data,
on a daily basis, yield many benefits in different areas of our everyday lives
including finance, medicine, and industry, among others [1e3]. These large-scale
datasets are referred to as big data. The big data are characterized by four dimen-
sions, namely the volume, the velocity, the veracity, and the variety [1e6]. The speed
of the daily generated data, the amounts of collected data, the different types of
collected data, and the biases that are introduced during the data collection process
are the fundamental characteristics of the big data against the traditional datasets,
which are only characterized by one dimension, i.e., their volume. The big data in
medicine can improve the patient care through the enhancement of the clinical
decision-making process, as well as enhance the statistical power of the clinical
research studies yielding more accurate outcomes and powerful prediction models
[1e6]. Furthermore, the big data can further enhance the development of effective
patient stratification methods toward the identification of sensitive population
subgroups, as well as provide better insights on large population groups toward
the development of new public health policies and targeted therapeutic treatments.
There are many types of big data in medicine. These types of data vary from
biosignals and medical images to laboratory tests and omics data. The biosignals
are produced by the electrical activity that arises from the biological function of
the organs in the human body. Examples of the most common types of biosignals
include the electrocardiogram (ECG) [7], which records the electrical activity as a
result of the heart’s depolarization and repolarization function, the electroencephalo-
gram (EEG) [8], which records the changes in the electrical activity as a result of the
neural activation (i.e., the electrical field from the extracellular currents), along with
the magnetoencephalogram (MEG) [9], which measures the changes in the ensuing
magnetic field (from the intracellular currents), the electromyogram (EMG) [10],
which records the changes in the electrical activity as a result of the muscles contrac-
tion, the electrooculogram (EOG) [11], which records the corneoretinal potential as
a result of the eye movement, etc. The biosignals yield high temporal information
regarding a disease’s onset and progress, with numerous applications in medical
conditions and diseases that vary from amnesia and schizophrenia to heart failure,
myopathy, and Parkinson’s disease [5].
The medical images comprise another type of medical data with significant
importance in clinical diagnosis and screening procedures. Computerized tomogra-
phy (CT) [12] scans, and magnetic resonance imaging (MRI) [13] scans, can provide
detailed insight on the anatomic and tissue characteristics of different body parts,
yielding high spatial information, and are useful in the detection of malignancies
and other disorders. Furthermore, the positron emission tomography (PET) [14]
scans, the single-photon emission tomography (SPECT) [15] scans, and the func-
tional magnetic resonance imaging (fMRI) [16] scans provide additional informa-
tion regarding the biological and physiological operations, i.e., the metabolic
processes, at a molecular level, as well as the brain activations under specific
20 CHAPTER 2 Types and sources of medical and other related data](https://image.slidesharecdn.com/pezoulas2020-250416102837-4cafedd0/75/Chapter-2-of-Medical-Data-Health-Records-2-2048.jpg)
![physical and mental tasks. Furthermore, ultrasound [17] and photoacoustic [18]
images are fast, nonionizing, real-time methods that are based on acoustic proper-
ties, having numerous applications in echocardiography, obstetric ultrasonography
(US), intravascular US, and duplex US, among others. Spectroscopy-based methods,
such as the functional near-infrared spectroscopy (fNIRS) [19], can also shed light
into the measurement of the metabolic rate of oxygen consumption, which indicates
a neural activation, similar to the fMRI.
The field of omics constitutes another vast domain of medical data with
numerous subfields, such as the fields of genomics [20], lipidomics [21], proteomics
[22], metabolomics [23], microbiomics [24], epigenomics [25], and transcriptomics
[26], among others. The omics data can be generated from high-throughput
next-generation sequencing (NGS) technologies [27], such as ribonucleic acid
(RNA)-sequence analysis [28], mass spectrometry (MS) [29], and thin-layer
chromatography (TLC) [30], which are able to analyze the proteins, lipids, transcrip-
tomes, metabolic profiles of the biological cells, microorganisms in the tissues,
pathological factors, and even whole human genome. The RNA-sequence analyzers
are able to capture all the single cellebased (or even group-based) RNA molecules
(i.e., the whole transcriptome). In addition, MS technology is able to reveal the struc-
tural and functional characteristics of proteins, as well as identify the lipids and their
involvements in cell functionality. Omics can be used to study a variety of
molecular-level functions, including the examination of bacteria and fungi on the
tissues and organs, the interactions between the proteins, the detection of patholog-
ical factors and metabolic effects in degenerative and chronic diseases, and gene
expression analysis, among others.
The laboratory tests along with the medical claims and the subscribed medica-
tions can offer a powerful basis for understanding the underlying mechanisms of
a virus and detecting various pathological conditions in tissue specimens. The
most common laboratory tests include the hematological tests, the serological tests,
the skin tests, the histopathological tests, the immunological tests, the endocrine
function tests, and the coagulation tests, among others. Straightforward methods,
such as microscopic analysis [31], fluoroscopy [32], immunocytochemistry (ICH)
[33], and immunohistochemistry (IHC) [34], are used to analyze the tissue and blood
samples. Each test offers a unique insight on a medical condition or a disease toward
the detection of blood clotting disorders, tumors, anemia, diabetes, fungal infections,
autoimmune disorders, skin cancer, allergies, inflammatory disorders, and endocrine
dysfunctions, among many others.
The sources of medical data are many. With the growing number of large volumes
of daily generated data from health sensors, medical images, laboratory tests, elec-
tronic patient records, patient registries (PRs), clinical and pharmaceutical claims,
and genome registries, the estimated amount of data is expected to overcome the zetta-
byte (1021 gigabytes) and even the yottabyte (1024 gigabytes) [1,35]. The medical data
acquisition process is often conducted according to international standards and proto-
cols for each type of medical data. For example, in signal acquisition, well-known
international standards are used for the placement of surface electrodes, such as the
2.1 Overview 21](https://image.slidesharecdn.com/pezoulas2020-250416102837-4cafedd0/75/Chapter-2-of-Medical-Data-Health-Records-3-2048.jpg)
![12-lead placement [7,36] for ECG signal acquisition and the International “10e20”
system (and “10e5” system) [37] for EEG signal acquisition. In laboratory tests,
hemodynamic, coagulation, serological, and immunoassay analyzers are most
commonly used for measuring biochemical (e.g., blood pressure, blood clotting
time) and pathological factors (e.g., the presence of antigens in the antibodies), as
well as analyzing tissue specimens (e.g., for skin cancer, endocrine disorders), under
different measurement units. Medical image acquisition protocols are also used for the
reconstruction of MRI, CT, fMRI, PET, and SPECT images, such as the filtered back-
projection (FBP) algorithm [38], the family of the iterative reconstruction algorithms,
such as the algebraic reconstruction algorithm [39], and the iterative sparse asymptotic
minimum variance (SAMV) algorithm [40], as well as the universal backprojection
algorithm [41] for ultrasound imaging reconstruction, toward the examination of
tissues and organs for tumors and other disorders. In the field of omics, standard
methods, such as the microarray analysis [42], the RNA-sequencing analysis [28],
MS [29], TLC [30], along with the high-throughput NGS technology [27], are widely
used in omics to study the proteins interactions, the genetic profiles, and metabolic
effects of different viruses, lipids, whole transcriptome, and genetic profiles of the
human microbiome, among many others.
A research-oriented source of medical data with high clinical significance is the
cohorts. Cohort studies are special types of observational studies [43] that are used to
examine a disease’s origins and the effects of the population characteristics [44]. The
longitudinal cohort studies are observational studies that involve the repetitive
collection of patient data over long (or short) periods of time and are able to provide
deeper insight on the disease progress over time with increased accuracy, over-
coming recall biases [43,44]. In general, a cohort study can use either retrospective
or prospective data. The retrospective cohort studies make use of data that have been
already collected with the purpose of identifying the association between the causes
(symptoms) and the disease’s outcomes [45]. On the other hand, the temporal dimen-
sion that is introduced by the prospective cohort studies (i.e., the follow-up data) can
reveal significant associations between the disease’s outcomes and the causes of the
disease, as well as the effects of various prognostic factors on the outcomes over
time. The risk ratio (RR) and the hazard ratio (HR) are mainly used to quantify
the associations between the drug exposure and the outcomes, as well as the
frequency of death, as a ratio between the exposed group and reference (or control)
group [46,47]. The former includes the subjects that are exposed on a specific drug,
whereas the latter consists of healthy individuals. Cohort studies are able to over-
come several limitations that are present in traditional clinical trial studies by
(i) measuring patient-specific outcomes from large population groups, (ii) keeping
track of follow-up patient data, and (iii) being less expensive than large-scale clinical
trials [48]. An example of the clinical importance of a cohort study lies on the fact
that it can address the unmet needs in the special case where the exposure is a rare
condition, such as an autoimmune disease [43,44]. In practice, a well-designed
cohort study can provide deep insight into the underlying mechanisms of a disease’s
onset and progress.
22 CHAPTER 2 Types and sources of medical and other related data](https://image.slidesharecdn.com/pezoulas2020-250416102837-4cafedd0/75/Chapter-2-of-Medical-Data-Health-Records-4-2048.jpg)
![2.2 Types of medical data
Below we provide some details on the sources of data mentioned above.
2.2.1 Biosignals
The biosignals are produced by the electrical activity that arises from the biological
activity that takes place within different tissues and organs of the human body. The
most common types of methods that are currently used to record biosignals in clin-
ical research are presented below along with a brief description of their functionality
and related clinical applications.
• EEG signals: these types of signals are produced by the electrical activity of the
brain cells. When a neuron fires, an action potential is generated as a result of
the exchange of ions that occurs inside and outside the neuron’s cell [8]. This
causes an alteration in the electrical charge from negative to positive and thus
generates an ionic current (extracellular current) that is then propagated through
the neuronal axons to other neurons, and as a result an electrical field is
generated. This field is propagated throughout the brain and can be recorded by
electrodes that are placed around the scalp. EEG signals consist of various brain
rhythms (brainwaves) including delta (0.3e4 Hz), theta (4e8 Hz), alpha
(8e14 Hz), beta (14e30 Hz), and gamma (>30 Hz), with each one having a
clinical importance in disease and pathological diagnosis [49]. EEG signals
have been extensively used in clinical research to study potential fluctuations
under specific events (i.e., event-related potentials [ERPs]) [50], as well as in
various pathologies including epilepsy [51], schizophrenia [52], dyslexia [53],
and dementia [52].
• MEG signals: these types of signals are produced by the magnetic fields that are
generated by the electrical activity of the brain cells. The electrical activity that
is generated by the neuronal triggering produces an extremely weak magnetic
field (as a result of intracellular current flow) that can be only recorded by
powerful magnetometers, known as superconducting quantum interference
devices (SQUIDs) [9]. SQUIDs are usually placed in liquid helium and are able
to capture the extremely small alterations in the brain’s magnetic field
(w1015 T), when the Earth’s magnetic field varies between 104 and 105 T
[54]. For this reason, the MEG examination is performed inside magnetically
shielded rooms to shield out the inference of outside magnetic fields [9]. The
main advantage of MEG against EEG is that the former is not affected by the
electrical field’s distortion during its propagation through the skull, scalp, and
cerebrospinal fluid. Thus, the MEG yields both higher spatial and temporal
resolution [9]. However, the MEG equipment is very expensive due to its
superconducting technology and is often subject to high noise levels. MEG has
been used for the examination of neocortical epilepsy regions due to its high
spatial resolution [55], amnesia [56], etc.
2.2 Types of medical data 23](https://image.slidesharecdn.com/pezoulas2020-250416102837-4cafedd0/75/Chapter-2-of-Medical-Data-Health-Records-5-2048.jpg)
![• EMG signals: these types of signals are produced by the electric currents that are
generated by the muscle contraction. The depolarization and repolarization of
the skeletal muscle produces a difference in the electrical potential within the
muscle cells (i.e., an electrical field), which propagates throughout the muscle
fiber [10]. The electrical activity of the selected muscle is detected by surface
electrodes. A needle is often used to stimulate the skeletal muscles, yielding the
single motor unit action potential (SMUAP) with an amplitude of 300e400 mV.
EMG signals are used to detect anomalies in the activity of the muscles,
including myopathy and neuropathy [57], as well as in biomechanics for the
development of body prosthetics [58].
• EOG signals: these types of signals are produced by the electric potential that is
generated by the cornea and the retinal activity during eye movement. A typical
EOG records the electrical field that is produced by the difference between the
cornea’s positive potential and the retina’s negative potential, i.e., the cor-
neoretinal potential, with an amplitude from 0.4 to 1 mV [11]. EOG has been
used as a method for removing ocular artifacts in other biosignals, such as EEG
[59], as well as for studying the eye movement in humanecomputer interaction
systems [60]. Other relevant procedures include the electronystagmography []
[61] that records the eye movement during nystagmus.
• ECG or EKG signals: these types of signals record the electrical activity that
arises from the depolarization and repolarization activity of the heart [7]. A
typical ECG records the P wave as a result of the right atrium’s activation
(80 ms), the QRS complex (120 ms) as a result of the depolarization
between the left and the right ventricles, the T wave (160 ms) as a result of the
repolarization of the right and the left ventricles, and finally the U wave as a
result of the repolarization of the interventricular septum [7]. The intervals
between the waves can be used as indications of abnormal heart activity, e.g., a
prolonged PR interval from the atrial activation to the beginning of the
ventricular activation might indicate heart failure [62] and a wide QRS complex
might denote both left and right bundle branch block [62]. Furthermore, ECGs
have been widely used for studying arrhythmias [63], coronary artery disease
[64], and other heart failure conditions.
• Phonocardiography (PCG) signals: these types of acoustic signals record the
sounds that are produced by the heart’s beat and the blood flow (murmurs)
between the heart valves [65]. PCGs have the same origins as ECGs, and they
have been used to study abnormalities on heart sound for the detection of heart
defects (e.g., cardiomyopathy) [66], as well as for biometric identification [67].
• Electrocorticography (ECoG) signals: these types of signals can directly capture
the extracellular currents that are produced by the electrical activity of the brain
cells within the cerebral cortex [68]. ECoG signals have been widely used to
localize epileptic zones before epileptic surgery with very high precision [69] and
for the localization of activated brain regions using motor- or somatosensory-
evoked potentials through a procedure that is known as electrical cortical stim-
ulation [][70]. ECoG signals yield high temporal resolutions, and their invasive
24 CHAPTER 2 Types and sources of medical and other related data](https://image.slidesharecdn.com/pezoulas2020-250416102837-4cafedd0/75/Chapter-2-of-Medical-Data-Health-Records-6-2048.jpg)
![nature, however, involves surgical operation procedures, a fact that makes it
difficult to obtain with the exception of heavy medical conditions.
In all types of biosignals, the sampling frequency (or sampling rate) and the
recording duration are directly proportional to the size of the acquired data and
the speed of data acquisition process. For the majority of the biosignals, the modern
recording systems use sampling frequencies that may vary from 50 to 500 Hz to
1 kHz and even 10 kHz (i.e., 10,000 samples per second). According to the signal
recording time (e.g., on an hourly basis or on a daily basis) and the number of
bits used for encoding the samples (e.g., 8 bits), the data size may vary from MB
(megabyte) to even GB (gigabyte) of digitized signal data. For example, the ECG
biosensors for patient monitoring can record the activity of the heart for hours or
weeks with sampling rates that vary in 50e250 Hz, yielding huge amounts of accu-
mulated data (e.g., a system with a sampling rate 250Hz can record more than 21
million samples per day).
2.2.2 Medical images
The medical images can be obtained by a variety of diagnostic imaging modalities or
systems. Widely used sources of medical images in clinical research include the
computerized axial tomography (CAT), MRI, fMRI, PET, SPECT, the optical coher-
ence tomography (OCT), fNRIS, the US imaging, and the photoacoustic imaging,
where each type of medical image has a unique clinical meaning. The origins and
applications of these types of medical images in clinical research are summarized
below:
• X-ray CT or CAT: a medical tomographic imaging technique that uses X-rays
(ionizing radiation) to construct highly detailed cross-sectional images
(slices) of different body parts [12]. An X-ray tube produces X-rays that are
passed through the patient’s body parts (in parallel, fan, or cone shape), yielding
radiation intensities (projections) that carry information regarding the structure
of the examined body part [12]. The whole system is placed into a gantry that is
able to generate projections around the body, which are captured by the X-ray
detectors as electrical signals. The structural image is finally reconstructed
using a special computer software. Multiple images can be obtained according
to the scanner’s ability to generate multiple cross-sectional images (i.e., the slice
thickness). CT scanners have high spatial resolution and are able to detect
fluctuations in small area units yielding clinical images with high anatomic
detail [12]. Contrast agents can be also injected into the body to observe changes
between normal and abnormal tissues (lesions) [71], as well as track the arterial
blood flow (angiography) to examine for blood vessel diseases, such as aneu-
rysms [72]. However, the radiation level that is followed by a CT scan is large
enough and shall not exceed certain levels. CT scans have been widely used in
clinical research for the three-dimensional (3D) reconstruction of the arteries,
heart, and other organs [73] and cancer treatment [74], among others.
2.2 Types of medical data 25](https://image.slidesharecdn.com/pezoulas2020-250416102837-4cafedd0/75/Chapter-2-of-Medical-Data-Health-Records-7-2048.jpg)
![• MRI: a nuclear medical imaging technique that uses strong electromagnetic
fields to excite the hydrogen atoms in the body and produce cross-sectional
images highlighting the structure of the tissues in different planes [13]. The
hydrogen atoms are excited using radiofrequency (RF) pulses that are emitted in
a specific frequency range (i.e., the Larmor frequency), yielding an energy
release from the nuclei of the hydrogen atoms in the form of RF signals [13].
The latter are recorded by RF detectors. As the hydrogen atoms have different
magnetic characteristics in different tissues, the MRI scanner is able to capture
various pathological conditions inside the organs of the body in the complete
absence of ionized radiation. Echo-planar imaging is usually used to obtain
multiple slices with a single RF excitation pulses, in almost milliseconds,
overcoming motion artifacts [75]. Popular types of contrast MR images include
the T1-weighted images that are produced using a short repetition time between
the RF pulses, yielding images with good anatomic information, and the
T2-weighted images that are produced using a long repetition time between the
RF pulses, yielding images with high tissue detail, which are useful for the
detection of tumors [76]. A practitioner can configure the contrast of the MR
scanner (i.e., the T1/T2 ratio) to construct images that can be used to detect
benign or malignant tumors [77], neoplasms [78], inflammatory myopathies
[79], etc. An emerging MRI-based technique is diffusion weighted imaging,
which is based on the motion of the water molecules in the human body [80]. A
similar approach is the diffusion tensor imaging, which enables the examination
of the brain’s white matter tracts and fiber tracking by computing the diffusion
tensors that describe the diffusion anisotropy per pixel [81].
• fMRI: a straightforward medical imaging technique that is based on the princi-
ples of MRI but offers an additional new temporal dimension that accounts for
the changes in the blood’s oxygen levels, i.e., the blood oxygen levele
dependent contrast mechanism [16]. When a neuron fires, the blood flow on the
neuron’s region is increased, a fact that alters the concentration of oxygen in the
hemoglobin (HBC). The change in the oxygenation state of HBC alters the
strong surrounding magnetic field that is applied. The fMRI BOLD contrast
mechanism is able to capture these fluctuations in the magnetic field and thus
provides functional information regarding the activation of different neuronal
regions according to different tasks. Although the fMRI is both spatially and
temporarily limited, it can enable the mapping of different activities of the
human body, such as sensory, motor, processing, memory, cognition, emotion,
speech, and language tasks with brain regions [82], as well as for the detection
of brain regions that are activated during epilepsy [83].
• PET: a molecular-level medical imaging technique that makes use of positron-
emitting radioactive isotopes to detect the photons that are produced as a
result of the radioactive decay of the positrons during their interaction with an
important biological molecule, such as amino acids [14]. The radioactive decay
is recorded by the PET detectors. Thus, the PET scan can track the position of
the isotopes and provide significant clinical information regarding the
26 CHAPTER 2 Types and sources of medical and other related data](https://image.slidesharecdn.com/pezoulas2020-250416102837-4cafedd0/75/Chapter-2-of-Medical-Data-Health-Records-8-2048.jpg)
![biological and physiological operations, i.e., the metabolic processes, at a
molecular level, from different angles. Thus, the PET scan can record the
temporal evolution of undergoing molecular-level interactions, e.g., the degree
of the nucleic acid uptake and absorption as well as from other tracers too, a
process known as compound labeling. PET scans are extensively used in clinical
oncology to reveal the biochemical characteristics of tumors using the flur-
odeoxyglucose as a radioactive isotope, based on the fact that the glucose
molecules are highly susceptible by tumors [84]. PET scans can be also
combined with CT scans yielding the hybrid PET-CT scan that can provide
images that combine both anatomic and functional information regarding
biochemical and physiological conditions [85].
• SPECT: a medical tomographic imaging technique that is based on the principles
of PET to detect gamma ray photons that are emitted by radionuclides using a
scintillation camera to produce a 3D radioactivity distribution [15]. The SPECT
scan records the distribution of the radionuclide uptake within the body, i.e., the
radioactivity distribution, from different angles and thus provides functional
information from multiple projections regarding the uptake of the radionuclides
from the organs. SPECT uses typical radionuclides that do not emit positrons in
the case of PET where highly expensive, short half-life radioisotopes are used,
which are generated inside radionuclide generators. SPECT can be combined
with CT to reduce the noise levels that are often introduced by the scattering of
the gamma ray photons [86]. SPECT clinical applications include myocardial
perfusion [87], tumor imaging [88], and cerebral blood flow imaging [89].
• OCT: an optical medical imaging technique that produces cross-sectional images
of the internal structure of biological tissues and organs by capturing the
backscattered light from the tissue [90]. The produced images are of high
quality (100 times larger than the ultrasound), on the micron scale (1e15 mm),
and can be obtained in real time, making OCT an emerging diagnostic imaging
modality. OCT has many applications in ophthalmology for detecting glaucoma
and macular edema [91], in arterial pathologies for studying plaque develop-
ment [92], in gastric and esophageal cancer for identifying lesions using cath-
eters/endoscopes [93], etc.
• fNIRS: a medical imaging technique that measures the oxygen consumption in
the blood flow within different types of tissues based on spectroscopy [19]. The
NIRS measures the absorption of oxygenated and deoxygenated HBC by the
living tissue in the near-infrared electromagnetic spectrum, as well as the
oxygen delivery in the living tissue, and thus it is able to record the metabolic
rate of oxygen consumption in different tissues. fNIRS is based on the principles
of the BOLD contrast mechanism (the basis of fMRI), by measuring the
hemodynamic response in different brain regions, where an increased hemo-
dynamic response denotes an activation in the region of interest (ROI). fNIRS is
a relatively fast technology that uses fiber optics to transfer the changes in
absorption of the light that is emitted by sources onto the head’s surface. A
similar technique is the optical topography that measures the changes in the
2.2 Types of medical data 27](https://image.slidesharecdn.com/pezoulas2020-250416102837-4cafedd0/75/Chapter-2-of-Medical-Data-Health-Records-9-2048.jpg)
![blood concentration using near-infrared light [94]. fNIRS is easily portable and
can be used to assess the functional recovery after stroke and other traumatic
brain injuries [95], as well as to measure the cortical blood flow and activation
during physical activities, e.g., sensorimotor tasks [96].
• US: a real-time, medical imaging technique that is based on the principles of
ultrasound to produce ultrasonic images that capture the echoes that are
produced by soft tissues when the probes (transducers) generate sound waves
with high frequency (20 kHz) [17]. In an ultrasound imaging system, a probe
is usually used to generate sound waves that travel into the tissue. The sound
waves are reflected or backscattered from the internal tissue structures having
different acoustic properties. The frequency of the sound waves can be recon-
figured to yield better resolution of the tissues or more tissue depth. Although
ultrasound imaging does not make use of ionizing radiation and is easily
portable with real-time evidence, it does not provide detailed anatomic infor-
mation regarding the structures behind the bones and sometimes it is difficult to
interpret the outcomes [17]. US has many clinical applications including the
obstetric US that is used for examining the fetus during pregnancy [97], the
echocardiography that is used to examine the functionality of the heart valves
[98], the intravascular US [99] that is used to visualize the blood flow within the
blood vessels using catheters with attached probes to detect coronary artery
lesions, and the duplex US [100] that makes use of the Doppler effect to display
the tissue movement and blood flow to detect stenosis in carotid arteries and
intracerebral arteries, among many others. The B-mode US has been also
proposed, enabling the visualization of anatomic details in the ultrasound
images for atherosclerotic progression [101].
• Photoacoustic imaging: a real-time, medical imaging technique that is based on
the principles of the photoacoustic effect [18]. A photoacoustic imaging system
consists of a nanosecond pulsed laser that generates pressure waves that are
emitted into biological tissues that produce photoacoustic pressure waves that
can be recorded by ultrasonic transducers yielding an image of the tissue.
During the pulse emission process, the biological tissues absorb the light energy
and convert it into heat. This causes the biological tissue to expand its size due
to the changes in its thermoelastic properties (the thermoacoustic effect) and to
produce sound waves (in the frequency range of MHz) that propagate and are
recorded by the ultrasound transducers. Photoacoustic imaging is a hybrid
method that combines the spectral characteristics of optical imaging with the
spatial information of ultrasound. Photoacoustic imaging has numerous appli-
cations in the field of medical diagnostics including cardiovascular diseases
[102], cancer detection, diagnosis and treatment [18], and brain function [103],
among others.
The number of acquired images may vary from several hundred to even
thousands of images per scan depending on the slice thickness technology that
is used. The majority of the medical imaging methods generate a series of
28 CHAPTER 2 Types and sources of medical and other related data](https://image.slidesharecdn.com/pezoulas2020-250416102837-4cafedd0/75/Chapter-2-of-Medical-Data-Health-Records-10-2048.jpg)
![two-dimensional (2D) image/slices that are organized into a 3D structure. In the
majority of the imaging acquisition protocols, the size of a 2D slice/image may
vary from 256 256 pixels and 512 512 pixels to even 1024 1024 pixels
(in the modern scanners). The size of a voxel depends on the spatial resolution
(slice thickness) and the field of view of the scanner, where a voxel is a pixel in
the 3D space (i.e., a volume element). As the modern scanners are characterized
by high spatial resolution, they are able to capture very small fluctuations in pixels
with extremely small dimension, such as 0.5 0.5 mm2, and in voxels with size
(width, height, depth) ¼ 0.5 0.5 0.5 mm3 (depending on the slice thickness),
yielding images that consist of millions of volume elements. Therefore, the smaller
the pixel size, the higher the resolution of the images. In the majority of the cases, a
voxel is usually stored as 1 byte (i.e., 8 bits) according to the Digital Imaging and
Communications in Medicine (DICOM) standard (see Section 2.3.3), where in
each imaging type, the voxel represents a unique information (see Section 2.3.3
for the medical imaging standards). For example, the voxel in a CT scan represents
the absorption rate of the X-rays from a specific part of the body. In 3D ultrasound
imaging, the voxels represent the volumetric flow rates and densities of the organs.
In MRI scans, the voxels represent the tissue characteristics as a result of the
hydrogen excitation in the water molecules. A scanner that generates 1000
images/slices with 512 512 voxels per slice, in the 3D space, can produce
images with a total size 256 MB (512 512 voxels/slice x 1000 slices 1 byte/
voxel). In all cases, the image size is equal to the header size (which includes
patient metadata and imaging acquisition specifications) plus the pixel data size,
which is calculated by multiplying the number of columns with the number of
rows, the pixel depth (i.e., the number of bits that are used to encode the pixel’s
information), and the number of slices (or frames).
2.2.3 Omics
The field of omics consists of a large number of areas/types of omics, with each one
having a specific unique clinical importance toward understanding the underlying
mechanisms behind the cellular interactions. Examples of omics data types include
the following:
• Genomics: the study of structural and functional genomic information. Structural
genomics involves the coding of whole genomes, whereas functional genomics
involve the investigation of the genome’s behavior during the gene’s develop-
ment process, as well as under environmental circumstances [20]. A genome
consists of genes, i.e., RNA or deoxyribonucleic acid (DNA) sequences, which
carry valuable genetic information regarding the formation, development, and
functionality of the biological cells. The DNA and RNA are nucleic acids that
comprise the fundamental genomic materials of any living organism along with
the lipids, proteins, and polysaccharides [104]. The clinical applications in the
field of genomics include chromosome mapping (the assignment of genes to
2.2 Types of medical data 29](https://image.slidesharecdn.com/pezoulas2020-250416102837-4cafedd0/75/Chapter-2-of-Medical-Data-Health-Records-11-2048.jpg)
![chromosomes, i.e., DNA molecules that carry portions of genetic material),
coding unannotated genes, and mapping genetic variants to phenotypes (i.e.,
traits of an organism) and haplotypes (i.e., genetic variants that are grouped
together) using single-nucleotide polymorphism (SNP) genotyping arrays to
study the implication of genetic variants in different diseases [105]. In contrast
to genomics, the genetics is a smaller field that studies the behavior of specific
genes instead of the whole genome.
• Transcriptomics: the study of all the RNA transcripts of an organism. The RNA is
a nucleic acid that is involved in different biological processes including gene
expression and gene coding and decoding [26]. The transcriptome refers to all
the RNA molecules that are present in a single cell or in a group of cells, where
the messenger RNA (mRNA) serves as a transient intermediary molecule that
transfers the genetic information (i.e., the nitrogen-containing nucleobases:
guanine, uracil, adenine, and cytosine) that is used to synthesize the proteins.
High-throughput RNA-sequencing and microarray technologies can capture the
whole transcriptome, yielding important details regarding the gene regulation
and the gene expression in different tissues and organs of the human body and
thus being able to capture the genetic profile of an organism. This is the reason
why transcriptomic technologies, such as RNA-sequencing [28], are often
employed to annotate previously unannotated genes and understand the
underlying cellular mechanisms of diseases, such as cancer [106].
• Proteomics: the study of the proteins, their topological characteristics, and
further interactions between them [22]. High-throughput technologies, such as
MS [29], are used to detect proteins from the peptides and thus shed light into
the structure and functionality of the proteins in specific types of cells. Proteins
are involved in a variety of biological processes including the cell growth and
the intracellular communication, among others, and thus it is important to
understand their expression profile in terms of how they function and interact
with other proteins. Toward this direction, the analysis of proteineprotein
interactions (PPIs) using concepts from graph theory is able to simulate the
complex interactions between the proteins and thus reveal functional associa-
tions between them under a given biological process [107]. Furthermore, the
topological characteristics of the PPI networks can reveal hubs, i.e., proteins
with increased participation in different biological processes, as well as identify
specific groups of proteins (clusters) that exhibit common functional charac-
teristics [107].
• Lipidomics: the study of lipids, i.e., biomolecules with structural diversity and
complexity. Lipids are used to address the cellular needs for energy storing,
signaling, and regulation and are highly engaged in preserving the balance
within a biological cell [21]. Any attempt to disturb this balance has a direct
effect on the chemical properties of the lipids. Therefore, the lipids can reveal
important information regarding pathophysiological conditions, such as
inflammatory and neurodegenerative diseases [108]. TLC [30] and MS [29] are
30 CHAPTER 2 Types and sources of medical and other related data](https://image.slidesharecdn.com/pezoulas2020-250416102837-4cafedd0/75/Chapter-2-of-Medical-Data-Health-Records-12-2048.jpg)
![the two most commonly used methods for identifying the lipids and under-
standing their functions in any biological cell.
• Metabolomics: the study of the multitude of metabolites (e.g., amino acids).
Metabolomics involves all those processes that involve the characterization of
the metabolic profiles of cells according to a genetic variation [23]. Technol-
ogies such as nuclear magnetic resonance and MS are widely used to detect the
metabolic changes in cells under different metabolomics experiments (e.g.,
under a drug administration). Metabolomics can provide valuable information
related to the metabolic effects of cancer cells in the presence of drugs, as well
as assess the chemical toxicities of a proposed drug in different organs and
tissues of the body during preclinical drug development [109].
• Microbiomics: the study of the effect of microorganisms in the human physi-
ology [24]. These effects include the negative implications of bacteria, fungi,
and other related microorganisms in the tissues and organs. These microor-
ganisms are usually referred to as microbiota. The genes of the microbiota form
the microbiome. The high-throughput NGS technology [27] can be used to
generate genetic profiles of the human microbiome and thus identify microbiota
variations [109,110] for various human diseases, including heart disease,
diabetes, and cancer, among many others.
• Epigenomics: a field that focuses on studying the effects of pathological factors,
such as degenerative diseases, cancer, and metabolic disorders to the whole-
gene expression [25]. These effects usually yield alterations in DNA methyl-
ation, proteins, enzymes, and other epigenetic marks. In fact, epigenomics aims
at exclusively identifying gene expression implications “on” the genome. The
most commonly used method for epigenomics analysis is the chromatin
immunoprecipitation (ChIP), which is combined with high-throughput
sequencing (HTS) [111]. This enables the genome-wide epigenetic analysis so
as to study for the effect of the isolated DNA from chromatin-associated
proteins that have been shown to play an important role during cancer devel-
opment [112].
The majority of the omics data, including genomic, proteomic, and transcrip-
tomic, among many others, are generated by the NGS analysis, a straightforward
technology that uses high-throughput methods for molecular profiling, such as
transcriptome sequencing (RNA-Seq) [28]. The raw data that are generated by the
NGS technology, for an individual sample, may vary from 10 gigabytes (GB),
e.g., in the case of microRNA sequencing (miRNA-Seq), and 20 GB, e.g., in the
case of RNA sequencing (RNA-Seq), to even more than 200 GB, e.g., in the case
of whole-genome sequencing (WGS) [27]. The size of the generated sequencing
data (raw data) is proportional to the number of samples under examination. The
raw data are usually stored in a FASTQ format (see Section 2.3.4) that is the funda-
mental input of an NGS analysis workflow that is executed by parallelized,
high-performance computing pipelines. The output of the pipeline is stored in the
SAM format (see Section 2.3.4).
2.2 Types of medical data 31](https://image.slidesharecdn.com/pezoulas2020-250416102837-4cafedd0/75/Chapter-2-of-Medical-Data-Health-Records-13-2048.jpg)
![2.2.4 Laboratory tests
The laboratory tests comprise a widely known type of medical data. Some examples
include the following:
• Hematological (or haematological or blood) tests: perhaps the most common
types of laboratory tests that are used for the analysis and examination of the
hemic system [113]. These types of tests make use of microscopes and hema-
tologic analyzers to examine the concentration of HBC in the blood flow (i.e.,
the oxygen levels in the blood flow), white blood cell (WBC) count, and the red
blood cell (RBC) counts, as well as the number of platelets (PLTs), the iron
concentration, and the number of erythrocytes and leukocytes. Furthermore, the
hematological tests are also used to evaluate certain types of diseases and
monitor different kinds of disorders through the measurement of the
prothrombin time and the thrombin time, the hematocrit (HCT), the blood
sedimentation, the blood coagulation time, the fibrin clot lysis time, and the
bone marrow, among others [113]. In general, the hematological tests are widely
used for the examination of inflammatory and blood clotting disorders and
genetic defects, as well as for monitoring an administered drug’s progress (e.g.,
the plasma levels under an anticlotting medication), the diagnosis of anemia, the
detection of blood cancer, the measurement of the cholesterol levels and the
blood pressure, and the detection of blood loss and blood clotting, among many
others [114].
• Urine tests: tests that examine the urine through a procedure that is known as
urinalysis [115]. Urinalysis uses chemical screening tests and microscopes to
study and analyze the urine flow, the urine gravity, the urine color levels, and the
occurrence of any bacteria and cellular fragments. The urine tests, along with
the hematological tests, comprise the two most common types of laboratory
tests that are conducted during a typical health examination process (check-up)
and during a pregnancy test. Urine tests are widely used for the detection of
kidney and liver disorders, as well as for the diagnosis of diabetes and prostate
cancer and the detection of urinary tract infections and prostatic hypertrophy
[116].
• Serological tests: special types of blood tests that seek for the infection of
antibodies under a specific virus [117]. More specifically, microscopic analysis
is used to examine the blood samples toward the detection of fungi, bacteria, and
other parasites that are present in the blood cells, as a result of a virus. In fact,
people who are infected by a virus exhibit different symptoms that weaken the
immune system. For this reason, the serological tests are widely employed to
understand the underlying mechanisms behind the virus infection and the
origins of the symptoms and are used for the detection of rubella, fungal
infections, and autoimmune disorders and for finding appropriate therapeutic
treatments [118].
• Coagulation tests: special types of blood tests that examine the blood clotting
process. Coagulation tests are performed through fast coagulation analyzers and
32 CHAPTER 2 Types and sources of medical and other related data](https://image.slidesharecdn.com/pezoulas2020-250416102837-4cafedd0/75/Chapter-2-of-Medical-Data-Health-Records-14-2048.jpg)
![microcoagulation systems that measure the blood’s coagulation speed, pro-
thrombin time, complete blood count (CBC), and the overall blood PLT levels
[119]. Coagulation tests are used for the detection of blood clotting disorders,
such as thrombophilia and hemophilia, as well as for liver disorders that include
excessive bleeding and the evaluation of any drug-related medication that
involves blood clotting as a negative implication [119].
• Histopathological (histological) tests: these tests are used to examine the
different types of tissues (e.g., muscle, nervous, epithelial) that reflect the
disease’s type [120]. Histopathological tests are primarily used in cancer
diagnosis. A sample tissue is initially obtained, on the least invasive way, for the
purposes of a biopsy test, where the size of the collected tissue sample varies
according to the tissue area that is under examination. Microscopic analysis
combined with cytological and histopathological principles, such as ICH [33]
and IHC [34], as well as gene profiling techniques, is then used to analyze the
tissue specimens yielding a histopathological report. The latter indicates
whether the tissue sample was found malignant (or metastatic malignant) or
benign according to the “behavior” of a specific marker that is used for tumor
detection (e.g., like the p53 tumor protein). In fact, the marker binds into the
sample causing the antigens or proteins of the sample to be marked or not (i.e.,
invokes a chemical release). Moreover, the histopathological report provides
information regarding the tumor type, the hormone susceptibility, and similar
tumor indicators to define a more targeted drug treatment in the case of a
malignancy (or metastases) [121].
• Immunological tests: these tests examine the functionality of the immune
system. Immunological tests share a similar basis with the histopathological
tests, where markers are used to identify pathogenetic characteristics on tissue
specimens [122]. These markers can take the form of either antibodies or
antigens according to the type of immunological analysis. Immunological tests
are used to diagnose chronic diseases, such as autoimmune diseases, where the
immune system attacks itself (e.g., like in systemic lupus erythematosus,
multiple sclerosis, rheumatoid arthritis), as well as to detect primary and
secondary immunodeficiency disorders, where the immune system is not able to
function properly and thus it is more susceptible to viruses and parasites (e.g.,
like in HIV/AIDS, neutropenia, etc.) [123].
• Skin tests: tests that examine the changes in the skin. These changes might be a
result of an allergy, a skin disorder, or might even denote skin cancer. In the
latter case, a skin biopsy is conducted to examine the suspected skin tissue
sample by removing the skin tissue sample and applying microscopic analysis
(similar to the histopathological tests) [124]. Skin tests are widely used to detect
skin redness as a result of widened blood vessels, nonblanching hemorrhages
(like purpura and palpable purpura), skin carcinoma, and skin lesions that might
lead to skin cancer, as well as to detect allergies through a skin prick test [125].
The latter involves the insertion of allergens that trigger allergic reactions
(through the release of chemical compounds), which might cause symptoms,
2.2 Types of medical data 33](https://image.slidesharecdn.com/pezoulas2020-250416102837-4cafedd0/75/Chapter-2-of-Medical-Data-Health-Records-15-2048.jpg)
![such as fever and dermatitis. Allergies can be originated by different sources
including food (food allergies), drug substances (drug reaction allergies), etc.
• Endocrine function tests: tests that examine the functionality of the endocrine
system [126]. The latter is vital for the maternal health and consists of endocrine
glands that can be found in different parts of the human body including the
hypothalamus, thyroid, pancreas, liver, and adrenal, among others. These glands
release chemical compounds, which are known as hormones, which are trans-
ferred to the hormone receptors of the human body through the bloodstream.
Hormones are involved in a variety of biological functions including growth,
fertility, metabolism, and energy consumption, etc. Endocrine function tests are
used to detect gland dysfunctions [127], where a hormone imbalance is
observed. The hormone imbalance might be related to a hormone release by an
endocrine tumor, a virus infection, a hyperplasia (e.g., enlarged salivary gland),
a sexual dysfunction, etc. The early detection of an endocrine gland dysfunction
is crucial as a dysfunction in one gland can cause a direct or indirect reaction to
another [126].
2.3 Medical data acquisition
2.3.1 Biosignal acquisition standards
The ECG signal acquisition devices use surface electrodes that are placed to specific
points in the chest and the limbs based on the standard 12-lead ECG placement [36].
According to the 12-lead ECG placement, four electrodes are placed symmetrically
on the limbs, namely on the right-hand wrist, the left-hand wrist, the right ankle, and
the left ankle, where one of this lead usually serves as the neutral lead. Alternatively,
these leads can be placed close to the hips and shoulders. Then, six electrodes are
placed on the chest, i.e., the precordial electrodes, starting from the intercostal space
at the right of the sternum to the midaxillary line, according to the angle of Louis
method. Additional placements involve the 3-electrode system and the 5-electrode
system where the electrodes are limited to the chest on equal distances from the
heart. In any case, the electrodes record the electrical activity that occurs due to
the depolarization and repolarization activity of the heart’s valves, providing a
lateral and inferior view of the ventricular and articular activity. The contraction
activity is recorded as a potential difference that is transformed into electrical signals
with peak amplitudes that vary from 3 to 7 mV [7].
For EMG signals, there are both invasive and noninvasive methods for the data
acquisition process. In the latter case, surface electrodes are placed on the skin
around the muscle with a conductive gel to enhance the signal’s quality. In the inva-
sive case, a needle is used to detect the electrical signals directly from the muscle. In
both cases, electrical potentials are recorded as part of the muscle’s contraction
activity with peak amplitudes varying from 0 to 10 mV [10]. Depending on the
muscle under observation, the EMG potentials might be higher than 10 mV [10].
34 CHAPTER 2 Types and sources of medical and other related data](https://image.slidesharecdn.com/pezoulas2020-250416102837-4cafedd0/75/Chapter-2-of-Medical-Data-Health-Records-16-2048.jpg)
![The EOG signal acquisition process involves the placement of six electrodes to
record the activity of the muscles that are responsible for the human eye movement
(i.e., the medial, lateral, and superior rectus and the superior and inferior oblique),
where one electrode is neutral (on the forehead). These muscles are usually referred
to as extraocular muscles. The EOG signals are acquired through horizontal or
vertical eye movement. The EOG potentials occur as a result of the cornea and
retinal electrical activity (corneoretinal potential) during eye movement with peak
amplitudes that vary on the interval [0.05,3.5] mV [11].
The EEG signal acquisition process involves the placement of 16e32, 128, and
even up to 256 surface electrodes on the human brain (i.e., scalp electrodes), which
are usually incorporated into appropriate head caps. The scalp electrodes are most
commonly placed on the head cap according to the International 10e20 system
[37], where the distances between the electrodes are either 10% or 20% the distance
from the nasion to inion or from the left side of the head to the right side. Conductive
gels are also placed for improving the quality of the recorded signals. For obtaining a
high-resolution analysis, more sensors need to be placed. These additional sensors
can be placed according to the International 10e5 system [37], where the distances
between the adjacent electrodes are smaller, i.e., the area between the adjacent elec-
trodes in the 10e20 system is filled. The EEG electrodes capture the changes in the
electrical field with peak amplitudes that vary on the interval [10,20] mV and convert
them to electrical signals that are digitized and stored in a computer device for
further analysis [8]. In the case of the ECoG signal acquisition, the amplitude of
the recorded transcranial signals is 1000 times higher, as the signal recording
approach is invasive [68].
In MEG signal acquisition, the sensors are coils (and more specifically supercon-
ducting magnets) that are already placed inside a dewar. The powerful magnetom-
eters are usually placed inside liquid helium to reduce the heat levels that are
produced by the superconducting technology that captures the extremely weak
changes in the magnetic field that occur during the neural activation. The whole sys-
tem is placed into an electromagnetically shielded room for reducing the noise levels
from the outside magnetic fields. These changes in the magnetic field are recorded
from the sensors and finally digitized for further manipulation. The extremely small
alterations in the brain’s magnetic field are approximately equal to 1015 T [9].
Biosignals can be also acquired using real-time health monitoring devices that
record the physiological activity, such as the heart rate, the respiratory rate, and
the blood pressure. These measures are transferred through wireless sensor networks
(WSNs) to computer devices and can be monitored on a daily basis.
2.3.2 Laboratory tests standards
Hematological analyzers are used to conduct hematological tests. The blood sample
is first collected either through venipuncture sampling or through arterial sampling
and sometimes fingerstick sampling. The hematological analyzers are able to differ-
entiate and measure the different types of blood cells using the traditional electrical
2.3 Medical data acquisition 35](https://image.slidesharecdn.com/pezoulas2020-250416102837-4cafedd0/75/Chapter-2-of-Medical-Data-Health-Records-17-2048.jpg)
![impedance method [128], according to which a change in the electrical impedance
between two electrodes (among which the blood flows) under an applied electrical
field is proportional to the cells volume. Thus, the volume of the WBCs, RBCs, and
PLTs can be differentiated and measured. Another widely used qualitative and quan-
titative method is the flow cytometric technology [129], where the blood sample is
first treated with fluorescent antibodies that bind in the sample and then a laser beam
is applied on the blood cells and appropriate photodetectors are able to capture the
amount of light that is absorbed by the blood cells. Together with the light that is
scattered by the blood cells from different angles, they can provide useful informa-
tion regarding the chemical compounds of the blood and the cells morphology. A
standard biochemical analysis involves the measurement of WBCs, RBCs, PLTs,
HBC, HCT, C-reactive protein, creatinine, glucose, cholesterol, potassium, sodium
levels, and the CBC as an overall index, among others. The measurement units vary
according to the laboratory where the analysis takes place, with the typical measure-
ment units usually being in mg=dL or mmol=L.
Coagulation analyzers are used to analyze the blood coagulation. The coagula-
tion analyzers are based on an optical detection method according to which a laser
beam hits the blood sample [119]. The scattered light is recorded by photodetectors
that covert the optical signals into electrical signals. The intensity of the scattered
light is proportional to the coagulation time and the blood clotting time. When
thrombolytic agents are applied on the blood sample, the analyzer can measure
the thrombin and prothrombin time.
In histological analysis, microscopes are used to analyze the tissue specimens for
detecting pathological conditions. A tissue sample is usually obtained from the area
under examination (e.g., from epithelium, endothelium, mesothelium), at the least
invasive way. The sample is then placed on a glass microscope slide for analysis.
The microscope that is used to analyze the sample can either be optical or electronic.
The optical microscope uses light to magnify the sample using photodetectors,
whereas the electron microscope uses a beam of electrons that is generated using
high voltage, instead of the light beam that is used in the optical microscope, to
reveal the morphological characteristics of smaller objects, with higher magnifica-
tion ratio, through electrostatic lens [130]. The IHC technique [34] is usually used
to detect specific proteins or antigens in the tissue sample using specific primary
antibodies that bind in the tissue sample where the sample is obtained through a sec-
tion, against the ICH technique where the cells have not been isolated by the tissue
sample (remain intact). In endocrine analysis, the functionality of the endocrine
glands is examined using gene expression analysis [131] to detect the activity of
proteins that are affected by the activity of the hormones. Endocrine tumors usually
cause a hormone imbalance that affects the activity of the proteins in the cells.
Standard urine test strips are used to detect pathological conditions in the
patient’s urine [115]. The urine test strip is a plastic strip with a colored scale that
indicates the presence of leukocytes, pH, protein, glucose, specific gravity, and
HBC levels, among others, on the urine sample. Each pad on the plastic strip consists
of a specific chemical compound that reacts with the urine compounds yielding a
36 CHAPTER 2 Types and sources of medical and other related data](https://image.slidesharecdn.com/pezoulas2020-250416102837-4cafedd0/75/Chapter-2-of-Medical-Data-Health-Records-18-2048.jpg)
![color that indicates the presence of the pad’s chemical compound on the urine
sample. A urine test strip is able to detect metabolism disorders, urinary deficiencies,
liver and kidney disorders, dehydration, and drug abuse, among others. Another
widely used method is the optical microscopy, according to which the sample is
magnified and examined. Laboratory measurements can also be obtained, e.g., for
sodium, potassium, and calcium levels, with the typical measurement units usually
being in mmol=24 h. Blood testerelated measures, such as the number of erythro-
cytes and leukocytes, can also be obtained.
Immunoassay analyzers are used to examine a patient’s collected samples for
bacteria, parasites, and other disease-related substances. First, reagents are bound
into the collected sample, and then a light beam (of specific frequency) is applied
on the molecules of the sample. An emitted light from the molecules indicates
that the collected sample is positive to the reagent. The light signals that are captured
by the photodetectors can be converted to electrical signals. The most commonly
used reagents in immunoassay analyzers are fluorescent substances. A prominent
technology that is currently used in immunoassay analyzers is based on chemilumi-
nescence [132], according to which light is emitted as a result of a chemical reaction.
Serological analyzers are used to analyze the blood samples for infected
antibodies. A popular test in this area is the direct fluorescent antibody test [133],
also referred to as direct immunofluorescence, where fluorescent antibodies are
used to detect antigens that exist in specific bacteria and fungi. The emitted fluores-
cence (of specific wavelength) confirms the presence of the antigen under examina-
tion. Other widely used tests include the complement fixation test that tests the
presence of antigens in the serum and the enzyme-linked immunosorbent assay
(ELISA) test [134], where a microtiter plate is used to test the presence of antigens
using antibodies with tethered enzymes that bind with the antigens and cause a
chemical reaction that appears in the form of a color change (chemiluminescence).
2.3.3 Medical imaging acquisition standards
The traditional image reconstruction process involves the application of the inverse
fast Fourier transform (FFT) to transform the data from the k-space (the projection
space) where the spatial information lies in Cartesian coordinates to the original
space (the image space). This is known as the inverse problem in tomographic
imaging. A widely used, computationally efficient algorithm for tomographic image
reconstruction is FBP algorithm [38], which is based on the inverse of the Radon
transform. The FBP algorithm applies a one-dimensional filter on the raw data
from different projections before the backprojection process to the image space to
recover the image [38]. These methods, however, are often inadequate, especially
in the case where non-Cartesian coordinates are available or when the FFT can no
longer be applied due to the nonlinearity introduced [135]. To face this problem, iter-
ative reconstruction algorithms have been proposed using statistical methods (e.g.,
by minimizing a regularized least square cost function) to provide object estimations
from projections, in multiple iterations [135]. Examples of these algorithms include
2.3 Medical data acquisition 37](https://image.slidesharecdn.com/pezoulas2020-250416102837-4cafedd0/75/Chapter-2-of-Medical-Data-Health-Records-19-2048.jpg)
![the algebraic reconstruction algorithm [39] and the iterative SAMV algorithm [40].
These algorithms provide better reconstruction but are more complex than the
previous approaches.
In MRI, the RF detectors capture the RF pulses that are generated by the
hydrogen atoms when the Larmor frequency is applied. The RF signals are con-
verted to electrical signals that are digitized. The data are recorded in the k-space
where the spatial information exists. Then, tomographic reconstruction algorithms
are applied to convert the raw data from the projections space into the image space.
The pixel’s brightness in an MRI slice denotes the mean attenuation of the hydro-
gens’ emitted RF signals by the tissue, bones, organs, and fat of the human body.
In fMRI, the MRI slices are obtained along with additional temporal information
regarding the BOLD responses that denote increased or decreased hemodynamic
response (activation) in the ROIs. fNIRS shares a common basis with fMRI, where
the hemodynamic responses are recorded by measuring the near-infrared light atten-
uation based on the neurovascular coupling. For fNIRS 3D image reconstruction,
methods similar to the diffusion optical tomography can be used, such as boundary
element methods for near-infrared absorption and scatter estimation [136]. In PET
scans, the metabolic processes at a molecular level are recorded in the form of coin-
cidence events [14]. PET image reconstruction is analogous to CT image reconstruc-
tion methods, yielding images with poorer quality, however, due to the photon
scattering and coincidence overlaps. The pixels in a PET image quantify the absorp-
tion of nucleic acid as a result of the molecular-level interactions with the adminis-
tered radioisotope (similar to the SPECT). In CT, the X-ray detectors capture the
ionizing particles that pass through the human body and finally convert them to elec-
trical signals. A pixel’s brightness in a CT image depends on the mean attenuation of
the tissue in terms of the radiodensity [12]. In general, the size of the pixel is dispro-
portional to the spatial resolution, with higher spatial resolution yielding smaller
pixels, with high detail. The 2D dimensions of imaging data may vary from
128 128 pixels to 256 256 pixels or 512 512 pixels and the number of slices
varies based on the slicing technology.
Examples of standard image formats include DICOM [137] and the Neuroimag-
ing Informatics Technology Initiative (Nifti) [137,138]. The former constitutes a
standard medical imaging format that is adopted by the majority of the manufac-
turers and clinical centers worldwide. According to the DICOM standard, a DICOM
file format (the format is recognized by the “.dcm” extension) consists of (i) a header
that includes the patient metadata (e.g., patient identification number, age, gender)
and the specifications of the image acquisition protocol (e.g., the scanner parame-
ters) and (ii) the pixel data, where a pixel value is represented as an 8-bit, 16-bit,
or 32-bit integer value through a linear transformation with a certain slope and inter-
cept [137]. The DICOM standard supports image compression that is useful in the
case where a series of DICOM images is produced by the scanner. On the other
hand, the Nifti file format constitutes the backbone format for storing neuroimaging
data (e.g., in brain studies), where the header and the pixel data are stored together
38 CHAPTER 2 Types and sources of medical and other related data](https://image.slidesharecdn.com/pezoulas2020-250416102837-4cafedd0/75/Chapter-2-of-Medical-Data-Health-Records-20-2048.jpg)
![under a “.nii” file format [137,138]. The most common method that is used by the
Nifti format for storing neuroimaging data is through a rotation and translation
matrix, which is used to transform the voxel coordinates to the desirable volume
space. According to the Nifti format, the images are encoded as 16-bit integer values
although the most recent Nifti-2 file format supports 64-bit integer values, thus
significantly increasing the size of the image space.
In the ultrasound imaging systems, the sound waves produced by the piezoelec-
tric transducers are scattered from the tissues and organs and finally returned to the
transducer in the form of echoes. The echo time and the intensity of the echo are
used to form the ultrasound image, where a pixel’s brightness is proportional to
echoes’ intensity. In photoacoustic imaging systems, the universal backprojection
algorithm [41] is used to reconstruct the image from the photoacoustic waves that
are reflected by the tissues or organs denoting the optical absorption in these regions.
In OCT, the optical scattering is measured. The images can be formatted either using
single-point scanning based on depth information from two lateral dimensions or
using charge-coupled device cameras for parallel scanning [139].
2.3.4 Omics acquisition standards
DNA sequencing is an approach that is used to detect the canonical structure of the
DNA in terms of the four nucleotides, i.e., the adenine (A), cytosine (C), guanine
(G), and thymine (T). According to the helix model, the “A” is always paired
with “T” forming one strand, and the “C” is always paired with a “G” forming
another strand. The strands are linked using hydrogen atoms. Popular DNA
sequencing methods include the Sanger sequencing [140], where the four deoxynu-
cleotides are used along with the DNA polymerase for four reactions where a DNA
primer binds with the fragments, as well as the MaxameGilbert sequencing [141],
which is more complex and uses radioactive labeling for sequencing DNA frag-
ments, and thus it is less used. HTS technology is the key technology toward the gen-
eration of millions of sequences simultaneously [27]. The high-throughput NGS
(also referred to as second-generation) method aims at enhancing the traditional
DNA sequencing methods using parallel sequencing to achieve the WGS through
genome fragmentation [27]. Examples of straightforward HTS methods include
the pyrosequencing [142] and the Illumina sequencing [143], which are based on
advanced polymerases and reversible dye-terminators for the detection of nucleo-
tides (using fluorescence and luciferase) yielding millions of detected nucleotides,
among others. In addition, ChIP-NGS [111] is used to examine the interactions
between DNA and proteins. Common standard data formats include the Sanger
FASTQ file format [144] that is used to store sequence information and the standard
flowgram format (SFF) that is used to encode sequence reads [145].
RNA sequencing is used to examine the transcriptome, i.e., the set of transcrip-
tomes in a biological cell [28]. RNA sequencing can provide great insight on the
RNA molecules that are responsible for the gene regulation, function, and coding,
2.3 Medical data acquisition 39](https://image.slidesharecdn.com/pezoulas2020-250416102837-4cafedd0/75/Chapter-2-of-Medical-Data-Health-Records-21-2048.jpg)
![as well as understanding the underlying mechanisms of a disease. Emphasis is
given on the mRNA molecules that transfer information regarding the encoding
of proteins, i.e., they act as an intermediate between the genes and the proteins
[28]. Additional groups of RNA molecules have been recently emerged including
the miRNA and the piwi-interacting RNA that is involved in the regulation of the
gene expression [146]. A standard RNA-sequencing analysis procedure involves
the execution of four steps [28]: (i) RNA isolation from the biological sample
(e.g., from a biological cell), (ii) reverse transcription of RNA to complementary
DNA (cDNA), (iii) amplification through polymerase chain reaction, and (iv)
cDNA sequencing. The conversion to cDNA is performed due to the fact that
the majority of the next-generation sequencers make use of DNA libraries for
sequencing. The serial analysis gene expression [][147] and the cap analysis
gene expression [][148] methods are often used to examine the mRNA molecules
for transcriptome fragments, where the number of RNA molecules, for a mamma-
lian cell, is more than 500 million [149].
The tissue microarray technology is used to detect tumors and other patholog-
ical characteristics in many tissue specimens that are placed on a tissue microarray
block [42]. The tissue specimens are obtained using sectional methods that manage
to isolate specific parts of the tissue for conducting a biopsy test. The block is then
divided into hundreds of smaller sections that can be placed either on an optical or
an electron microscope for analysis, similar to the IHC technology in histological
analysis, where specific proteins or antigens are detected in the tissue samples
using fluorescent antibodies that bind in the tissue sample. These proteins can
lead to the identification of new biomarkers or the validation of existing ones,
for different types of cancer, such as breast cancer and colorectal cancer, among
others. Furthermore, MS are used to quantify the mass of a molecule using an
ionizer that ionizes the molecule, then sorts the ions, and finally separates them
based on their mass-to-charge ratio to quantify the mass of the molecule using
electron multipliers or ion-to-photon detectors [29]. The output is a distribution
of the detected ions versus the mass-to-charge ratio. MS is widely used for the
characterization of the proteins’ morphological characteristics and to study the
function of the lipids in lipidomics [21].
TLC technology is widely used to monitor chemical reactions and discriminate
mixtures [30]. The standard procedure involves (i) the solid phase, where a thin glass
plate is covered with aluminum oxide or silica gel, and (ii) the mobile phase, where a
solvent is applied on the mixture. The flow of the solvent can reveal the molecular
structure of the mixture compounds through spots that remain on the plate and have
different colors depending on the compound characteristics. Finally, the retardation
factor is used for quantitative analysis that is defined as the distance of the spot from
the starting point [30] and depends on the solvent, the layer’s thickness, etc. These
spots can also be visualized using fluorescent compounds that make them visible
under a blacklight, as well as iodine vapors among others [30]. TLC is also widely
used in lipidomics for identifying the lipids concerning different disorders, such as
inflammatory and neurodegenerative diseases [108].
40 CHAPTER 2 Types and sources of medical and other related data](https://image.slidesharecdn.com/pezoulas2020-250416102837-4cafedd0/75/Chapter-2-of-Medical-Data-Health-Records-22-2048.jpg)
![2.4 Sources of medical data
2.4.1 Patient registries
The PRs are research-oriented collections (records) of health information from pa-
tients for clinical or scientific purposes in the form of an observational study [150].
The term “health information” refers to standardized types and formats of medical
data, including patient history, laboratory tests, medical images, and additional sour-
ces, such as patient and clinician/patient questionnaires, disease-related information,
and reported patient outcomes (or clinician claims) under health-related events
[150]. A PR is usually used by clinicians for the long-term (or short-term) collection,
storage, and evaluation of health information for a specific group of individuals who
exhibit a particular type of disease or medical condition. Therefore, the PRs can be
used in clinical research to (i) manage patient data, (ii) recruit patients for clinical
trials, (iii) develop drugs for chronic or rare diseases, including cardiovascular
diseases, diabetes, cancer, and arthritis, among others, and (iv) evaluate the subse-
quent patient outcomes. The PRs, however, do not focus on patients and are
purpose-specific as the majority of the PRs are mainly constructed for clinical
research purposes (research-oriented registries) although efforts have been made
toward the establishment of the patient-powered registries[][151] (patient-oriented
registries) to promote the collaboration between the clinicians and the patients.
2.4.2 Health sensors
The health sensors are intelligent wearable or implanted devices that are used for
health monitoring and disease prognosis. The current advances in wireless commu-
nications combined with the rapid development of “smart” biosensors have enabled
the low-cost, continuous monitoring of a patient’s health condition for home reha-
bilitation purposes, as well as the secure transfer of individual-related health infor-
mation through wireless networks, directly to a central data repository for clinical
evaluation and further analysis. The emerging biological microelectromechanical
systems (Bio-MEMS) with organic substrates make use of mechanical and electrical
components to record antigen interactions, nucleic acid interactions, and other
biological fluctuations through analytes that interact with the biosensors to invoke
fluctuations that are recorded by the transducers in the form of electrical (e.g.,
through electrochemical reactions), mechanical (e.g., through stress sensing), or
optical signals (e.g., through fluorescence) [152]. Furthermore, the rapid advances
in nanotechnology have enabled the construction of nanostructured thin films and
nanomaterials [153] (e.g., polymer nanoparticles, gold nanoparticles) for construct-
ing highly sensitive biosensors, in the nanoscale, having a larger number of
bioreceptor units than the typical Bio-MEMS (in the micron scale).
In the majority of the electronic health (e-Health) systems, the patient data are
transferred from the biosensors and through WSNs to a central processing node
(system) for remote monitoring [154]. Furthermore, the health information can be
also displayed to the user’s mobile through appropriate mobile applications that
2.4 Sources of medical data 41](https://image.slidesharecdn.com/pezoulas2020-250416102837-4cafedd0/75/Chapter-2-of-Medical-Data-Health-Records-23-2048.jpg)
![are part of the mobile health (m-Health) systems [155]. Health sensors are embedded
into real-time wireless systems that enable the continuous monitoring of the patient’s
physiological activity (e.g., heart rate, respiration rate, body temperature), physical
activity (e.g., motor movement), and mental activity (e.g., sleep patterns) toward the
improvement of the individual’s life quality, the evaluation of a drug’s progress, and
the early diagnosis of symptoms in numerous medical conditions and chronic disor-
ders, such as Parkinson’s disease, diabetes, chronic obstructive pulmonary disease,
and dementia, among many others.
2.4.3 Electronic health records
The electronic health records (EHRs) are digital, individual-level, health records for
the management and analysis of health information [156]. EHRs enable the collec-
tion and structured management of individual-level, health-related data (e.g., labo-
ratory tests, patient history, clinical claims, medical images) and the “true” analysis
of the health information using computerized methods against the traditional PRs
that are purpose-specific and thus focus more on the population characteristics, as
well as on deriving the health information before the collection and analysis of
the health information [156]. EHRs can enhance the clinician’s decision process
regarding the patient outcomes and make the communication between the clinician
and the patient much easier, as well as ensure the safety of the stored medical records
and avoid medical errors during the data entry in digital forms. In addition, the EHRs
can enable the electronic prescription of drugs and promote medical data sharing
through their interconnectivity with other EHR systems toward the establishment
of a global EHRs system. The majority of the national healthcare systems have
already adopted the EHR technology for transforming their traditional PR systems
due to the former’s (proven) positive effectiveness in patient care [156].
The majority of the EHR systems adopt the Health Level 7 (HL7) standard
clinical document architecture (CDA) [157]. The latter is based on a referenced
information model (RIM) that serves as a semantic model that consists of a set of
structural components (e.g., classes with data types) and semantic relations (e.g.,
a healthcare provider “belongs to” an organization where the healthcare provider
is an actor who is represented by a class and has a name, a surname, etc.) that are
used to represent clinical notes in the form of an extensible markup language docu-
ment [157]. The CDA is part of the HL7 version 3 family and uses the RIM as an
object-oriented model to define the actors (e.g., clinicians, healthcare providers),
the clinical document standard terms, and the targets (i.e., patients). CDA can
also include multimedia content, such as medical images. All this information is
organized into a human readable and standardized format that enables the interlink-
ing of EHRs among different clinical centers.
2.4.4 Genome registries
The genome registries are collections (records) of genomic information (e.g.,
biochemical genetic tests) that are stored in large databases [158]. These databases
include molecular-level health information regarding the genes, the chromosomes,
42 CHAPTER 2 Types and sources of medical and other related data](https://image.slidesharecdn.com/pezoulas2020-250416102837-4cafedd0/75/Chapter-2-of-Medical-Data-Health-Records-24-2048.jpg)
![the DNA and RNA sequences, the proteins, the haplotypes, the genotypes, and the
phenotypes, which are related to a specific disease. In addition, these databases
include demographic information that is related to the population characteristics
of the patients so as to study for the effects of drugs in target groups during clinical
trials. The genomic registries can help the clinicians to study the genotypee
phenotype relationships, the genetic profiles of various diseases in a cellular level,
and the SNPs associations with genetic variants and thus can shed light into the
underlying genetic variations in chronic and rare diseases. The sharing of genomic
data between genome registries can help geneticists to comprehend the mecha-
nisms behind genetic disorders and yield clinical decisions with higher statistical
power and thus enhance patient care [158]. Furthermore, similar types of genome
registries can be also generated for other areas of omics studies, such as prote-
omics, lipidomics, transcriptomics, and metabolomics, among others. In addition,
the individual omics registries can be combined together to establish multiomics
registries [159].
2.4.5 Clinical trials
Large pharmaceutical and biotechnological companies conduct large-scale clinical
trials with the purpose of examining and validating the effectiveness of a proposed
drug in a specific group of patients, which is usually referred to as the target group
[160]. This group consists of patients (usually referred to as subjects) who are drawn
from the overall population, fulfilling specific criteria, i.e., under the same medical
condition or disease. The patient selection process is usually based on stringent and
eligibility criteria and is compliant with all the legal, ethical, and patient privacy
requirements. The properly conducted large-scale clinical trials can yield significant
outcomes and pharmaceutical claims regarding the underlying mechanisms of a
disease’s genetic profile, as well as the negative implications of a proposed drug’s
(e.g., toxicities) on the target group. Clinical trials have numerous applications in
cancer and other chronic diseases [161]. Clinical trials can be also part of govern-
mental health plans that envisage to promote patient care toward the development
of new public health policies or the reinforcement of the existing ones. The
outcomes from the small- or medium-scale clinical trials are gathered according
to the case report form (CRF) designing architecture that is based on well-
structured, high-quality, user-friendly questionnaires that summarize the outcomes
of the clinical trial, as well as information regarding the specifications and actors
of the clinical trial in the form of concise questions and prompts [162]. The actors
of the CRF are the investigators that conducted the clinical study and the recipients
are clinicians, programmers, researchers, etc. The CRF content provides population-
related demographic information (e.g., age, sex), patient history (e.g., medical
conditions, smoking history, therapies), personal details (e.g., body weight), and
information regarding the presence of adverse events, among others. In the case
of large-scale clinical studies, the electronic case report form reduces the time effort
needed for data entry and processing.
2.4 Sources of medical data 43](https://image.slidesharecdn.com/pezoulas2020-250416102837-4cafedd0/75/Chapter-2-of-Medical-Data-Health-Records-25-2048.jpg)
![2.4.6 Clinical claims
Clinical claims are diagnostic reports from clinicians, general practitioners, and
healthcare stakeholders related to the diagnosis of a patient’s medical condition/dis-
ease or the patient’s outcomes under a specific administered drug. For example, a
clinician can evaluate a patient’s medical condition through the thorough examina-
tion of the patient’s medical images (i.e., imaging reports), laboratory measures (i.e.,
laboratory examination reports), etc. These diagnostic reports can usually be found
in EHR systems or in traditional PRs, as well as in the form of published articles in
international medical journals. Similar to the medical claims, the pharmaceutical
(and biotechnological) claims are clinical trial reports that are derived by pharma-
ceutical and biotechnology companies and health-related stakeholders during
small-, medium-, and large-scale clinical trials, i.e., during drug research, where
the effects (e.g., negative implications) of a proposed drug are extensively studied
on the participating group of subjects, i.e., the target group (see Section 2.4.5 for
more information about clinical trials).
2.4.7 Additional data sources
Additional sources where various medical data can be found are public or private
clinical centers, urban clinics, diagnostic centers, and clinical laboratories, as well
as in social media (e.g., Twitter, Facebook), private or public blogs, and web pages,
through which an individual can post any health-related information. Furthermore, a
variety of different types of medical data have already been made publicly available
by large healthcare platforms and funded projects for promoting clinical research
worldwide, such as the Human Connectome Project, which has made available
fMRI and diffusion neuroimaging data from more than 1000 healthy subjects
[163], and the Entrez Gene database at the National Center for Biotechnology Infor-
mation [][164], which includes more than 7 million gene-specific records (e.g., from
fungi, bacteria, eukaryotes, etc.) since 2010, among many others. Medical data can
also be found in cohort studies that will be extensively discussed separately due to
their clinical significance toward the investigation of a disease’s onset and progress,
against the interventional studies which are often high cost and involve treatment
randomization [43e47].
2.5 Cohorts
2.5.1 Origins
The term “cohort,” which has been extensively used in the field of clinical study
design, has its roots back in the Roman Empire, where the word “cohors” was
used to denote groups of soldiers who were part of a military Roman legion [43].
In synchronous epidemiology, the term “cohort” is used to describe a group of
follow-up individuals who exhibit a common medical condition or a specific type
of rare and/or chronic disease [43e47]. The cohort studies are part of a larger group
44 CHAPTER 2 Types and sources of medical and other related data](https://image.slidesharecdn.com/pezoulas2020-250416102837-4cafedd0/75/Chapter-2-of-Medical-Data-Health-Records-26-2048.jpg)
![of studies, which are widely known in the literature as analytical (or inferential)
observational studies, along with the caseecontrol and the cross-sectional studies
[43]. An observational study is a specific type of medical study design that mainly
aims to answer important questions regarding a disease’s origins and examine the
descriptive statistics of the population that is under examination. A well-designed
cohort study can be of great clinical importance because it can introduce a temporal
dimension (follow-up) that is able to provide clinical outcomes about a disease’s
prevalence and reveal the associations between the causes and the disease’s
outcomes [45].
The longitudinal cohort studies are of great importance in the vast domain of the
observational cohort studies. A longitudinal cohort study is a special type of obser-
vational study that involves the repetitive collection of patient data over long (or
short) time periods [165]. This is a key characteristic of the longitudinal cohort
studies that enables the accurate examination of differences between the same
patients over the time as the recall biases in patients are reduced along with the
well-known “cohort effect,” which introduces erroneous components in the cohort
(e.g., erroneously parsed ages) [165]. The longitudinal cohort studies can provide
deeper insight on a disease’s progress over time, yielding more accurate risk predic-
tors for the disease under investigation [165]. An example of a longitudinal cohort
study is the prospective cohort study, where the same patients are examined over
time although the longitudinal studies can also take the form of retrospective cohort
studies where the data from patients who have experienced the same medical con-
dition or disease have been already collected for a long time period in the past [165].
In general, the observational studies can either be descriptive or analytical [43].
The former focus more on the examination of a disease’s characteristics either on a
single patient (i.e., a case report study) or on a series of patients (i.e., a case series
study), as well as the disease’s prevalence (i.e., a cross-sectional study). The descrip-
tive observational studies make use of descriptive statistics, such as mean, variance,
etc., to study the population characteristics and identify the causes of a disease or
medical condition. On the other hand, the inferential observational studies include
(i) the cross-sectional studies, which quantify the associations between the causes
and the disease’s outcomes, on a specific time period (i.e., no follow-up information
is recorded), (ii) the caseecontrol studies, which are retrospective studies that
compare the disease prevalence between a case group and a control group, where
the latter is a group of healthy individuals and the former is a group of individuals
that share common disease characteristics, and (iii) the cohort studies that are
prospective or retrospective studies that investigate the associations between the
causes and the disease’s outcomes, as well as the effect of various prognostic factors
(e.g., laboratory measures) on the clinical outcomes [45].
2.5.2 Cohort study design
In cohort studies, the participating individuals (subjects) are selected on their expo-
sure to a specific disease (or medical condition) and according to specific exclusion
2.5 Cohorts 45](https://image.slidesharecdn.com/pezoulas2020-250416102837-4cafedd0/75/Chapter-2-of-Medical-Data-Health-Records-27-2048.jpg)
![criteria that are set during the design of the cohort study. These criteria are important
and comprise the fundamental basis of a cohort study. The exclusion criteria pose
restrictions to minimize the introduction of bias into the cohort study , for example,
to avoid the inclusion of patients that exhibit adverse events due to drug usage [44].
Once all the necessary exclusion criteria have been set, the exposed and unexposed
groups are defined, where both groups are drawn from the same population. The
exposed group comprises the subjects that will be exposed to a particular type of
drug, whereas the control group includes the healthy ones (in the absence of any
clinical outcome) and serve as the reference group. The drug exposure time may
vary from weeks or months, depending on the initial hypothesis of the cohort study.
The fact that a cohort study is designed to investigate the disease versus the outcome
(e.g., a symptom such as fever) associations, on a temporal basis, can reveal signif-
icant information regarding the disease’s onset and progress over the time.
In the meantime, the association between the drug exposure and the outcome
can be measured in terms of the RR [46]. The RR quantifies the chance that the
outcome is increased or decreased by the drug exposure and is defined as the ratio
between an incidence in the exposed group versus the incidence in the reference
group. A cohort study is finalized either when the drug exposure timescale comes
to an end or when the expected outcomes are fulfilled [43e45]. Other quite similar
measures include the HR, the risk difference (RD), and the odds ratio (OR). HR
corresponds to the hazard of death after treatment and is used to measure the
frequency of death between the drug-exposed group and the reference group
[47]. OR measures the odds that the outcome of interest will occur given the
drug exposure against the opposite and is mostly used in cross-sectional and casee
control studies where the RR cannot be estimated [166]. Finally, RD is defined as
the difference between an incidence in the exposed group and an incidence in the
reference group [167]. The absolute risk reduction is also used to measure whether
the outcome of interest is increased by the drug exposure. In multivariate statistics,
a 2x2 cross-tabulation table (or contingency table) [168] is usually used to compute
the risk measures through the examination of the associations between the out-
comes and the groups.
A cohort study can either use prospective or retrospective data. The difference
between the prospective and retrospective cohort studies lies on the fact that, on
the former, the cohort data are expected to be updated across time, where a temporal
dimension is used to keep track of the upcoming data (on a patient basis), whereas on
the latter, the cohort data are not expected to be updated in the future. This means
that in prospective (where “pro” denotes future) cohort studies, the clinical informa-
tion can be collected both at baseline and during follow-up, where multiple reoccur-
rences of the same symptom(s) might exist. On the other hand, in retrospective
(where “retro” denotes past) cohort studies, the clinical researchers analyze the
association between the exposures and the disease’s prevalence using past patient
data. Thus, in a retrospective cohort study, the starting point begins from the present
and “looks back” in time, whereas in a prospective cohort study, the starting point
begins from the present and “looks ahead.”
46 CHAPTER 2 Types and sources of medical and other related data](https://image.slidesharecdn.com/pezoulas2020-250416102837-4cafedd0/75/Chapter-2-of-Medical-Data-Health-Records-28-2048.jpg)
![2.5.3 Comparison with other study designs
The cohort studies can address several limitations that are present in the randomized
clinical trials, which are part of the interventional studies [160]. The cohort studies
[43e45] (i) can involve a large number of patients who are often followed for a large
timescale (i.e., longitudinal cohort studies) instead of the clinical trials where the
tracking of new patient data is often lost and the sensitive population groups (e.g.,
the children) are often excluded from the experiments, (ii) can measure patient-
specific outcomes instead of surrogate end points, (iii) do not use single-blind or
double-blind procedures, where the tracking of the subjects in the exposure group
is partially or completely lost, (iv) are less expensive than large-scale clinical trials,
and (v) are easier for the subjects to be part of instead of the clinical trials where the
subjects are often ambiguous. The cohort studies do not always involve any exper-
imentation with the subjects in terms of treatment randomization and the mandatory
use of placebos or other interventions for the control groups. The cohorts, however,
could be used for conducting low-cost, realistic clinical trials.
In a cohort study, the different types of medical data can be either prospective or
retrospective and thus can be collected both at baseline and during follow-up,
including data collected in the past, as well. The caseecontrol studies share a com-
mon basis with the retrospective cohort studies, where the analysis of the disease
versus outcome associations involves the analysis of the data that have been already
collected in the past (Fig. 2.1). In addition, in the cross-sectional studies, the inves-
tigation of the disease versus outcome associations occurs only in the presence, i.e.,
at a single time point (Fig. 2.1). The clinical significance of a cohort study can be
met in the special case where the exposure is a rare condition, such as a chronic
disease. In that case, a cohort study can be a powerful tool. Understanding a
disease’s onset and progress over time can address clinical unmet needs, such as
FIGURE 2.1
An illustration of the temporal dimension for each type of observational studies.
2.5 Cohorts 47](https://image.slidesharecdn.com/pezoulas2020-250416102837-4cafedd0/75/Chapter-2-of-Medical-Data-Health-Records-29-2048.jpg)
![the early identification of high-risk individuals (patient stratification), the discovery
of new targeted therapeutic treatments, and the development of new public health
policies for promoting healthcare worldwide.
2.6 Big data in medicine
Under the ages of our rapidly advancing technological era, the vast amount of daily
generated digital data has led to a scientific breakthrough with huge benefits in many
fields of our everyday lives including finance, medicine, and industry [1e6]. The
term “big data” has been extensively used to characterize these massively accumu-
lated datasets, which are mainly characterized by the four V’s [1e6]: (i) volume, (ii)
velocity, (iii) veracity, and (iv) variety, where each dimension has a unique scope.
The “volume” dimension refers to the massive amounts of collected data elements,
whereas the “velocity” refers to the speed of the continuously generated data flows.
The “veracity” dimension refers to the biases that are introduced during the data
collection process, and the “variety” refers to the different types of data sources
(e.g., different formats, structural differences). The definition of big data overcomes
the classic definition of the ordinary datasets, which is only limited to their size (i.e.,
volume). Big data is a promising tool that provides broader and more comprehensive
insight from large data elements, a fact that greatly enhances their impact in various
scientific and research areas, especially in healthcare. However, the size of the
collected data and the speed of the data generation process, combined with the
different types and the complexity of the big data, are crucial challenges that still
need to be addressed by the scientific community.
Currently, there are many types of big data in healthcare. More specifically,
medical big data can be found in the medical imaging domain, where the thin-
slice technology that has already been adopted by the modern diagnostic imaging
scanners (e.g., CT, MRI, OCT) is able to capture thousands (2000 slices) of
high-quality (in terms of spatial and temporal resolution) slices of different body
parts, in a very small amount of time. In addition, in the field of genomic analysis,
the advances in HTS technology has led to the NGS or second-generation
sequencing technology that is able to capture the entire human genome (which
consists of 30,000e35,000 genes), producing millions of DNA and RNA sequences.
Moreover, in the field of biomedical signal analysis, the continuous, high-resolution
monitoring (e.g., for days or even weeks) of a patient’s physiological, mental, or
physical activity produces large amounts of recorded waveforms that consist of
thousands of samples per second.
The application of big data in healthcare is promising and with many benefits.
The vast amount of generated data can improve the statistical power of the conven-
tional methods for data analytics including data mining and predictive modeling.
Furthermore, the big data can boost the clinical decision-making process and yield
clinical outcomes with higher statistical power (i.e., higher scientific impact due to
the large number of participating subjects) and improved accuracy [1e6]. As a
48 CHAPTER 2 Types and sources of medical and other related data](https://image.slidesharecdn.com/pezoulas2020-250416102837-4cafedd0/75/Chapter-2-of-Medical-Data-Health-Records-30-2048.jpg)
![result, the patient care will be greatly improved as the patients will avoid the risk of
unnecessary surgery operations, as well as the negative implications of unnecessary
(or even false) drug administration. Big data can enhance the performance of tradi-
tional machine learning methods, giving rise to a field that is known in computer
science as deep learning [1e6], a modern technique that makes use of multilayer
neural networks that are able to capture valuable patterns and associations that are
hidden between the large data elements, such as in multislice medical images,
omics, biomedical signals, etc. For example, the high-resolution, multidimensional,
four-dimensional medical images, such as the PET images that can capture addi-
tional information regarding the metabolic effects of a radioisotope apart from the
anatomic structure, or the fMRI images that can depict the brain activations under
a specific physical activity, can greatly enhance the accuracy of clinical diagnosis.
The application of big data in medicine can also enhance the patient stratification
process according to which straightforward machine learning methods can be
applied to identify and discriminate high-risk individuals from large populations
[1e6], i.e., groups of patients having high risk for the development of a type of
malignancy, such as lymphoma. This will also yield significant improvements in
personalized medicine for the selection of appropriate therapies by taking into
consideration molecular-level health information. Furthermore, the multivariate
analysis of large population groups can also reveal significant statistical associations
between the disease’s manifestations and different demographic factors, such as age,
gender, etc., and other medication related factors. Moreover, the outcomes from
large-scale clinical trials and clinical research studies that make use of big data
from large populations can enable the development of new, low-cost, targeted ther-
apies for chronic and rare diseases, as well as the development of new public health
policies toward a global and sustainable healthcare system.
The software advancements toward the development of methods for big data
analytics are an emerging field. The current software advancements in neuroimaging
have led to the voxel-wise analysis of hundreds of thousands of voxels (100,000)
within the human brain yielding large-scale similarity matrices, i.e., brain networks,
which are able to simulate the brain activations across different ROIs, yielding
millions of connections between the voxels [169]. These large-scale networks
have been widely used to study the brain activation patterns during resting state
or under specific physical and mental tasks [170]. Furthermore, the analysis of omics
big data using high-computing resources can reveal important clinical information
concerning the genetic variants and cellular functionalities in different types of
diseases, as well as assist the development of effective drugs with reduced implica-
tions in the participating subjects. A great example can be found in the field of inter-
actomics [171], where the PPI networks are constructed, on a cellular basis, to study
the stable and transient interactions among proteins [107]. In addition, in signal anal-
ysis, the applications of deep learning methods for the prediction of disease
outcomes have shown significant performance yielding high sensitivity and low
specificity scores in numerous cases, such as the prediction of epileptic events
[172], among others.
2.6 Big data in medicine 49](https://image.slidesharecdn.com/pezoulas2020-250416102837-4cafedd0/75/Chapter-2-of-Medical-Data-Health-Records-31-2048.jpg)
![Understanding big data is a difficult and demanding task for researchers and data
analysts. With the growing number of large volumes of daily generated data from
health sensors, social media posts, medical images, laboratory tests, electronic
patient records, blogs, and web pages, the estimated amount of data is expected to
overcome the zettabyte (1021 gigabytes) and even the yottabyte (1024 gigabytes)
[35]. Therefore, the development of straightforward software architectures along
with hardware components and computer-aided tools and systems toward the effi-
cient storage, management, quality assessment, high-performance computing anal-
ysis, and visualization of big data is a constant and increasing demand. For example,
in medical imaging analysis, emphasis must be given to the development of methods
for big data compression (e.g., image compression), registration and mapping of
thousands of slices, and methods for segmentation of anatomical structures across
these slices. A scientific researcher who is able to understand the nature (e.g., the
data patterns) of big data can discover new opportunities for the development of
new methods for big data analytics.
There is no doubt that the benefits of big data in healthcare are many. However,
there are several technical and clinical challenges that still need to be addressed. The
main challenge is the fact that the sources of big data are disparate, heterogeneous,
and costly, a fact that increases the computational complexity of handling large
volumes of data, as well as hampers the application of traditional statistical and
machine learning methods for big data analytics. In addition, the big data are often
incomplete with several discrepancies due to the lack of a global protocol for big
data acquisition. As a result, data standardization methods need to be adopted to
overcome this structural heterogeneity. Moreover, the big data are difficult to
manage due to their size and structural complexity. Furthermore, the risk of data
misuse is increased in big data with the data quality assessment process being a
significant challenge along with the lack of the researcher’s skills that might hamper
the quality of the data yielding unreliable outcomes. The big data are often prone to
the existence of missing values and measurement errors throughout their context,
which pose significant obstacles toward their effective analysis. As a result, the
irrational use of machine learning methods for predictive modeling in large datasets
might lead to false outcomes, with no clinical importance at all.
There are also privacy issues that lurk behind the use of big data [35]. Ethical and
legal issues must be carefully taken into consideration during the collection and
processing of big medical data from multiple data sources. As the big data are large
collections of patient data, it is difficult and even impossible to obtain signed
informed consent forms from every single patient. In addition, the large volume
of medical data shall not be stored in centralized databases as the risk for data abuse
is greatly increased. Therefore, the data should be stored in cloud environments that
are compliant with data protection regulations and should be collected under appro-
priate data protection agreements based on international privacy and protection stan-
dards. The researchers and data analysts must be fully aware of the data protection
regulations during the collection and processing of the data. Furthermore, there is an
increased necessity toward the development of machine learning methods for
50 CHAPTER 2 Types and sources of medical and other related data](https://image.slidesharecdn.com/pezoulas2020-250416102837-4cafedd0/75/Chapter-2-of-Medical-Data-Health-Records-32-2048.jpg)
![analyzing data that are distributed in multiple sites, a fact that remains a great chal-
lenge (see Chapter 7 for methods that deal with the analysis of distributed data).
2.7 Conclusions
The medical domain has been overwhelmed by the big data. The dramatic increase
in the speed of the data collection process along with the large volumes of accumu-
lated data from dispersed data sources has led to a scientific breakthrough, especially
in healthcare. The types of big data in healthcare are many (Fig. 2.2), varying from
medical images and laboratory tests to biosignals and omics. The volume size in
each type of data varies from megabytes (e.g., the size of the data in the laboratory
tests depends on the number of samples, and the size of the recorded biosignals
depends on the sampling frequency and the time duration) to gigabytes (e.g., the
size of medical images depends on the pixel depth and the number of slices) and
even Terabytes (e.g., the size of omics data depends on the type of sequencing) of
generated data. The mining of knowledge from big data can shed light into the unmet
needs of various diseases and lead to the development of more effective treatments
and public health policies. In addition, the rapid advances in volume-rendering
methods have led to 3D medical image reconstruction, a method that has signifi-
cantly improved the quality of image interpretation during the clinical diagnosis.
Moreover, the coregistration of different types of medical images, such as
PET-CT and SPECT-CT, can significantly enhance the diagnostic accuracy through
the construction of images that combine both high spatial resolution and temporal
information regarding the metabolic effects of the organs. Meanwhile, the current
advances in thin slicing technology have enabled the acquisition of thousands of
slices, in short time, yielding images with high spatial resolution from different parts
of the human body. Powerful 10.5T MRI scanners have been also constructed (i.e.,
the one located at the Center for Magnetic Resonance Research [173]) to further
enhance the image resolution. Apart from the fusion of medical images, the high
temporal resolution of the biomedical signals can be also combined with medical
imaging systems, such as MRI and CT, to provide both high spatial and temporal
information.
The evolution of NGS has enabled the parallel generation of millions of
sequences, yielding powerful RNA and DNA sequencers that are able to study the
whole transcriptome and even generate the genetic profiles of the whole human
microbiome. This breakthrough has shed light into the mechanisms of cancer cells,
the genetic profiles of various microorganisms, the genetic variants in different
diseases, and the gene regulation in different tissues and organs. In addition, the
advances in lipidomics and proteomics have made the identification of lipids and
proteins much easier and have provided great insight on their importance in gene
regulation. Modern techniques, such as microarray analysis, MS, and TLC, have
offered many capabilities toward the examination of proteins, lipids, and the meta-
bolic changes in biological cells in inflammatory and neurodegenerative diseases.
2.7 Conclusions 51](https://image.slidesharecdn.com/pezoulas2020-250416102837-4cafedd0/75/Chapter-2-of-Medical-Data-Health-Records-33-2048.jpg)
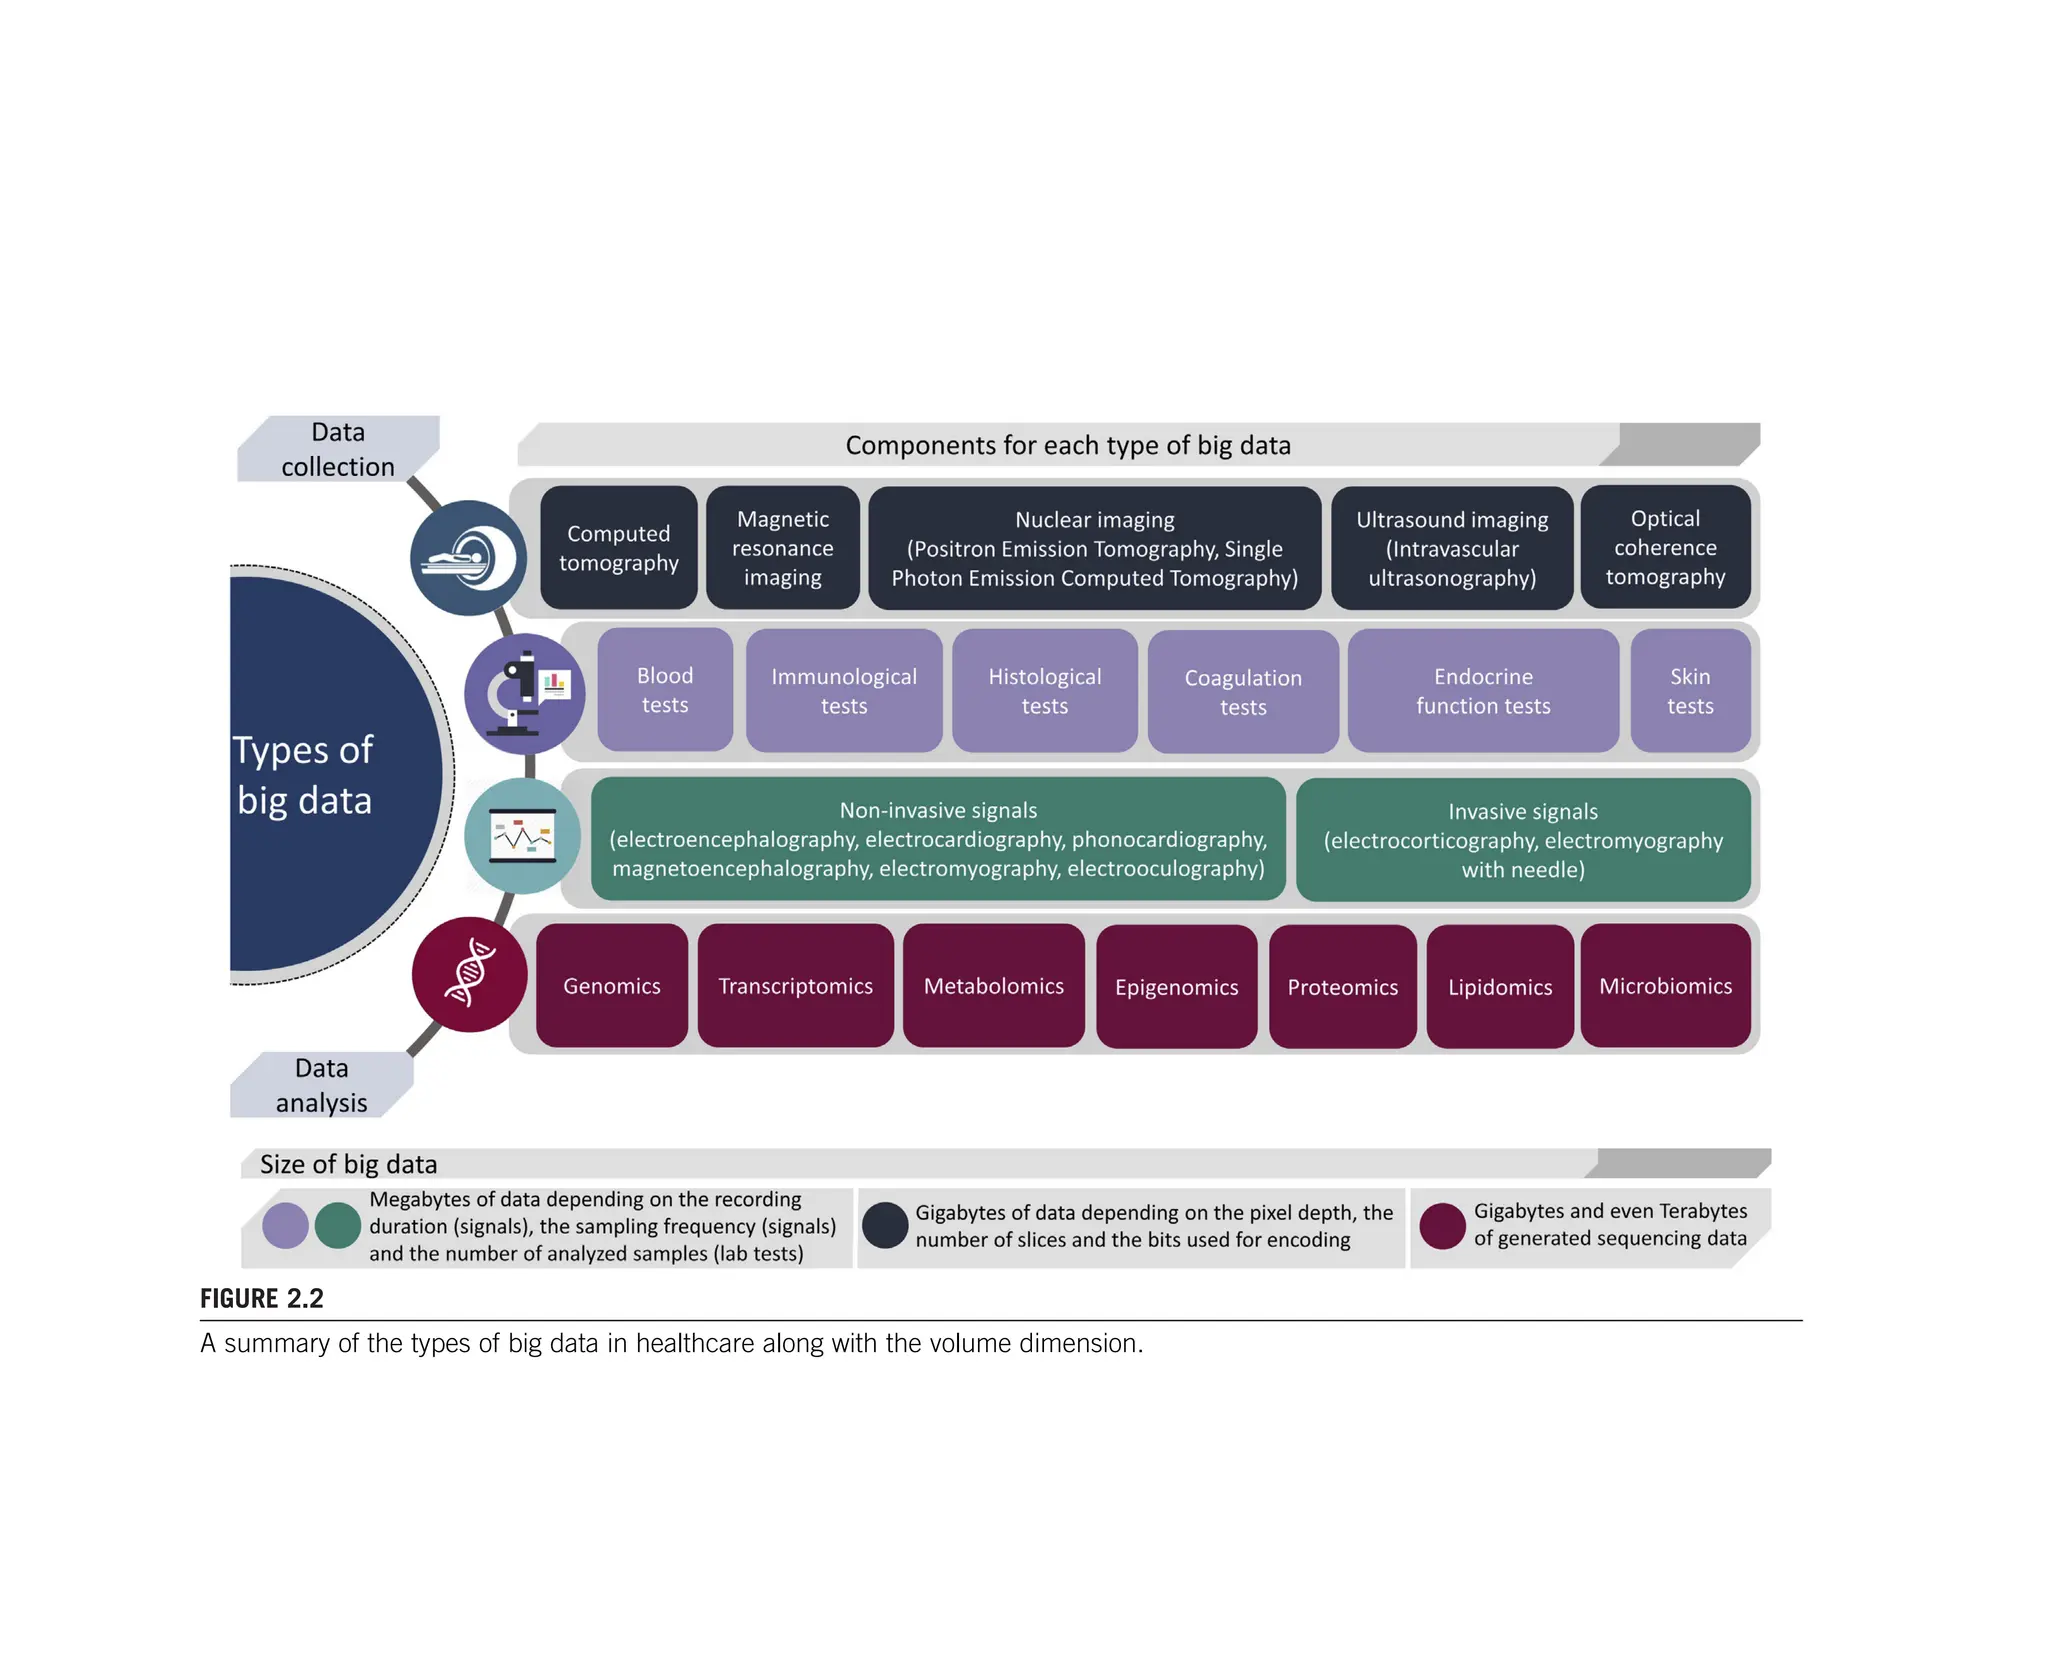
![Furthermore, the application of Graph Theory has enabled the construction of PPI
networks to understand the associations between the proteins and the identification
of proteins with similar functional characteristics. Meanwhile, the NGS technology
in the field of epigenomics has also enabled the examination of the implications of
different pathological factors in the whole-genome expression.
The advances of the postgenomic era aim at providing straightforward tools
toward the analysis and interpretation of the different omics data types. These ad-
vances are referred to as additional spans of the omics field, including [174]
(i) the phylogenomics that involves the development of computational methods
for the prediction of gene function using gene sequencing data, (ii) the physiomics
that uses Graph Theory to construct networks that represent the interactions between
genes so as to identify highly associated genes and predict the gene function, (iii) the
pharmacogenomics that studies the effect of drugs on the gene function by
computing the associations between SNPs and drug substances, (iv) the interactom-
ics that uses Graph Theory to construct networks that represent the interactions
between proteins (PPIs) and genes as well, and (v) the nutrigenomics that studies
the implication of nutrition in gene function, among others. In addition, the construc-
tion of multiomics registries that are able to combine the uniqueness of every indi-
vidual omics registry can provide great insight toward the analysis of the whole
genome, the genetic profiling, and shed light into the underlying mechanisms of
rare viruses and chronic disorders.
As far as the laboratory tests are concerned, the hematological analyzers that are
widely used to analyze the chemical compounds of the blood cells can provide great
insight on blood clotting disorders, inflammatory disorders, and blood cancer, as
well as check-up information through the measurement of the HCT level, the
WBC and RBCs, the cholesterol levels, and the glucose levels, among others. The
coagulation analyzers can provide additional information regarding the thrombin
and prothrombin time and blood clotting time, based on optical detection methods.
Histological and immunological analyzers using powerful optical and electron
microscopes along with the chemiluminescence effect (based on the IHC) can
provide valuable information regarding the existence of pathological factors on
different types of tissue specimens that are obtained using sectional approaches
from (e.g., epithelial) and thus test for the existence of tumor cells (through color
changes) or not. The traditional urine strips in urinalysis can reveal urinary
deficiencies and the use of drug substances, as well as, prostate cancer and various
kidney and liver disorders. Moreover, the direct fluorescent test that is used in sero-
logical analyzers can detect the presence of antigens on tissue antibodies and thus
confirm the existence of specific compounds in the tissue sample for the detection
of fungal and rubella infections and autoimmune disorders, among others. Finally,
the endocrine tests can reveal important clinical information regarding the endocrine
gland function by measuring the hormone levels, where high hormone levels denote
the existence of endocrine gland dysfunction that can be expressed by endocrine
tumors or other disorders.
2.7 Conclusions 53](https://image.slidesharecdn.com/pezoulas2020-250416102837-4cafedd0/75/Chapter-2-of-Medical-Data-Health-Records-35-2048.jpg)
![The retrospective and prospective cohort studies are able to overpass several
limitations that are introduced by caseecontrol studies, clinical trial studies, and
cross-sectional studies. The temporal dimension that is present in the prospective
cohort studies can yield important information regarding the disease’s onset and evo-
lution over the time, as well as reveal valuable information that is related to the disease
versus outcome associations. In addition, the fact that the cohort studies are patient-
specific and composed of groups of individuals who share a common disease or a
medical condition along with the ability to track follow-up data can address the unmet
needs in rare and autoimmune diseases toward more effective therapeutic treatments
and health policies, as well as better prediction models toward the identification of
high-risk individuals who are more prone to the development of a malignancy or a
pathological condition. Cohort studies have been used in a variety of diseases
including heart failure [175], Alzheimer’s disease [176], rheumatoid arthritis [177],
diabetes [178], epilepsy [179], and breast cancer [180], among many others.
Several laboratories and clinical centers, however, use their own measurement
units, a fact that hampers the coanalysis of their data with those from other labora-
tories and clinical centers, as well as the concept of data sharing. Moreover, the
structural heterogeneity of the acquired medical data introduces crucial biases
toward the effective analysis of medical data, and thus emphasis must be given on
the development of new automated methods and international guidelines for data
standardization and harmonization. The ethical and legal compliance of the data
acquisition procedures are of great importance. All the necessary consent forms
must be signed by the individuals, a fact that is difficult or even impossible in the
case of big data as the data sources are often dispersed. Data protection agreements
are also important toward the sharing of medical data. Security compromise is also a
serious threat. Having all these large volumes of data stored in centralized databases
poses significant threats for data abuse, and additional emphasis must be given on
the compliance with data security standards. Thus, emphasis must be given on the
development of distributed databases with security measures to ensure the confiden-
tiality of the data.
The fact that the profile of the big data is complex, with multiple and dispersed
data sources and different data formats, hampers the application of the traditional
approaches for data management and analytics. The sources of medical data are
many (Fig. 2.3), including PRs, EHRs, genome registries, clinical centers, social
media posts, and clinical claims, to name but a few, and thus the variety of these
disparate sources pose several issues regarding the structural heterogeneities that
are introduced during the analysis of such data. This is a crucial barrier that high-
lights the need for the development of new software architectures along with
high-performance computational resources that are able to deal with big data man-
agement, analysis, and visualization. In addition, before the application of cohort
studies and clinical trials, the researchers and data analysts must be able to under-
stand the structure of the big data so as to avoid any data misuse and biases that
are introduced during the data preprocessing stage, as well as during the statistical
analysis procedure. Furthermore, the researchers and data analysts must be well
54 CHAPTER 2 Types and sources of medical and other related data](https://image.slidesharecdn.com/pezoulas2020-250416102837-4cafedd0/75/Chapter-2-of-Medical-Data-Health-Records-36-2048.jpg)
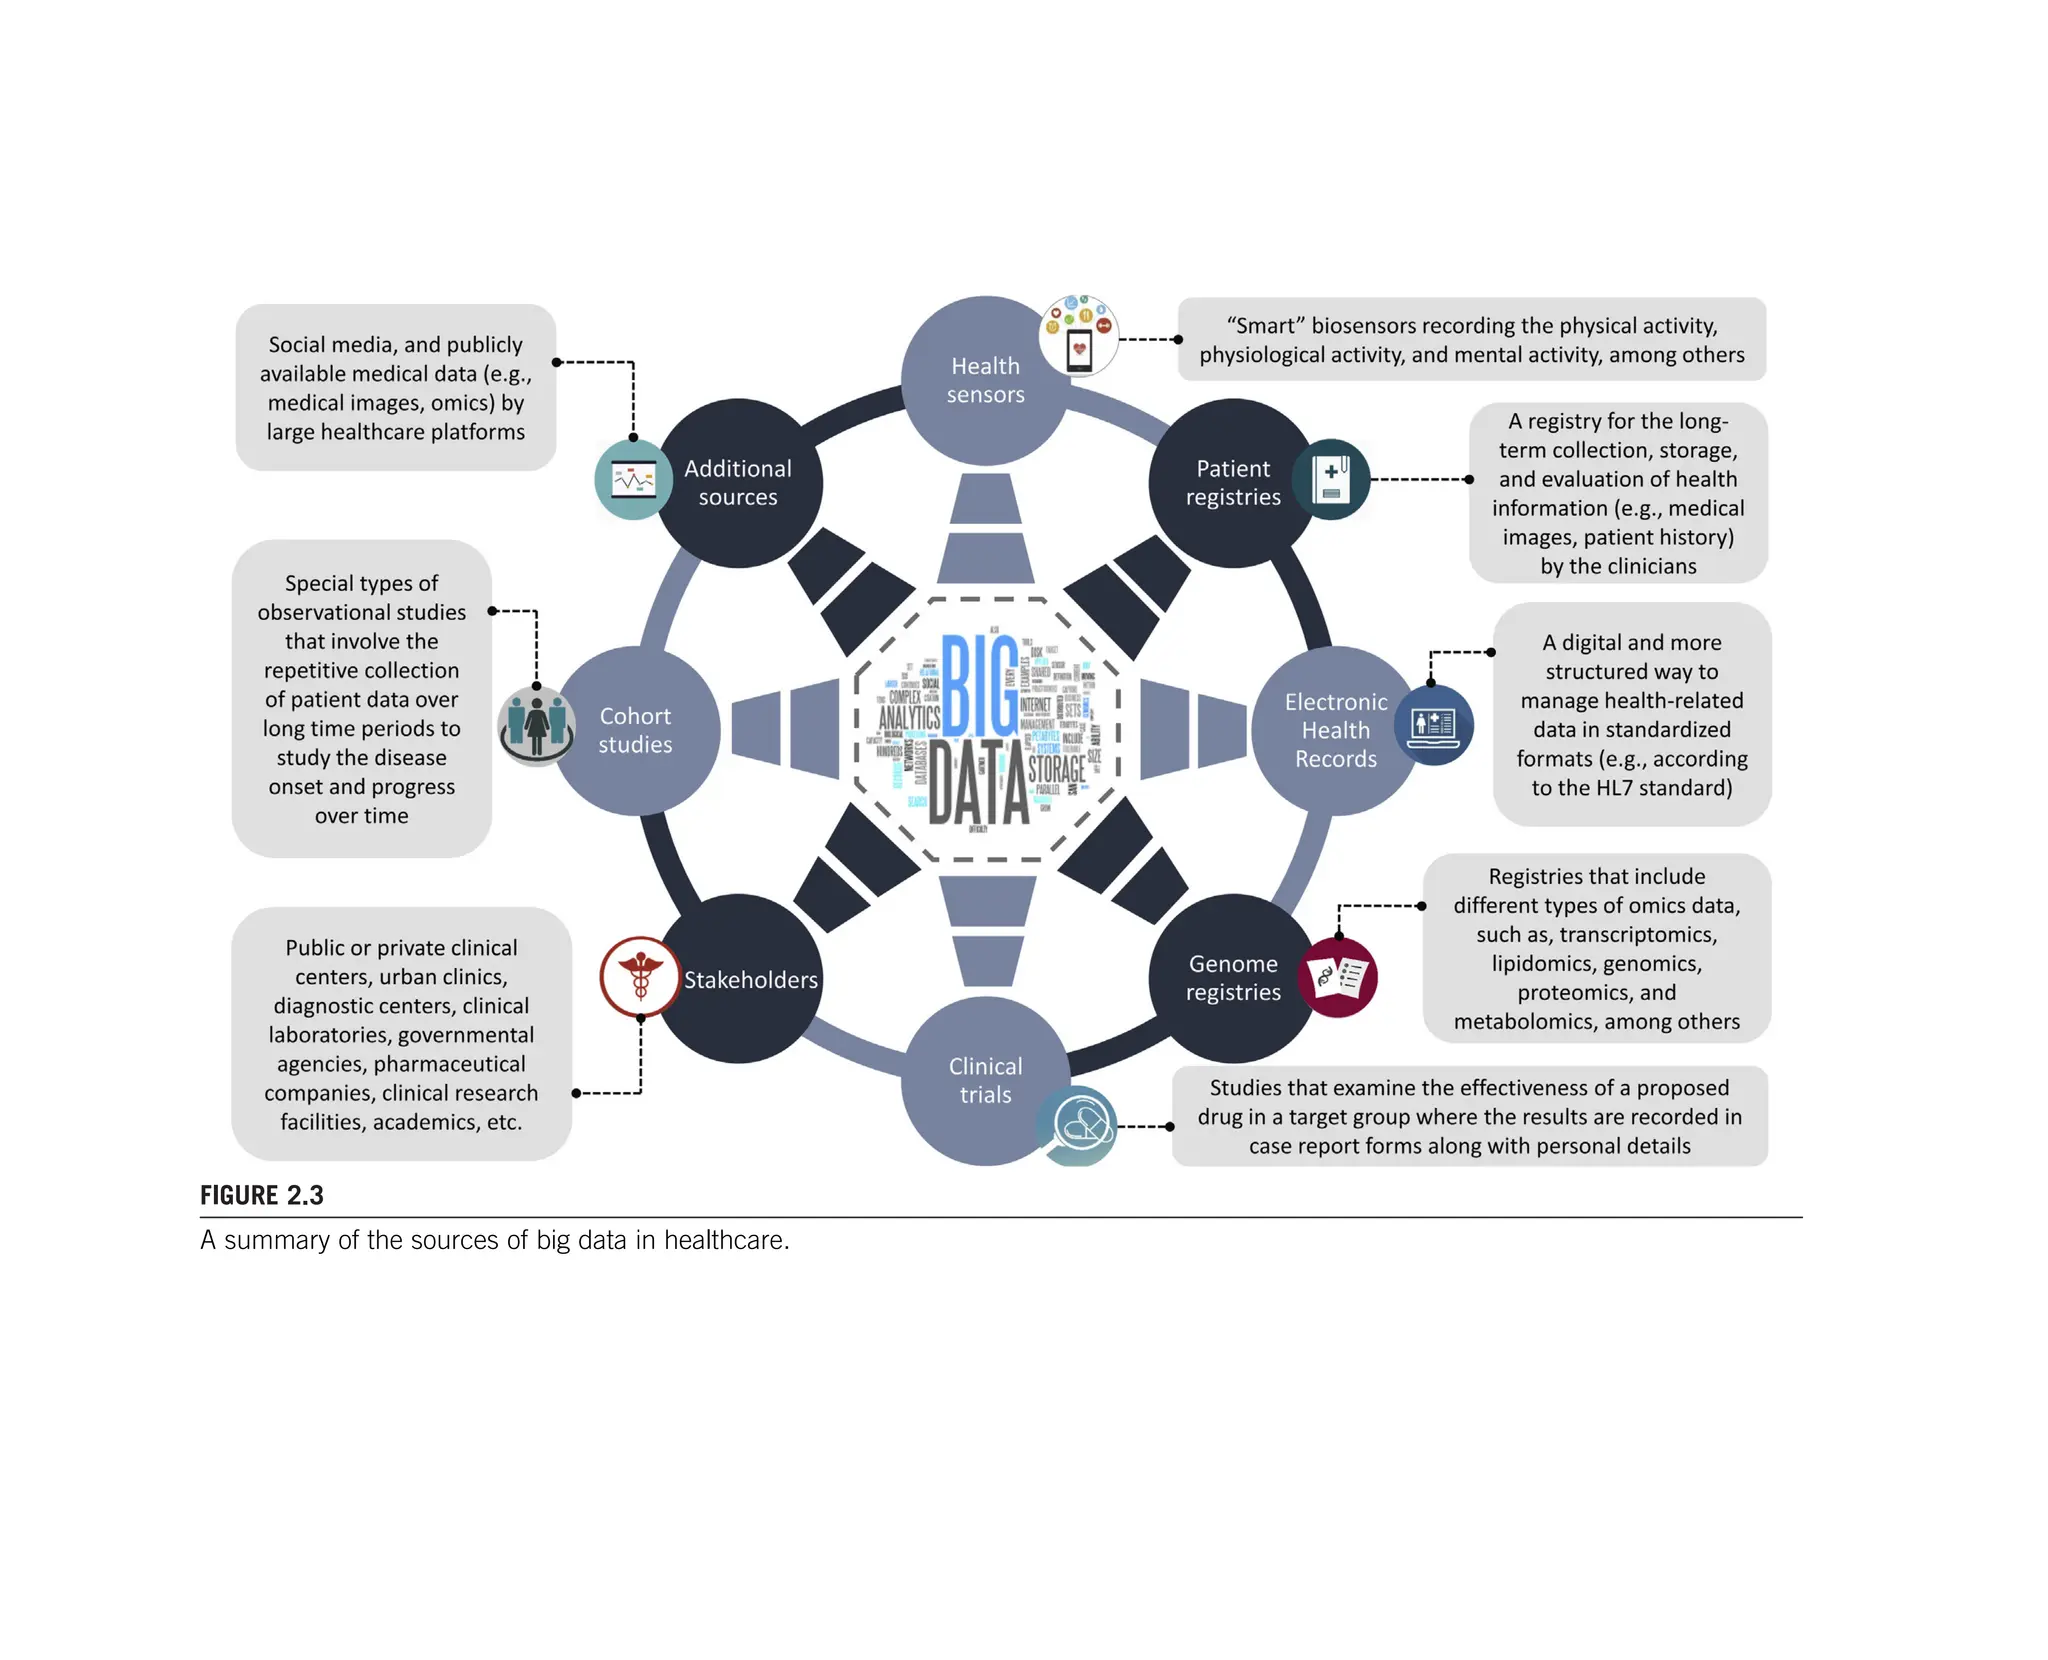
![aware of the ethical and legal issues that are posed by the international data protec-
tion regulations. Although the current efforts are very promising, additional
emphasis must be given on the development of global data acquisition standards
for the different types of medical data, toward medical data sharing and database
federation.
References
[1] Raghupathi W, Raghupathi V. Big data analytics in healthcare: promise and potential.
Health Inf Sci Syst 2014;2(1):3.
[2] Lee CH, Yoon HJ. Medical big data: promise and challenges. Kidn Res Clin Pract
2017;36(1):3.
[3] Krumholz HM. Big data and new knowledge in medicine: the thinking, training, and
tools needed for a learning health system. Health Aff 2014;33(7):1163e70.
[4] Belle A, Thiagarajan R, Soroushmehr SM, Navidi F, Beard DA, Najarian K. Big data
analytics in healthcare. BioMed Res Int 2015;2015,370194.
[5] Obermeyer Z, Emanuel EJ. Predicting the futuredbig data, machine learning, and
clinical medicine. N Engl J Med 2016;375(13):1216.
[6] Bates DW, Saria S, Ohno-Machado L, Shah A, Escobar G. Big data in health care: us-
ing analytics to identify and manage high-risk and high-cost patients. Health Aff 2014;
33(7):1123e31.
[7] AlGhatrif M, Lindsay J. A brief review: history to understand fundamentals of
electrocardiography. J Community Hosp Intern Med Perspect 2012;2(1):14383.
[8] Britton JW, Frey LC, Hopp JL, Korb P, Koubeissi MZ, Lievens WE, et al. Electroen-
cephalography (EEG): an introductory text and atlas of normal and abnormal findings
in adults, children, and infants. Chicago: American Epilepsy Society; 2016.
[9] Hari R, Salmelin R. Magnetoencephalography: from SQUIDs to neuroscience: neuro-
image 20th anniversary special edition. Neuroimage 2012;61(2):386e96.
[10] Mills KR. The basics of electromyography. J Neurol Neurosurg Psychiatry 2005;
76(Suppl. 2):ii32e5.
[11] Usakli AB, Gurkan S, Aloise F, Vecchiato G, Babiloni F. On the use of electrooculo-
gram for efficient human computer interfaces. Comput Intell Neurosci 2010;2010:1.
[12] Khadivi KO. Computed tomography: fundamentals, system technology, image quality,
applications. Med Phys 2006;33(8):3076.
[13] Hashemi RH, Bradley WG, Lisanti CJ. MRI: the basics. Lippincott Williams Wil-
kins; 2010.
[14] Saha GB. Basics of PET imaging: physics, chemistry, and regulations. New York:
Springer; 2016.
[15] Wernick MN, Aarsvold JN. Emission tomography: the fundamentals of PET and
SPECT. Elsevier; 2004.
[16] Ulmer S, Jansen O, editors. fMRI: basics and clinical applications. Berlin: Springer-
Verlag; 2010.
[17] Chan V, Perlas A. Basics of ultrasound imaging. In: Atlas of ultrasound-guided proced-
ures in interventional pain management. New York: Springer; 2011. p. 13e9.
[18] Mallidi S, Luke GP, Emelianov S. Photoacoustic imaging in cancer detection, diag-
nosis, and treatment guidance. Trends Biotechnol 2011;29(5):213e21.
56 CHAPTER 2 Types and sources of medical and other related data](https://image.slidesharecdn.com/pezoulas2020-250416102837-4cafedd0/75/Chapter-2-of-Medical-Data-Health-Records-38-2048.jpg)
![[19] Ferrari M, Quaresima V. A brief review on the history of human functional near-
infrared spectroscopy (fNIRS) development and fields of application. Neuroimage
2012;63(2):921e35.
[20] Griffiths AJF, Miller JH, Suzuki DT, Lewontin RC, Gelbart WM. An introduction to
genetic analysis. 7th ed. New York: W. H. Freeman; 2000 Available from: http://
www.ncbi.nlm.nih.gov/books/NBK21766/.
[21] Yang K, Han X. Lipidomics: techniques, applications, and outcomes related to
biomedical sciences. Trends Biochem Sci 2016;41(11):954e69.
[22] Aslam B, Basit M, Nisar MA, Khurshid M, Rasool MH. Proteomics: technologies and
their applications. J Chromatogr Sci 2017;55(2):182e96.
[23] Tzoulaki I, Ebbels TM, Valdes A, Elliott P, Ioannidis JP. Design and analysis of metab-
olomics studies in epidemiologic research: a primer on-omic technologies. Am J Epi-
demiol 2014;180(2):129e39.
[24] Shukla SK, Murali NS, Brilliant MH. Personalized medicine going precise: from ge-
nomics to microbiomics. Trends Mol Med 2015;21(8):461e2.
[25] Jones PA, Baylin SB. The epigenomics of cancer. Cell 2007;128(4):683e92.
[26] Lowe R, Shirley N, Bleackley M, Dolan S, Shafee T. Transcriptomics technologies.
PLoS Comput Biol 2017;13(5):e1005457.
[27] Metzker ML. Sequencing technologies e the next generation. Nat Rev Genet 2010;
11(1):31.
[28] Ozsolak F, Milos PM. RNA sequencing: advances, challenges and opportunities. Nat
Rev Genet 2011;12(2):87.
[29] Lavinder JJ, Horton AP, Georgiou G, Ippolito GC. Next-generation sequencing and
protein mass spectrometry for the comprehensive analysis of human cellular and serum
antibody repertoires. Curr Opin Chem Biol 2015;24:112e20.
[30] Fuchs B, Süß R, Teuber K, Eibisch M, Schiller J. Lipid analysis by thin-layer chroma-
tography e a review of the current state. J Chromatogr A 2011;1218(19):2754e74.
[31] Ljosa V, Carpenter AE. Introduction to the quantitative analysis of two-dimensional
fluorescence microscopy images for cell-based screening. PLoS Comput Biol 2009;
5(12):e1000603.
[32] Wang D, Bodovitz S. Single cell analysis: the new frontier in ‘omics’. Trends Bio-
technol 2010;28(6):281e90.
[33] Polak JM, Van Noorden S, editors. Immunocytochemistry: practical applications in pa-
thology and biology. Butterworth-Heinemann; 2014.
[34] Dabbs DJ. Diagnostic immunohistochemistry E-book: theranostic and genomic
applications. Elsevier Health Sciences; 2017.
[35] Greene CS, Tan J, Ung M, Moore JH, Cheng C. Big data bioinformatics. J Cell Physiol
2014;229(12):1896e900.
[36] Ashley EA, Niebauer J. Conquering the ECG. In: Cardiology explained. England:
Remedica; 2004.
[37] Teplan M. Fundamentals of EEG measurement. Meas Sci Rev 2002;2(2):1e11.
[38] Pan X, Sidky EY, Vannier M. Why do commercial CT scanners still employ traditional,
filtered back-projection for image reconstruction? Inverse Probl 2009;25(12):123009.
[39] Gordon R, Bender R, Herman GT. Algebraic reconstruction techniques (ART) for
three-dimensional electron microscopy and X-ray photography. J Theor Biol 1970;
29(3):471e81.
References 57](https://image.slidesharecdn.com/pezoulas2020-250416102837-4cafedd0/75/Chapter-2-of-Medical-Data-Health-Records-39-2048.jpg)
![[40] Abeida H, Zhang Q, Li J, Merabtine N. Iterative sparse asymptotic minimum variance
based approaches for array processing. IEEE Trans Signal Process 2013;61(4):
933e44.
[41] Xu M, Wang LV. Universal back-projection algorithm for photoacoustic computed
tomography. Phys Rev 2005;71(1):016706.
[42] Hegde P, Qi R, Abernathy K, Gay C, Dharap S, Gaspard R, et al. A concise guide to
cDNA microarray analysis. Biotechniques 2000;29(3):548e63.
[43] Song JW, Chung KC. Observational studies: cohort and case-control studies. Plast
Reconstr Surg 2010;126(6):2234.
[44] Gamble JM. An introduction to the fundamentals of cohort and caseecontrol studies.
Can J Hosp Pharm 2014;67(5):366.
[45] Süt N. Study designs in medicine. Balkan Med J 2014;31(4):273.
[46] Robbins AS, Chao SY, Fonseca VP. What’s the relative risk? A method to directly es-
timate risk ratios in cohort studies of common outcomes. Ann Epidemiol 2002;12(7):
452e4.
[47] Kim HY. Statistical notes for clinical researchers: risk difference, risk ratio, and odds
ratio. Restor Dent Endod 2017;42(1):72e6.
[48] McNutt LA, Wu C, Xue X, Hafner JP. Estimating the relative risk in cohort studies and
clinical trials of common outcomes. Am J Epidemiol 2003;157(10):940e3.
[49] Buzsaki G. Rhythms of the brain. Oxford University Press; 2006.
[50] Kropotov JD. Quantitative EEG, event-related potentials and neurotherapy. Academic
Press; 2010.
[51] Nishida K, Morishima Y, Yoshimura M, Isotani T, Irisawa S, Jann K, et al. EEG mi-
crostates associated with salience and frontoparietal networks in frontotemporal de-
mentia, schizophrenia and Alzheimer’s disease. Clin Neurophysiol 2013;124(6):
1106e14.
[52] Kindler J, Hubl D, Strik WK, Dierks T, König T. Resting-state EEG in schizophrenia:
auditory verbal hallucinations are related to shortening of specific microstates. Clin
Neurophysiol 2011;122(6):1179e82.
[53] Penolazzi B, Spironelli C, Vio C, Angrilli A. Brain plasticity in developmental
dyslexia after phonological treatment: a beta EEG band study. Behav Brain Res
2010;209(1):179e82.
[54] Proudfoot M, Woolrich MW, Nobre AC, Turner MR. Magnetoencephalography. Pract
Neurol 2014;14(5):336e43.
[55] Kharkar S, Knowlton R. Magnetoencephalography in the presurgical evaluation of
epilepsy. Epilepsy Behav 2015;46:19e26.
[56] Stam CJ. Use of magnetoencephalography (MEG) to study functional brain networks
in neurodegenerative disorders. J Neurol Sci 2010;289(1e2):128e34.
[57] Preston DC, Shapiro BE. Electromyography and neuromuscular disorders E-book:
clinical-electrophysiologic correlations (expert consult-online). Elsevier Health Sci-
ences; 2012.
[58] Sartori M, Reggiani M, Farina D, Lloyd DG. EMG-driven forward-dynamic estimation
of muscle force and joint moment about multiple degrees of freedom in the human
lower extremity. PLoS One 2012;7(12):e52618.
[59] Hsu WY, Lin CH, Hsu HJ, Chen PH, Chen IR. Wavelet-based envelope features with
automatic EOG artifact removal: application to single-trial EEG data. Expert Syst
Appl 2012;39(3):2743e9.
58 CHAPTER 2 Types and sources of medical and other related data](https://image.slidesharecdn.com/pezoulas2020-250416102837-4cafedd0/75/Chapter-2-of-Medical-Data-Health-Records-40-2048.jpg)
![[60] Deng LY, Hsu CL, Lin TC, Tuan JS, Chang SM. EOG-based Human-Computer Inter-
face system development. Expert Syst Appl 2010;37(4):3337e43.
[61] Szirmai A, Keller B. Electronystagmographic analysis of caloric test parameters in
vestibular disorders. Eur Arch Oto-Rhino-Laryngol 2013;270(1):87e91.
[62] Holm H, Gudbjartsson DF, Arnar DO, Thorleifsson G, Thorgeirsson G,
Stefansdottir H, et al. Several common variants modulate heart rate, PR interval and
QRS duration. Nat Genet 2010;42(2):117.
[63] Khorrami H, Moavenian M. A comparative study of DWT, CWTand DCT transforma-
tions in ECG arrhythmias classification. Expert Syst Appl 2010;37(8):5751e7.
[64] Acharya UR, Fujita H, Lih OS, Adam M, Tan JH, Chua CK. Automated detection of
coronary artery disease using different durations of ECG segments with convolutional
neural network. Knowl Based Syst 2017;132:62e71.
[65] Emmanuel BS. A review of signal processing techniques for heart sound analysis in
clinical diagnosis. J Med Eng Technol 2012;36(6):303e7.
[66] Konishi E, Kawasaki T, Shiraishi H, Yamano M, Kamitani T. Additional heart sounds
during early diastole in a patient with hypertrophic cardiomyopathy and atrioventric-
ular block. J Cardiol Cases 2015;11(6):171e4.
[67] Kumar SBB, Jagannath M. Analysis of phonocardiogram signal for biometric identi-
fication system. In: Proceedings of the 2015 IEEE International Conference on Perva-
sive Computing (ICPC); 2015. p. 1e4.
[68] Hill NJ, Gupta D, Brunner P, Gunduz A, Adamo MA, Ritaccio A, et al. Recording hu-
man electrocorticographic (ECoG) signals for neuroscientific research and real-time
functional cortical mapping. J Vis Exp 2012;64.
[69] Tripathi M, Garg A, Gaikwad S, Bal CS, Chitra S, Prasad K, et al. Intra-operative elec-
trocorticography in lesional epilepsy. Epilepsy Res 2010;89(1):133e41.
[70] Picht T, Schmidt S, Brandt S, Frey D, Hannula H, Neuvonen T, et al. Preoperative func-
tional mapping for rolandic brain tumor surgery: comparison of navigated transcranial
magnetic stimulation to direct cortical stimulation. Neurosurgery 2011;69(3):581e9.
[71] Lusic H, Grinstaff MW. X-ray-computed tomography contrast agents. Chem Rev
2012;113(3):1641e66.
[72] Auer M, Gasser TC. Reconstruction and finite element mesh generation of abdominal
aortic aneurysms from computerized tomography angiography data with minimal user
interactions. IEEE Trans Med Imaging 2010;29(4):1022e8.
[73] Herman GT, Kuba A, editors. Discrete tomography: foundations, algorithms, and
applications. New York: Springer Science Business Media; 2012.
[74] Miglioretti DL, Johnson E, Williams A, Greenlee RT, Weinmann S, Solberg LI, et al.
The use of computed tomography in pediatrics and the associated radiation exposure
and estimated cancer risk. JAMA Pediatr 2013;167(8):700e7.
[75] Poser BA, Koopmans PJ, Witzel T, Wald LL, Barth M. Three dimensional echo-planar
imaging at 7 Tesla. Neuroimage 2010;51(1):261e6.
[76] Yang H, Zhuang Y, Sun Y, Dai A, Shi X, Wu D, et al. Targeted dual-contrast T1-and
T2-weighted magnetic resonance imaging of tumors using multifunctional
gadolinium-labeled superparamagnetic iron oxide nanoparticles. Biomaterials 2011;
32(20):4584e93.
[77] Gordillo N, Montseny E, Sobrevilla P. State of the art survey on MRI brain tumor
segmentation. Magn Reson Imag 2013;31(8):1426e38.
References 59](https://image.slidesharecdn.com/pezoulas2020-250416102837-4cafedd0/75/Chapter-2-of-Medical-Data-Health-Records-41-2048.jpg)
![[78] Tsili AC, Argyropoulou MI, Giannakis D, Sofikitis N, Tsampoulas K. MRI in the char-
acterization and local staging of testicular neoplasms. Am J Roentgenol 2010;194(3):
682e9.
[79] Del Grande F, Carrino JA, Del Grande M, Mammen AL, Stine LC. Magnetic resonance
imaging of inflammatory myopathies. Top Magn Reson Imaging 2011;22(2):39e43.
[80] Khoo MM, Tyler PA, Saifuddin A, Padhani AR. Diffusion-weighted imaging (DWI) in
musculoskeletal MRI: a critical review. Skelet Radiol 2011;40(6):665e81.
[81] Basser PJ, Pierpaoli C. Microstructural and physiological features of tissues elucidated
by quantitative-diffusion-tensor MRI. J Magn Reson 2011;213(2):560e70.
[82] Barch DM, Burgess GC, Harms MP, Petersen SE, Schlaggar BL, Corbetta M, et al.
Function in the human connectome: task-fMRI and individual differences in
behavior. Neuroimage 2013;80:169e89.
[83] Formaggio E, Storti SF, Bertoldo A, Manganotti P, Fiaschi A, Toffolo GM. Integrating
EEG and fMRI in epilepsy. Neuroimage 2011;54(4):2719e31.
[84] Han D, Yu J, Yu Y, Zhang G, Zhong X, Lu J, He W. Comparison of 18F-
fluorothymidine and 18F-fluorodeoxyglucose PET/CT in delineating gross tumor vol-
ume by optimal threshold in patients with squamous cell carcinoma of thoracic
esophagus. Int J Radiat Oncol Biol Phys 2010;76(4):1235e41.
[85] Boss A, Bisdas S, Kolb A, Hofmann M, Ernemann U, Claussen CD. Hybrid PET/MRI
of intracranial masses: initial experiences and comparison to PET/CT. J Nucl Med
2010;51(8):1198.
[86] Hutton BF, Buvat I, Beekman FJ. Review and current status of SPECT scatter
correction. Phys Med Biol 2011;56(14):R85.
[87] Wang Y, Qin L, Shi X, Zeng Y, Jing H, Schoepf UJ, et al. Adenosine-stress dynamic
myocardial perfusion imaging with second-generation dual-source CT: comparison
with conventional catheter coronary angiography and SPECT nuclear myocardial
perfusion imaging. Am J Roentgenol 2012;198(3):521e9.
[88] Zhou Y, Chakraborty S, Liu S. Radiolabeled cyclic RGD peptides as radiotracers for
imaging tumors and thrombosis by SPECT. Theranostics 2011;1:58.
[89] Willeumier KC, Taylor DV, Amen DG. Elevated BMI is associated with decreased
blood flow in the prefrontal cortex using SPECT imaging in healthy adults. Obesity
2011;19(5):1095e7.
[90] Izatt JA, Choma MA, Dhalla AH. Theory of optical coherence tomography. Cham:
Springer; 2015.
[91] Jia Y, Wei E, Wang X, Zhang X, Morrison JC, Parikh M, et al. Optical coherence to-
mography angiography of optic disc perfusion in glaucoma. Ophthalmology 2014;
121(7):1322e32.
[92] Jia H, Abtahian F, Aguirre AD, Lee S, Chia S, Lowe H, et al. In vivo diagnosis of pla-
que erosion and calcified nodule in patients with acute coronary syndrome by intravas-
cular optical coherence tomography. J Am Coll Cardiol 2013;62(19):1748e58.
[93] Kirtane TS, Wagh MS. Endoscopic optical coherence tomography (OCT): advances in
gastrointestinal imaging. Gastroenterol Res Pract 2014;2014:376367.
[94] Sutoko S, Sato H, Maki A, Kiguchi M, Hirabayashi Y, Atsumori H, et al. Tutorial on
platform for optical topography analysis tools. Neurophotonics 2016;3(1):010801.
[95] Eierud C, Craddock RC, Fletcher S, Aulakh M, King-Casas B, Kuehl D, et al. Neuro-
imaging after mild traumatic brain injury: review and meta-analysis. Neuroimage Clin
2014;4:283e94.
60 CHAPTER 2 Types and sources of medical and other related data](https://image.slidesharecdn.com/pezoulas2020-250416102837-4cafedd0/75/Chapter-2-of-Medical-Data-Health-Records-42-2048.jpg)
![[96] Leff DR, Orihuela-Espina F, Elwell CE, Athanasiou T, Delpy DT, Darzi AW, et al.
Assessment of the cerebral cortex during motor task behaviours in adults: a systematic
review of functional near infrared spectroscopy (fNIRS) studies. Neuroimage 2011;
54(4):2922e36.
[97] Abramowicz JS. Benefits and risks of ultrasound in pregnancy. Semin Perinatol 2013;
37(5):295e300.
[98] Biswas M, Sudhakar S, Nanda NC, Buckberg G, Pradhan M, Roomi AU, et al. Two-
and three-dimensional speckle tracking echocardiography: clinical applications and
future directions. Echocardiography 2013;30(1):88e105.
[99] Räber L, Taniwaki M, Zaugg S, Kelbæk H, Roffi M, Holmvang L, et al. Effect of high-
intensity statin therapy on atherosclerosis in non-infarct-related coronary arteries
(IBIS-4): a serial intravascular ultrasonography study. Eur Heart J 2014;36(8):
490e500.
[100] Wong CS, McNicholas N, Healy D, Clarke-Moloney M, Coffey JC, Grace PA, et al.
A systematic review of preoperative duplex ultrasonography and arteriovenous fistula
formation. J Vasc Surg 2013;57(4):1129e33.
[101] Salonen JT, Salonen R. Ultrasound B-mode imaging in observational studies of athero-
sclerotic progression. Circulation 1993;87(3 Suppl):II56e65.
[102] Beard P. Biomedical photoacoustic imaging. Interface Focus 2011;1(4):602e31.
[103] Wang X, Pang Y, Ku G, Xie X, Stoica G, Wang LV. Noninvasive laser-induced photo-
acoustic tomography for structural and functional in vivo imaging of the brain. Nat
Biotechnol 2003;21(7):803.
[104] Devlin TM. Textbook of biochemistry. John Wiley Sons; 2011.
[105] Seeb JE, Carvalho G, Hauser L, Naish K, Roberts S, Seeb LW. Single-nucleotide poly-
morphism (SNP) discovery and applications of SNP genotyping in nonmodel
organisms. Mol Ecol Resour 2011;11:1e8.
[106] Sager M, Yeat NC, Pajaro-Van der Stadt S, Lin C, Ren Q, Lin J. Transcriptomics in
cancer diagnostics: developments in technology, clinical research and
commercialization. Expert Rev Mol Diagn 2015;15(12):1589e603.
[107] Nepusz T, Yu H, Paccanaro A. Detecting overlapping protein complexes in protein-
protein interaction networks. Nat Methods 2012;9(5):471.
[108] Mazereeuw G, Herrmann N, Bennett SA, Swardfager W, Xu H, Valenzuela N, et al.
Platelet activating factors in depression and coronary artery disease: a potential
biomarker related to inflammatory mechanisms and neurodegeneration. Neurosci Bio-
behav Rev 2013;37(8):1611e21.
[109] Wishart DS. Emerging applications of metabolomics in drug discovery and precision
medicine. Nat Rev Drug Discov 2016;15(7):473.
[110] Buermans HPJ, Den Dunnen JT. Next generation sequencing technology: advances
and applications. Biochim Biophys Acta 2014;1842(10):1932e41.
[111] Bernstein BE, Stamatoyannopoulos JA, Costello JF, Ren B, Milosavljevic A,
Meissner A, et al. The NIH roadmap epigenomics mapping consortium. Nat Bio-
technol 2010;28(10):1045.
[112] Sandoval J, Esteller M. Cancer epigenomics: beyond genomics. Curr Opin Genet Dev
2012;22(1):50e5.
[113] Hoffman R, Benz Jr EJ, Silberstein LE, Heslop H, Anastasi J, Weitz J. Hematology:
basic principles and practice. Elsevier Health Sciences; 2013.
[114] Hillman RS, Ault KA, Rinder HM. Hematology in clinical practice, (LANGE clinical
medicine). New York: McGraw-Hill; 2011.
References 61](https://image.slidesharecdn.com/pezoulas2020-250416102837-4cafedd0/75/Chapter-2-of-Medical-Data-Health-Records-43-2048.jpg)
![[115] Wu X. Urinalysis: a review of methods and procedures. Crit Care Nurs Clin 2010;
22(1):121e8.
[116] Gratzke C, Bachmann A, Descazeaud A, Drake MJ, Madersbacher S, Mamoulakis C,
et al. EAU guidelines on the assessment of non-neurogenic male lower urinary tract
symptoms including benign prostatic obstruction. Eur Urol 2015;67(6):1099e109.
[117] Wine Y, Horton AP, Ippolito GC, Georgiou G. Serology in the 21st century: the
molecular-level analysis of the serum antibody repertoire. Curr Opin Immunol
2015;35:89e97.
[118] Guarner J, Brandt ME. Histopathologic diagnosis of fungal infections in the 21st
century. Clin Microbiol Rev 2011;24(2):247e80.
[119] Triplett DA. Coagulation and bleeding disorders: review and update. Clin Chem 2000;
46(8):1260e9.
[120] Peckham M. Histology at a glance, vol. 50. John Wiley Sons; 2011.
[121] Öberg K, Castellano D. Current knowledge on diagnosis and staging of neuroendo-
crine tumors. Cancer Metastasis Rev 2011;30(1):3e7.
[122] Delves PJ, Martin SJ, Burton DR, Roitt IM. Essential immunology. John Wiley
Sons; 2017.
[123] Chandrashekara S. The treatment strategies of autoimmune disease may need a
different approach from conventional protocol: a review. Indian J Pharmacol 2012;
44(6):665.
[124] Helfand M, Mahon SM, Eden KB, Frame PS, Orleans CT. Screening for skin cancer.
Am J Prev Med 2001;20(3):47e58.
[125] Heinzerling L, Mari A, Bergmann KC, Bresciani M, Burbach G, Darsow U, et al. The
skin prick testeEuropean standards. Clin Transl Allergy 2013;3(1):3.
[126] Greenstein B, Wood DF. The endocrine system at a glance. John Wiley Sons; 2011.
[127] Yu J. Endocrine disorders and the neurologic manifestations. Ann Pediatr Endocrinol
Metab 2014;19(4):184.
[128] Spence N. Electrical impedance measurement as an endpoint detection method for
routine coagulation tests. Br J Biomed Sci 2002;59(4):223e7.
[129] Adan A, Alizada G, Kiraz Y, Baran Y, Nalbant A. Flow cytometry: basic principles and
applications. Crit Rev Biotechnol 2017;37(2):163e76.
[130] Rose HH. Optics of high-performance electron microscopes. Sci Technol Adv Mater
2008;9(1):014107.
[131] Parmigiani G, Garrett ES, Irizarry RA, Zeger SL. The analysis of gene expression data:
an overview of methods and software. New York: Springer; 2003.
[132] Cinquanta L, Fontana DE, Bizzaro N. Chemiluminescent immunoassay technology:
what does it change in autoantibody detection? Auto Immun Highlights 2017;8(1):9.
[133] Odell ID, Cook D. Optimizing direct immunofluorescence. Methods in molecular
biology (methods and protocols), vol. 1180. New York: Humana Press; 2014.
[134] Aydin S. A short history, principles, and types of ELISA, and our laboratory experi-
ence with peptide/protein analyses using ELISA. Peptides 2015;72:4e15.
[135] Knopp T, Kunis S, Potts D. A note on the iterative MRI reconstruction from nonuni-
form k-space data. Int J Biomed Imaging 2007;2007:24727.
[136] Srinivasan S, Pogue BW, Carpenter C, Yalavarthy PK, Paulsen K. A boundary element
approach for image-guided near-infrared absorption and scatter estimation. Med Phys
2007;34(11):4545e57.
[137] Larobina M, Murino L. Medical image file formats. J Digit Imaging 2014;27(2):
200e6.
62 CHAPTER 2 Types and sources of medical and other related data](https://image.slidesharecdn.com/pezoulas2020-250416102837-4cafedd0/75/Chapter-2-of-Medical-Data-Health-Records-44-2048.jpg)
![[138] Gorgolewski KJ, Auer T, Calhoun VD, Craddock RC, Das S, Duff EP, et al. The brain
imaging data structure, a format for organizing and describing outputs of neuroimag-
ing experiments. Sci Data 2016;3:160044.
[139] Mazurenka M, Di Sieno L, Boso G, Contini D, Pifferi A, Dalla Mora A, et al. Non-
contact in vivo diffuse optical imaging using a time-gated scanning system. Biomed
Opt Express 2013;4(10):2257e68.
[140] Sanger F, Nicklen S, Coulson AR. DNA sequencing with chain-terminating inhibitors.
Proc Natl Acad Sci USA 1977;74(12):5463e7.
[141] Maxam AM, Gilbert W. A new method for sequencing DNA. Proc Natl Acad Sci USA
1977;74(2):560e4.
[142] Harrington CT, Lin EI, Olson MT, Eshleman JR. Fundamentals of pyrosequencing.
Arch Pathol Lab Med 2013;137(9):1296e303.
[143] Bronner IF, Quail MA, Turner DJ, Swerdlow H. Improved protocols for illumina
sequencing. Curr Protoc Hum Genet 2014;21(80). 18.2.1-42.
[144] Cock PJ, Fields CJ, Goto N, Heuer ML, Rice PM. The Sanger FASTQ file format for
sequences with quality scores, and the Solexa/Illumina FASTQ variants. Nucleic
Acids Res 2009;38(6):1767e71.
[145] Leinonen R, Sugawara H, Shumway M. The sequence read archive. Nucleic Acids Res
2011;39:D19e21.
[146] Ishizu H, Siomi H, Siomi MC. Biology of PIWI-interacting RNAs: new insights into
biogenesis and function inside and outside of germlines. Genes Dev 2012;26(21):
2361e73.
[147] Yamamoto M, Wakatsuki T, Hada A, Ryo A. Use of serial analysis of gene expression
(SAGE) technology. J Immunol Methods 2001;250(1e2):45e66.
[148] Takahashi H, Kato S, Murata M, Carninci P. CAGE (cap analysis of gene expression):
a protocol for the detection of promoter and transcriptional networks. Humana Press;
2012.
[149] Singh G, Pratt G, Yeo GW, Moore MJ. The clothes make the mRNA: past and present
trends in mRNP fashion. Annu Rev Biochem 2015;84:325e54.
[150] Workman TA. Engaging patients in information sharing and data collection: the role of
patient-powered registries and research networks. Rockville (MD): Agency for
Healthcare Research and Quality (US); 2013.
[151] Fleurence RL, Beal AC, Sheridan SE, Johnson LB, Selby JV. Patient-powered research
networks aim to improve patient care and health research. Health Aff 2014;33(7):
1212e9.
[152] Bashir R. BioMEMS: state-of-the-art in detection, opportunities and prospects. Adv
Drug Deliv Rev 2004;56(11):1565e86.
[153] Holzinger M, Le Goff A, Cosnier S. Nanomaterials for biosensing applications: a
review. Front Chem 2014;2:63.
[154] Black AD, Car J, Pagliari C, Anandan C, Cresswell K, Bokun T, et al. The impact of
eHealth on the quality and safety of health care: a systematic overview. PLoS Med
2011;8(1):e1000387.
[155] Kay M, Santos J, Takane M. mHealth: new horizons for health through mobile
technologies. World Health Organ 2011;64(7):66e71.
[156] Häyrinen K, Saranto K, Nykänen P. Definition, structure, content, use and impacts of
electronic health records: a review of the research literature. Int J Med Inform 2008;
77(5):291e304.
References 63](https://image.slidesharecdn.com/pezoulas2020-250416102837-4cafedd0/75/Chapter-2-of-Medical-Data-Health-Records-45-2048.jpg)
![[157] Dolin RH, Alschuler L, Beebe C, Biron PV, Boyer SL, Essin D, et al. The HL7 clinical
document architecture. J Am Med Assoc 2001;8(6):552e69.
[158] Rubinstein WS, Maglott DR, Lee JM, Kattman BL, Malheiro AJ, Ovetsky M, et al.
The NIH genetic testing registry: a new, centralized database of genetic tests to enable
access to comprehensive information and improve transparency. Nucleic Acids Res
2012;41(D1):D925e35.
[159] Hasin Y, Seldin M, Lusis A. Multi-omics approaches to disease. Genome Biol 2017;
18(1):83.
[160] Umscheid CA, Margolis DJ, Grossman CE. Key concepts of clinical trials: a narrative
review. Postgrad Med 2011;123(5):194e204.
[161] Unger JM, Cook E, Tai E, Bleyer A. The role of clinical trial participation in cancer
research: barriers, evidence, and strategies. Am Soc Clin Oncol Educ Book 2016;
36:185e98.
[162] Bellary S, Krishnankutty B, Latha MS. Basics of case report form designing in clinical
research. Perspect Clin Res 2014;5(4):159e66.
[163] Van Essen DC, Smith SM, Barch DM, Behrens TE, Yacoub E, Ugurbil K. The Wu-
Minn human connectome project: an overview. Neuroimage 2013;80:62e79.
[164] Maglott D, Ostell J, Pruitt KD, Tatusova T. Entrez gene: gene-centered information at
NCBI. Nucleic Acids Res 2005;33(Suppl. l_1):D54e8.
[165] Caruana EJ, Roman M, Hernández-Sánchez J, Solli P. Longitudinal studies. J Thorac
Dis 2015;7(11):E537e40.
[166] Szumilas M. Explaining odds ratios. J Can Acad Child Adolesc Psychiatry 2010;19(3):
227e9.
[167] Austin PC. The performance of different propensity-score methods for estimating dif-
ferences in proportions (risk differences or absolute risk reductions) in observational
studies. Stat Med 2010;29(20):2137e48.
[168] Olivier J, Bell ML. Effect sizes for 2 2 contingency tables. PLoS One 2013;8(3):
e58777.
[169] Rubinov M, Sporns O. Complex network measures of brain connectivity: uses and
interpretations. Neuroimage 2010;52(3):1059e69.
[170] Glasser MF, Coalson TS, Robinson EC, Hacker CD, Harwell J, Yacoub E, et al.
A multi-modal parcellation of human cerebral cortex. Nature 2016;536(7615):171e8.
[171] De Las Rivas J, Fontanillo C. Proteineprotein interactions essentials: key concepts to
building and analyzing interactome networks. PLoS Comput Biol 2010;6(6):
e1000807.
[172] Tsiouris KM, Pezoulas VC, Zervakis M, Konitsiotis S, Koutsouris DD, Fotiadis DI.
A long short-term memory deep learning network for the prediction of epileptic sei-
zures using EEG signals. Comput Biol Med 2018;99:24e37.
[173] Eryaman Y, Zhang P, Utecht L, Kose K, Lagore RL, DelaBarre L, et al. Investigating
the physiological effects of 10.5 Tesla static field exposure on anesthetized swine.
Magn Reson Med 2018;79:511e4.
[174] Lindon JC, Nicholson JK, Holmes E, editors. The handbook of metabonomics and
metabolomics. Elsevier; 2011.
[175] Christensen S, Mogelvang R, Heitmann M, Prescott E. Level of education and risk of
heart failure: a prospective cohort study with echocardiography evaluation. Eur Heart J
2010;32(4):450e8.
64 CHAPTER 2 Types and sources of medical and other related data](https://image.slidesharecdn.com/pezoulas2020-250416102837-4cafedd0/75/Chapter-2-of-Medical-Data-Health-Records-46-2048.jpg)
![[176] Vos SJ, Xiong C, Visser PJ, Jasielec MS, Hassenstab J, Grant EA, et al. Preclinical Alz-
heimer’s disease and its outcome: a longitudinal cohort study. Lancet Neurol 2013;
12(10):957e65.
[177] Hyldgaard C, Hilberg O, Pedersen AB, Ulrichsen SP, Løkke A, Bendstrup E, et al.
A population-based cohort study of rheumatoid arthritis-associated interstitial lung
disease: comorbidity and mortality. Ann Rheum Dis 2017;76(10):1700e6.
[178] Driver JA, Smith A, Buring JE, Gaziano JM, Kurth T, Logroscino G. Prospective
cohort study of type 2 diabetes and the risk of Parkinson’s disease. Diabetes Care
2008;31(10):2003e5.
[179] Shorvon SD, Goodridge DM. Longitudinal cohort studies of the prognosis of epilepsy:
contribution of the National General Practice Study of Epilepsy and other studies.
Brain 2013;136(11):3497e510.
[180] Kuehn T, Bauerfeind I, Fehm T, Fleige B, Hausschild M, Helms G, et al. Sentinel-
lymph-node biopsy in patients with breast cancer before and after neoadjuvant chemo-
therapy (SENTINA): a prospective, multicentre cohort study. Lancet Oncol 2013;
14(7):609e18.
References 65](https://image.slidesharecdn.com/pezoulas2020-250416102837-4cafedd0/75/Chapter-2-of-Medical-Data-Health-Records-47-2048.jpg)


